Reports 1-1 of 1 Clear search Modify search
AdV-COM (1/√f noise)
mwas - 13:15 Thursday 15 January 2026 (68487) Print this report
EDB OMC scans overnight

Yesterday (Jan 14) around 21:00 UTC I have started continous scan of the EDB OMC, these are still ongoing. By mistake I have made them 4 times slower than OMC scans done in the past, so the location of the various HOM is not the same as a function of temperature. However, a good side of that is that there should be much less aberration created inside the OMC itself due to a thermal gradient due to rapid changes in temperature.

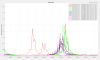
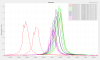
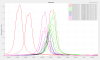
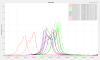
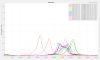
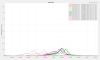
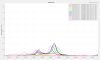
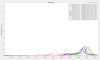
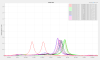
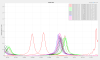
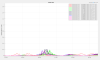
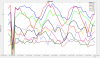
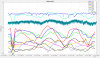
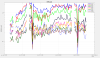
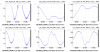
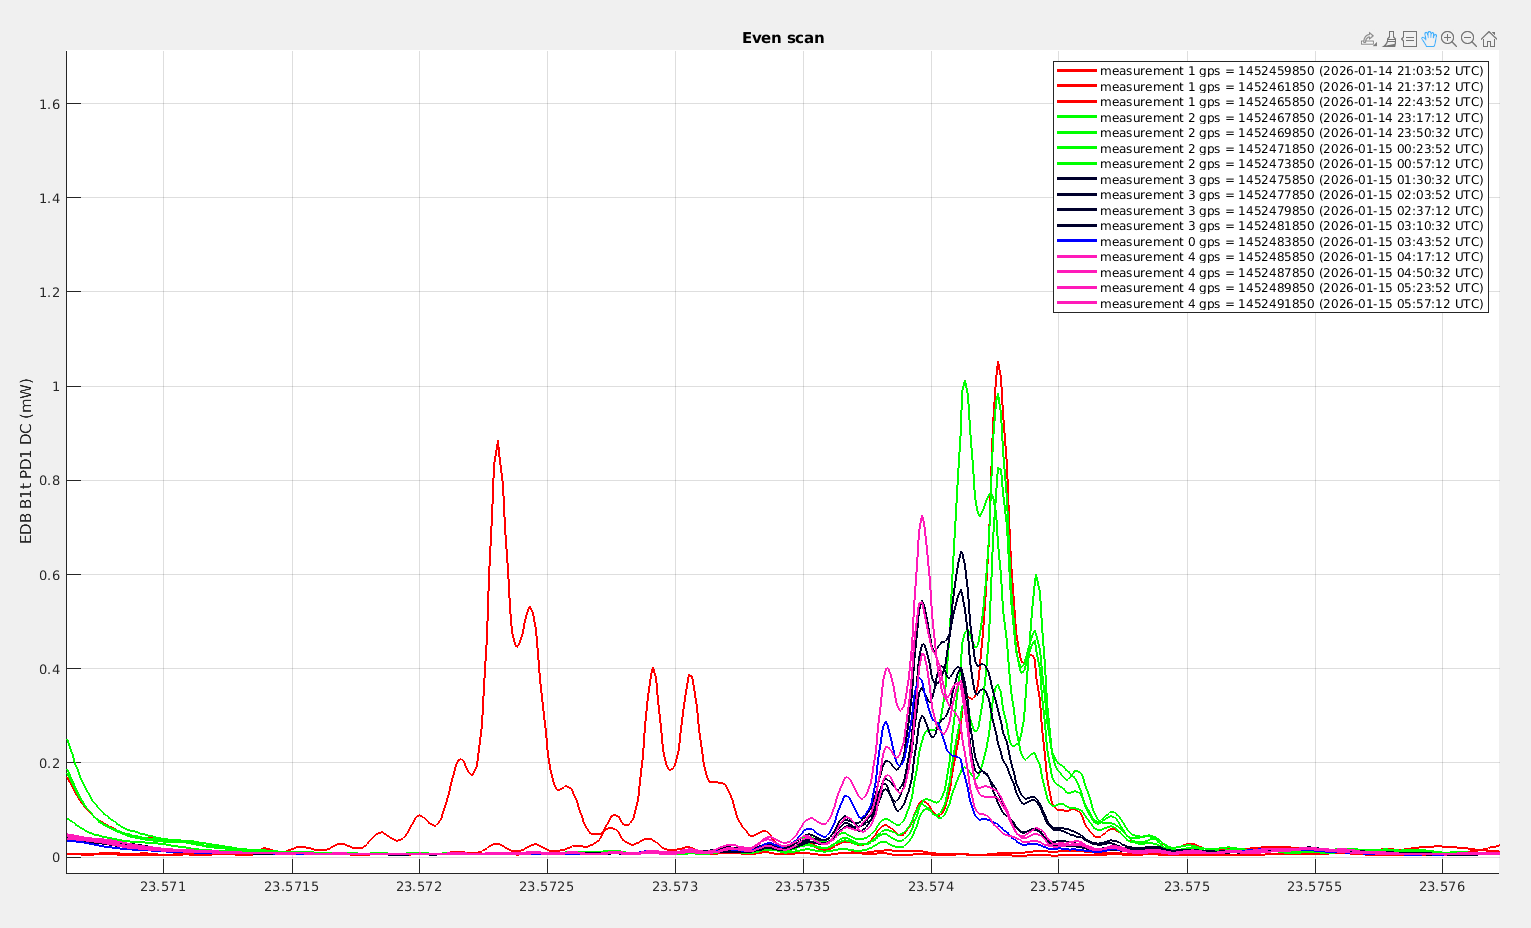
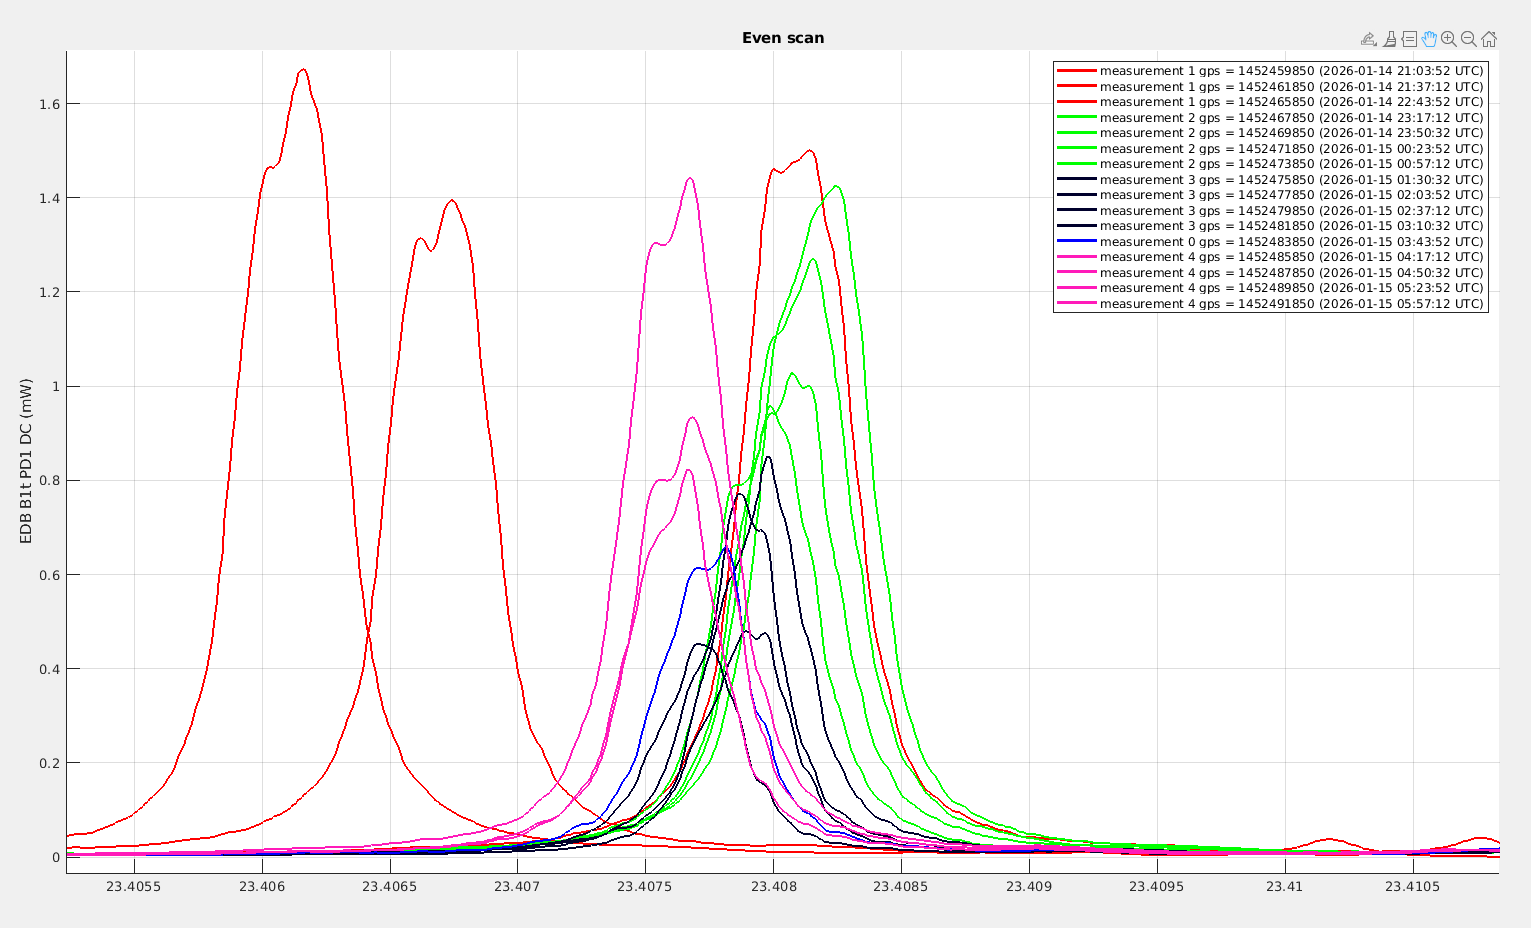
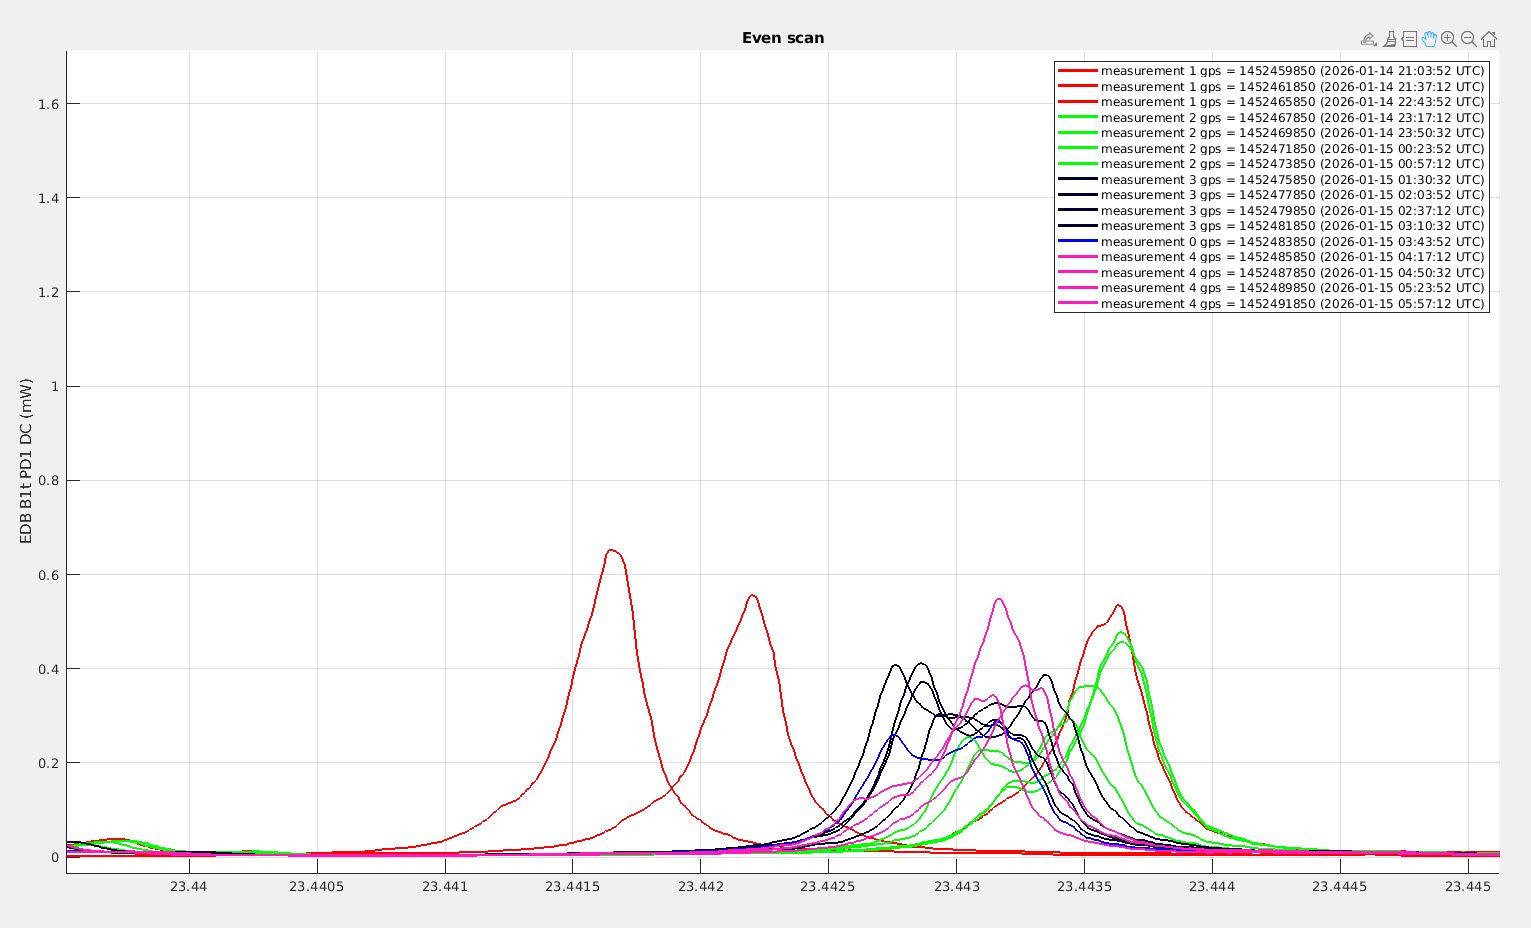
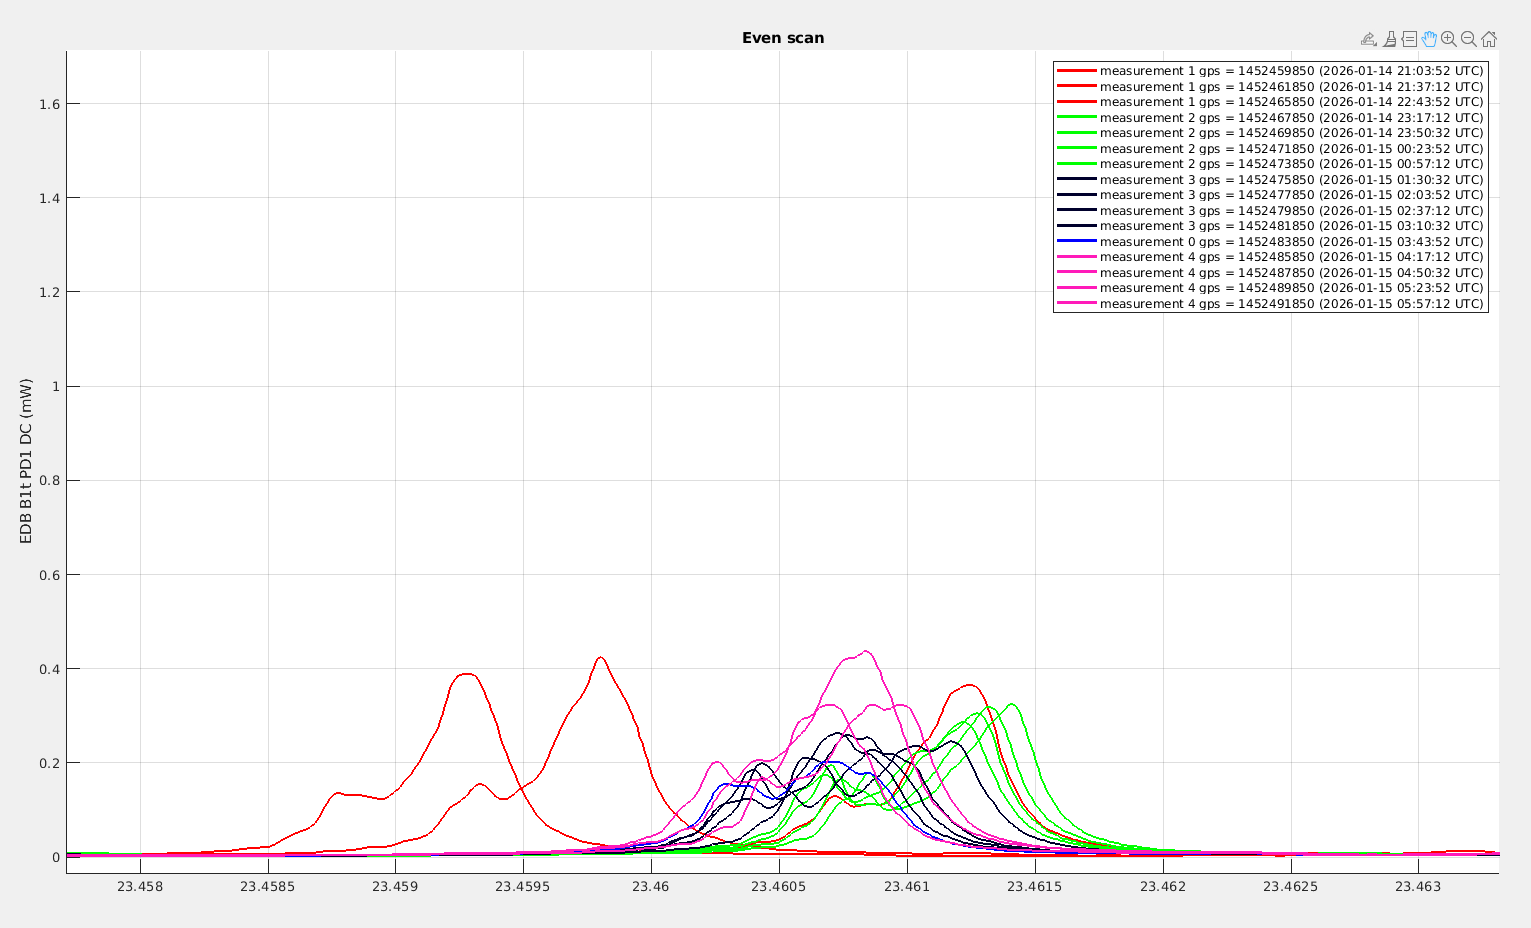
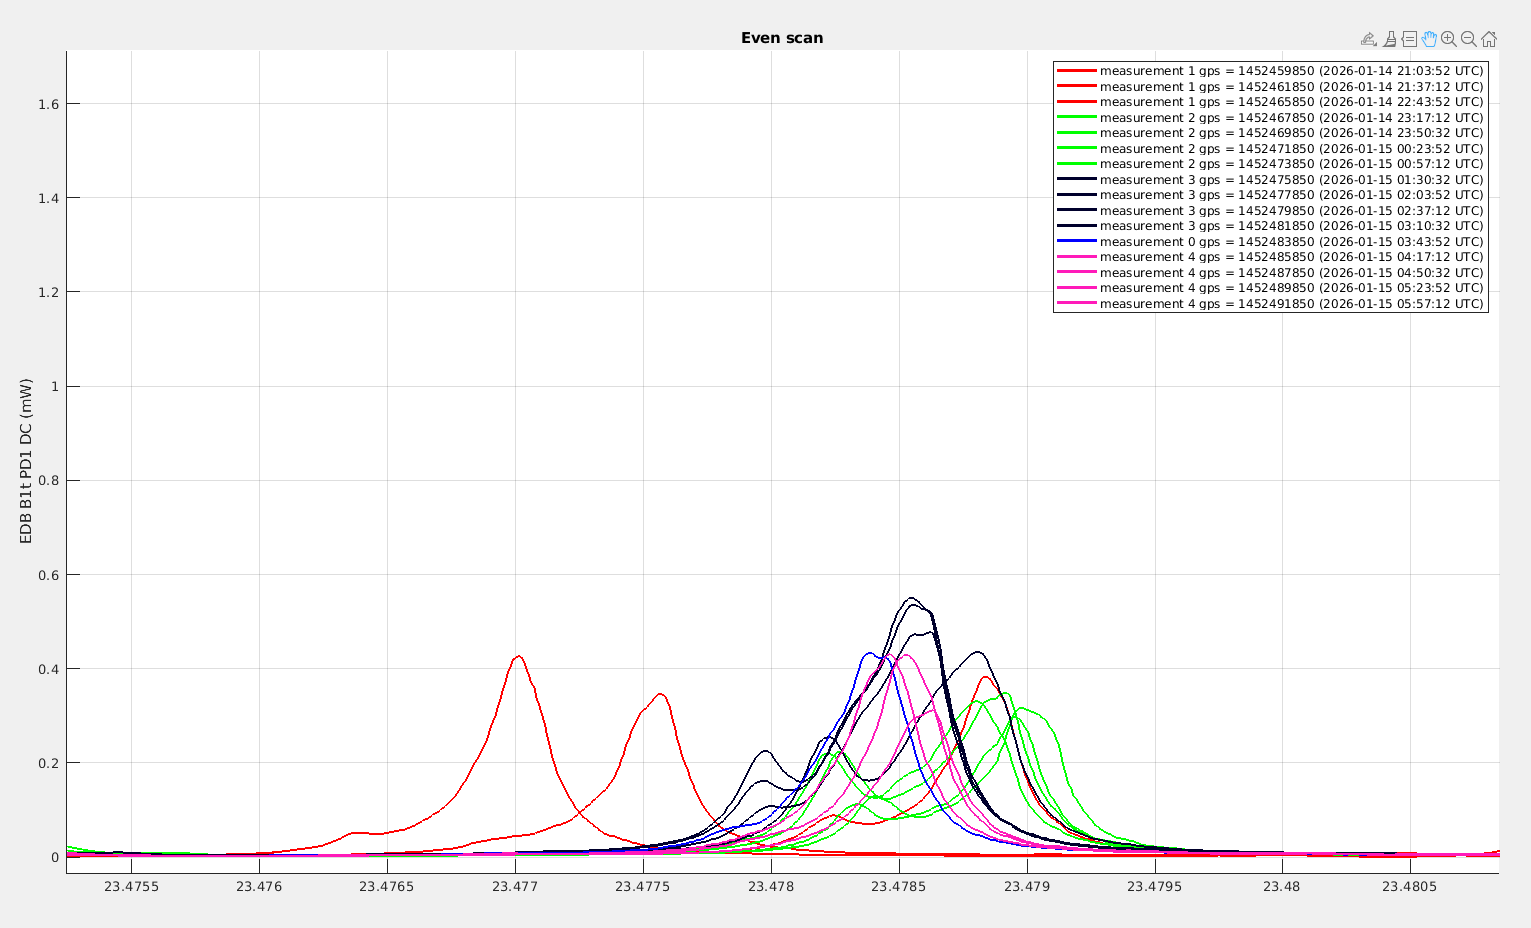
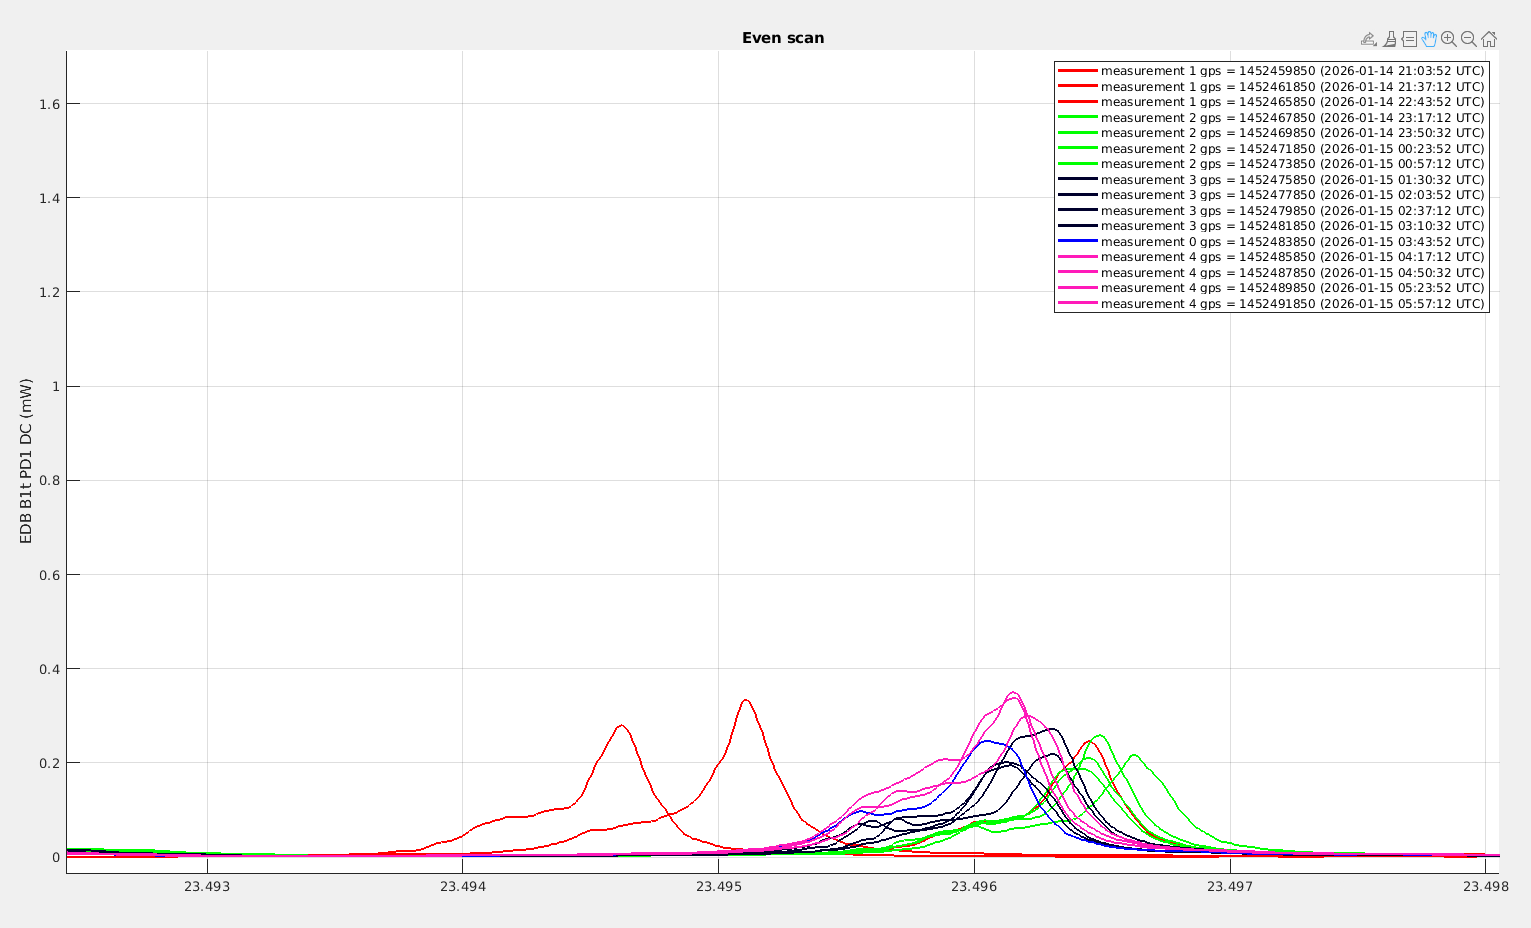
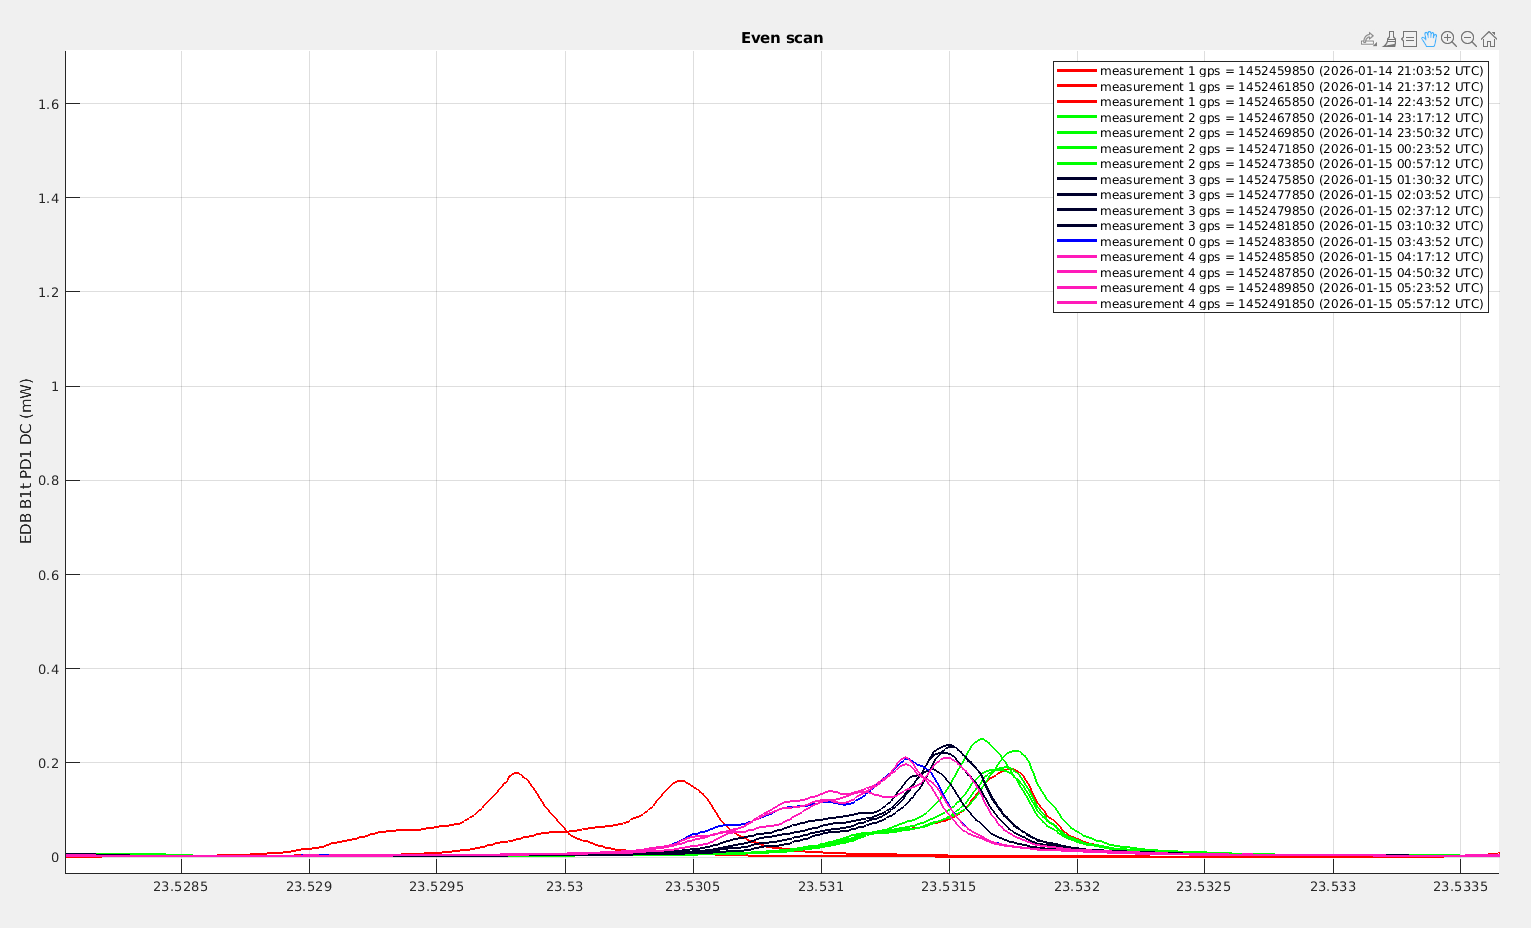
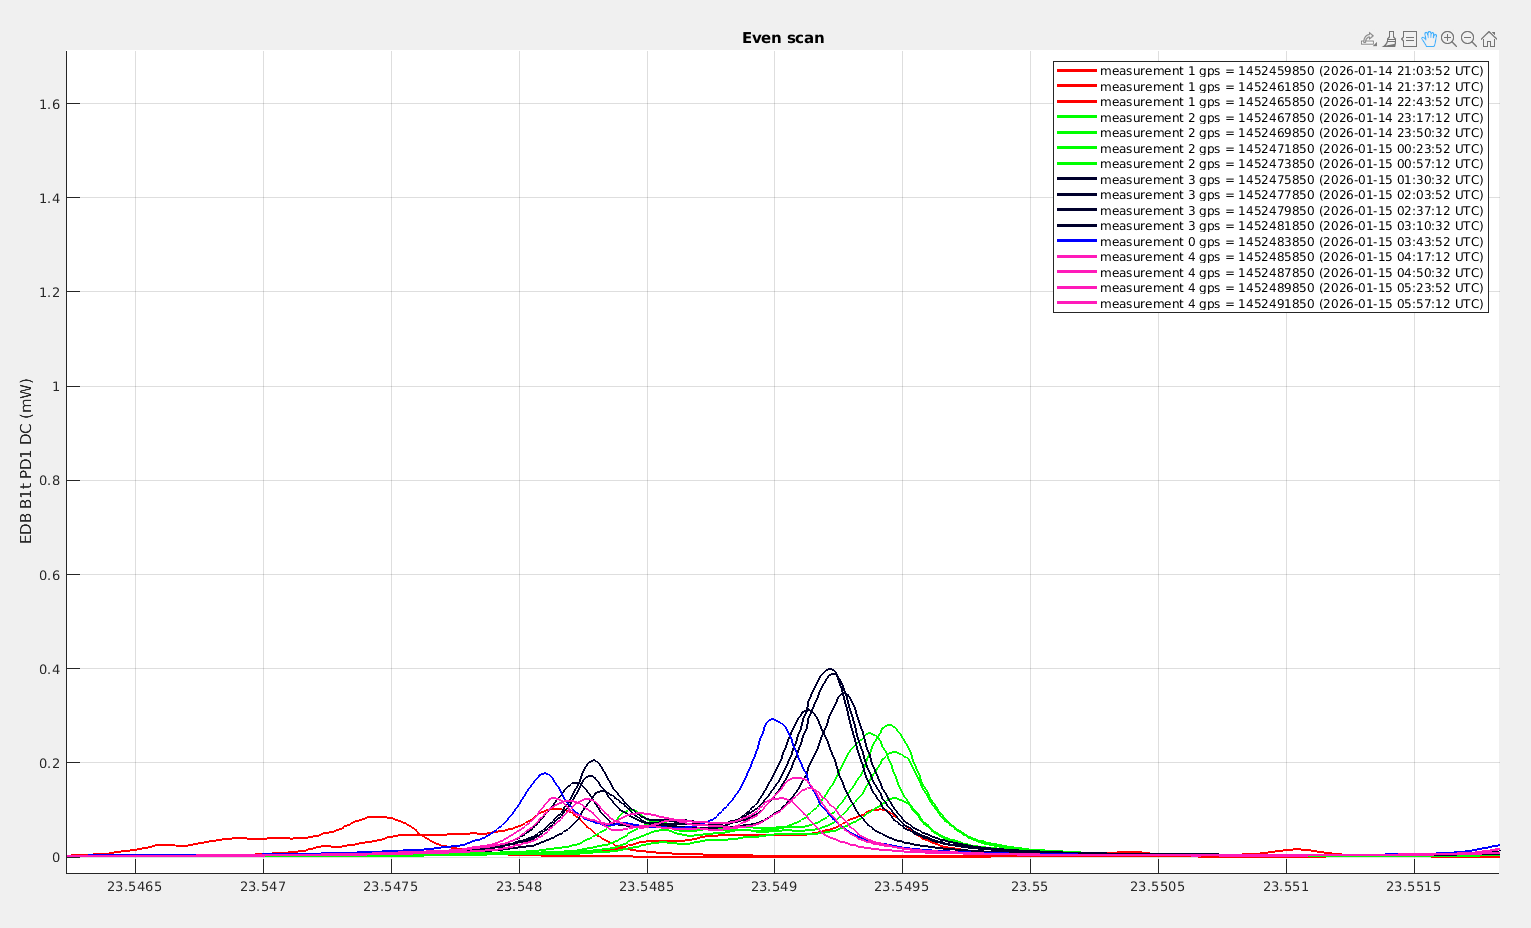
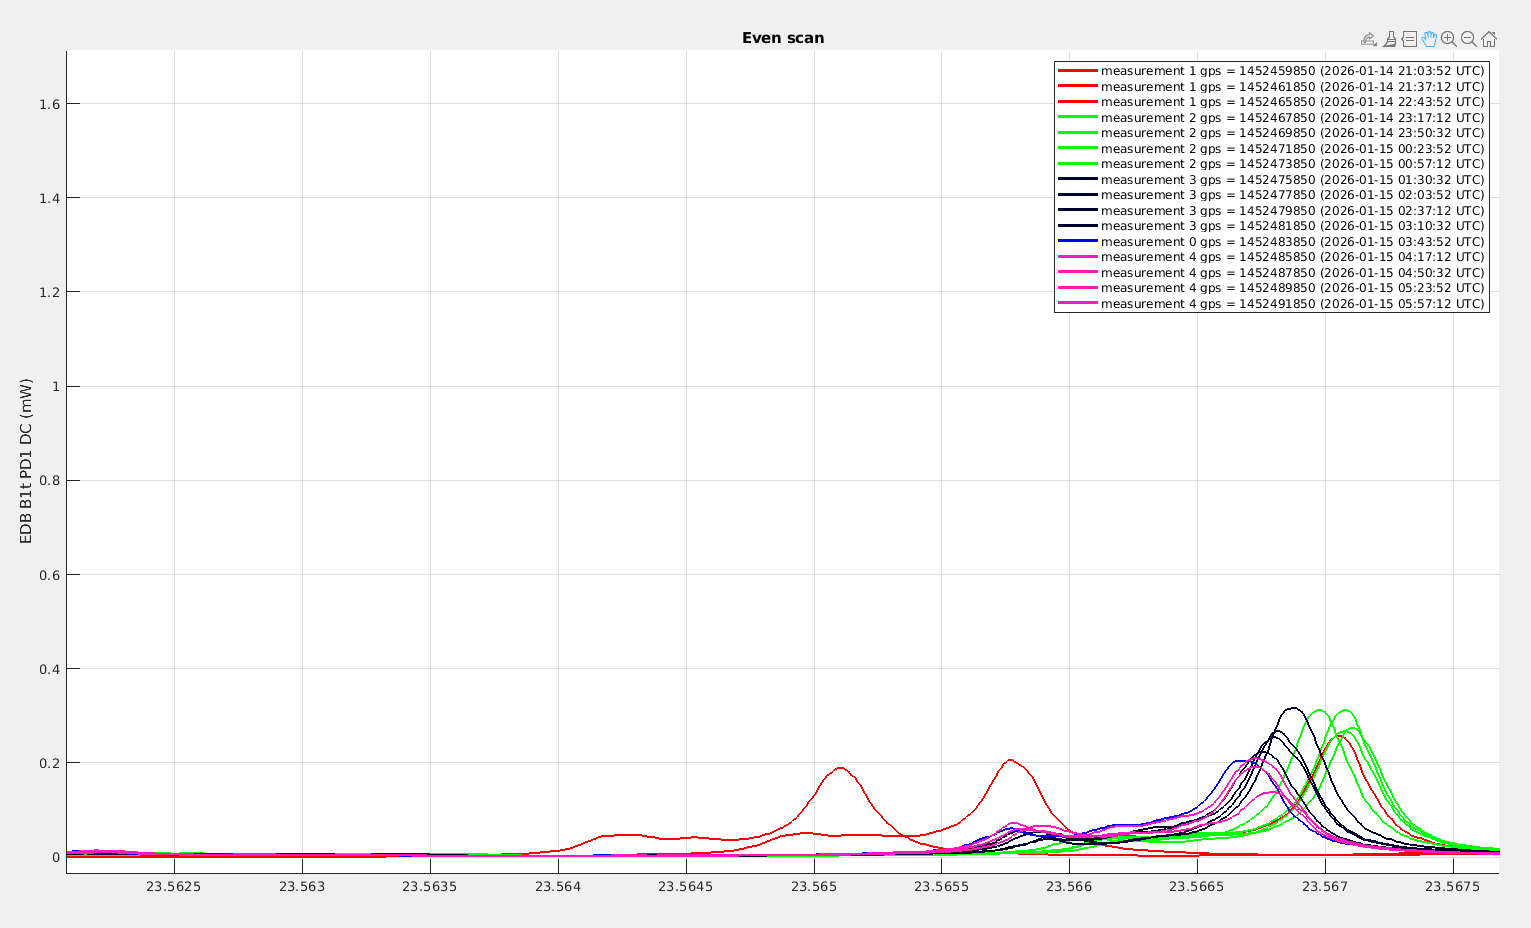
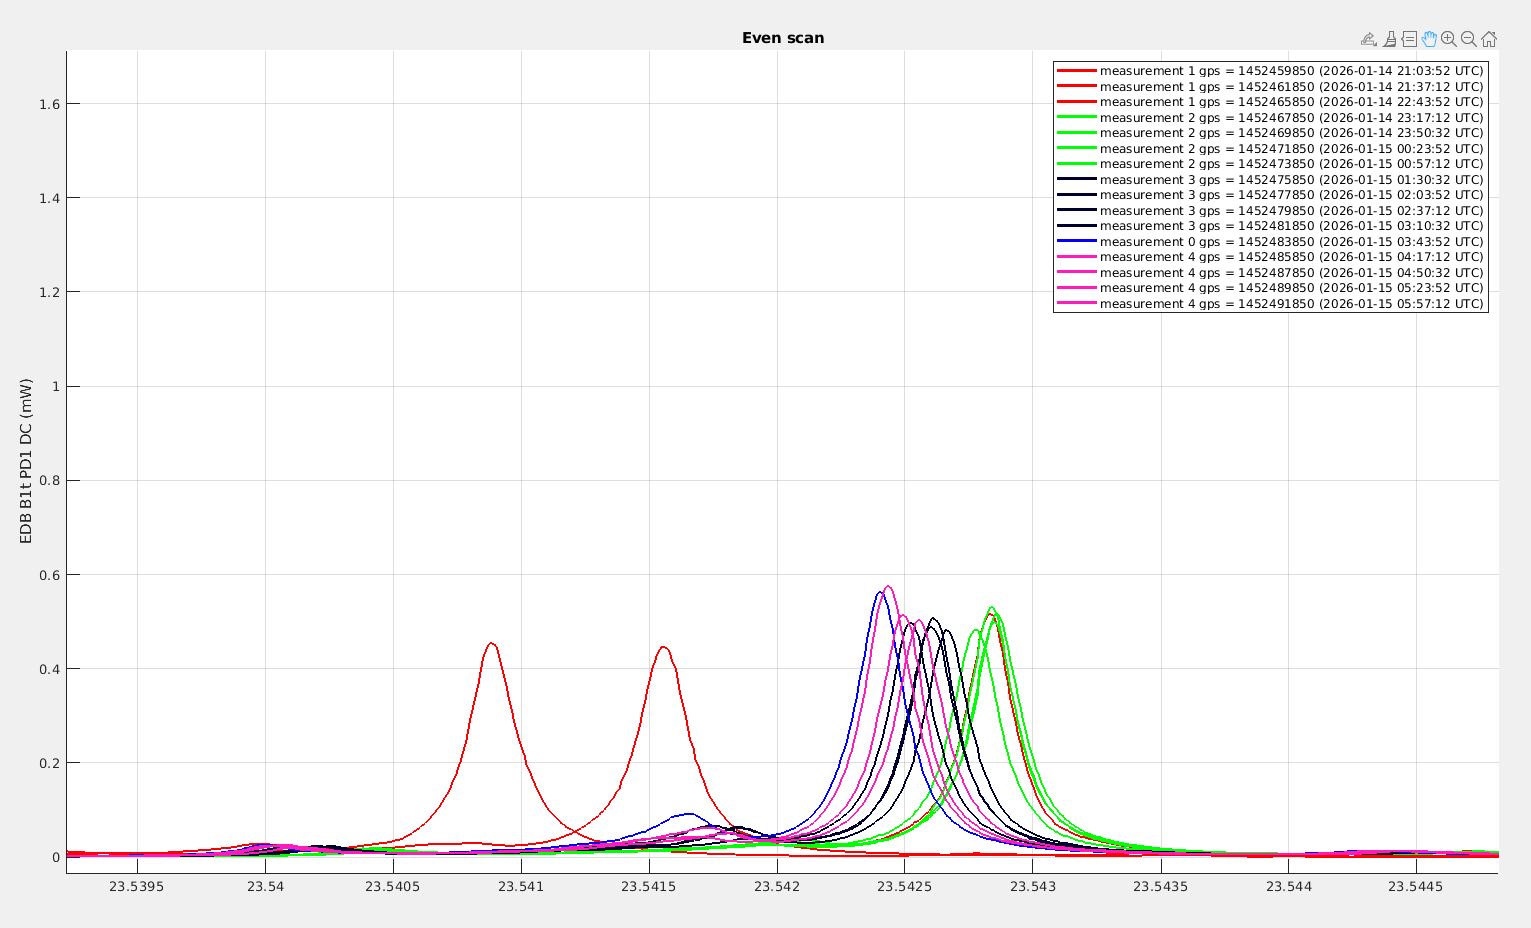
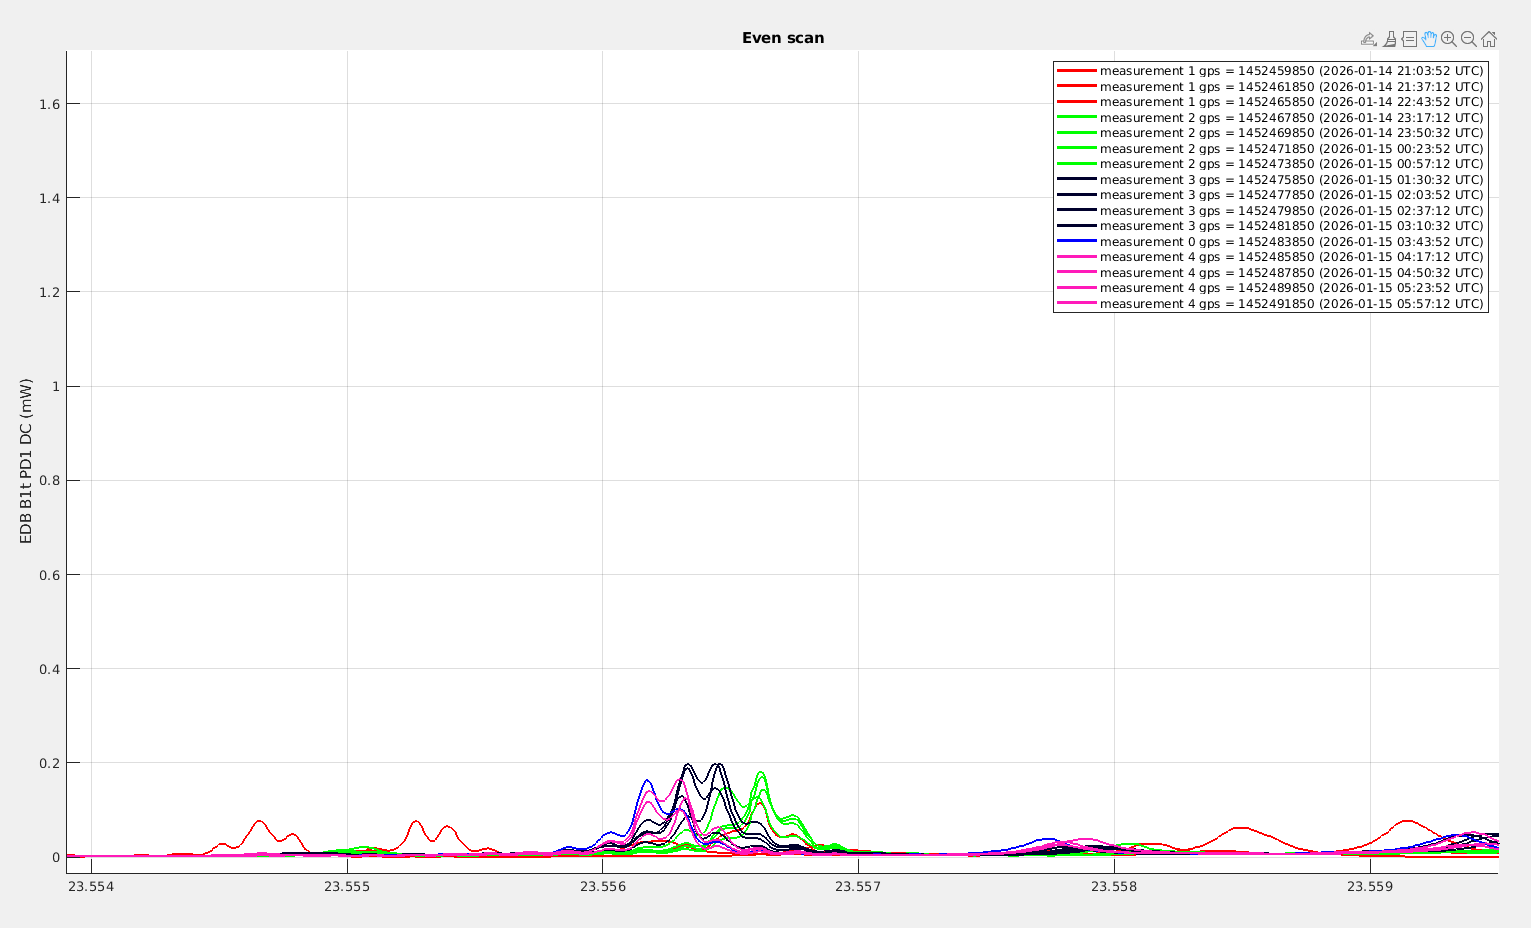
Figure 1-12 show the carrier HOM from 1 to 12, the color just split the scans into 5 groups as a function of time. Figure 13 and 14 shows the 56MHz TEM00 upper and lower sidebands. And finally figure 15 shows the carrier TEM00.

On figure 1 and 15, carrier TEM00 and order 1 mode, there is an oscillation superposed to each peak. These have always been present, and I expect that these correspond to alignment fluctuations. It also means that the TEM00 present on the EDB OMC is dominated by HOM converted back into TEM00 by alignment oscillations.

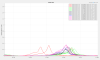
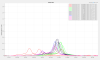
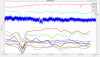
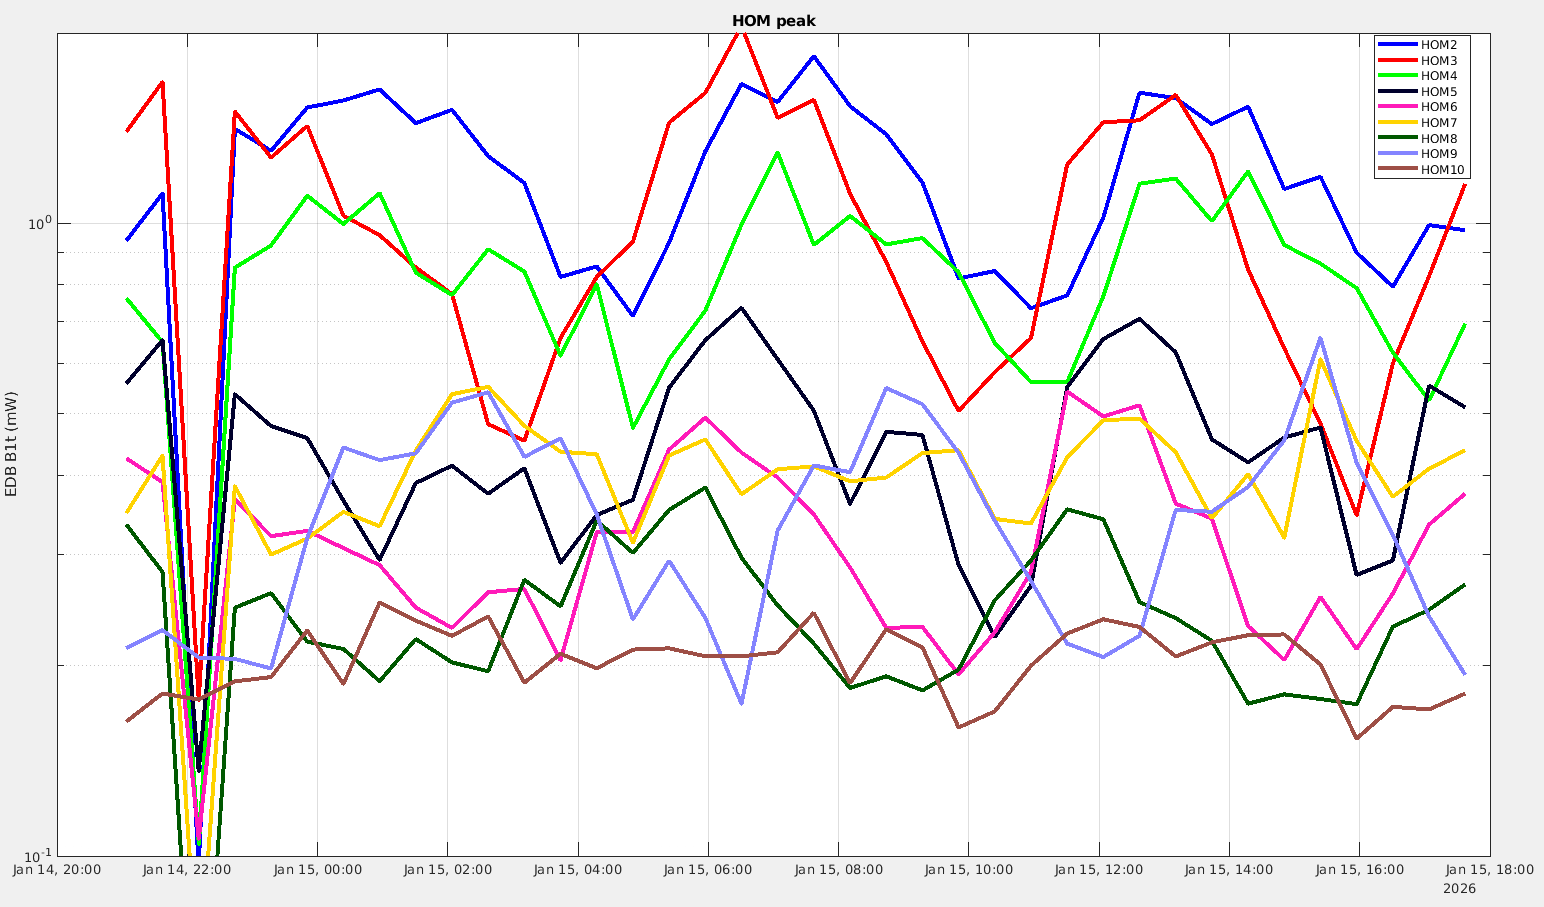
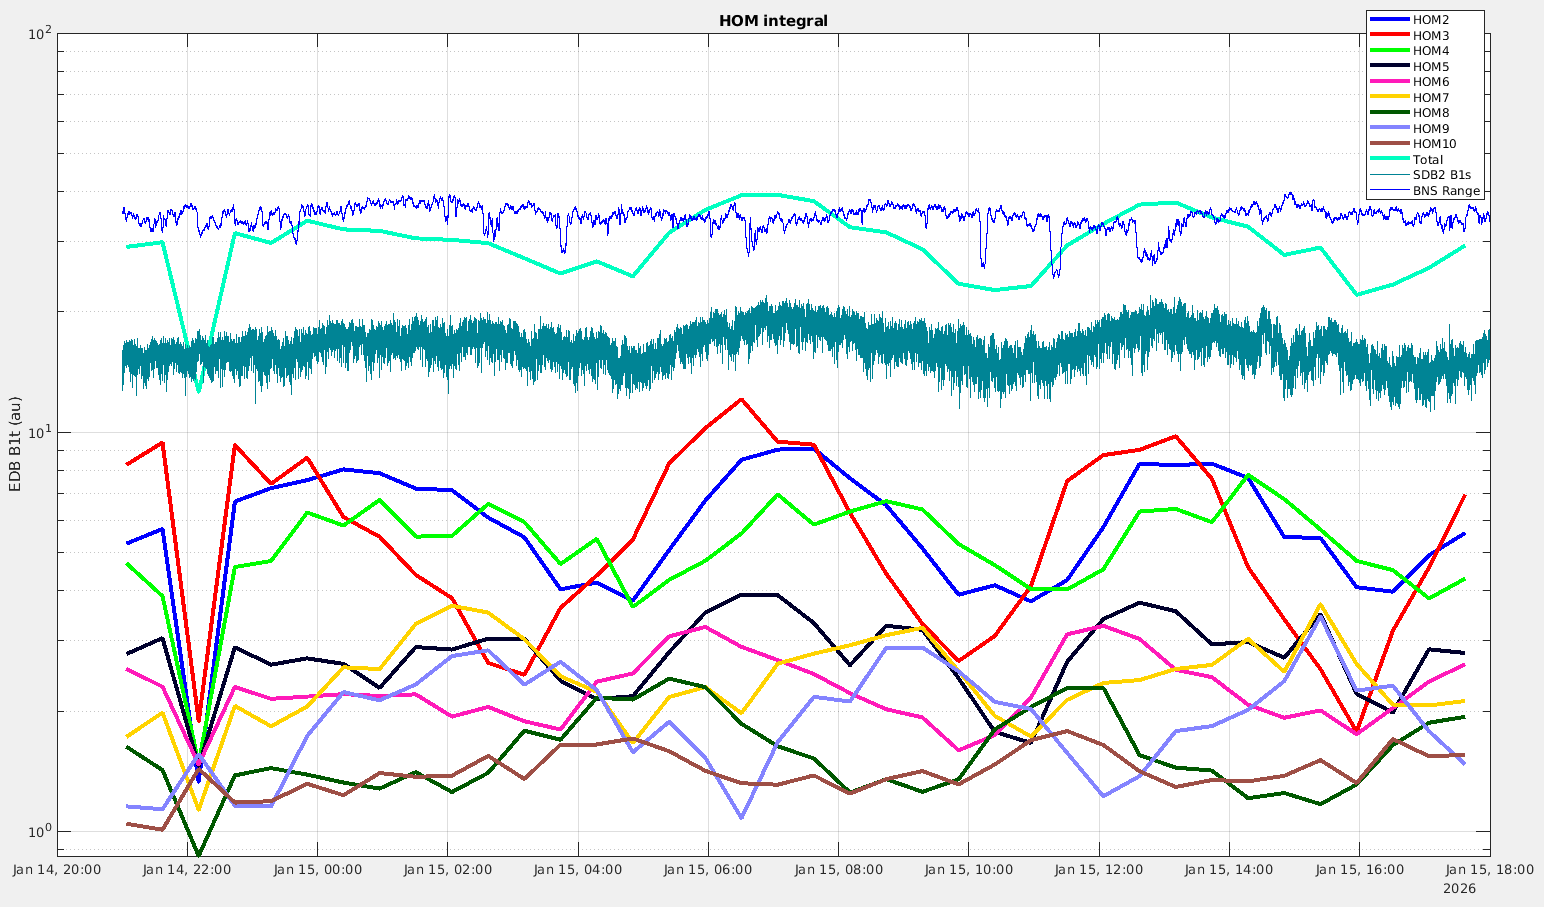
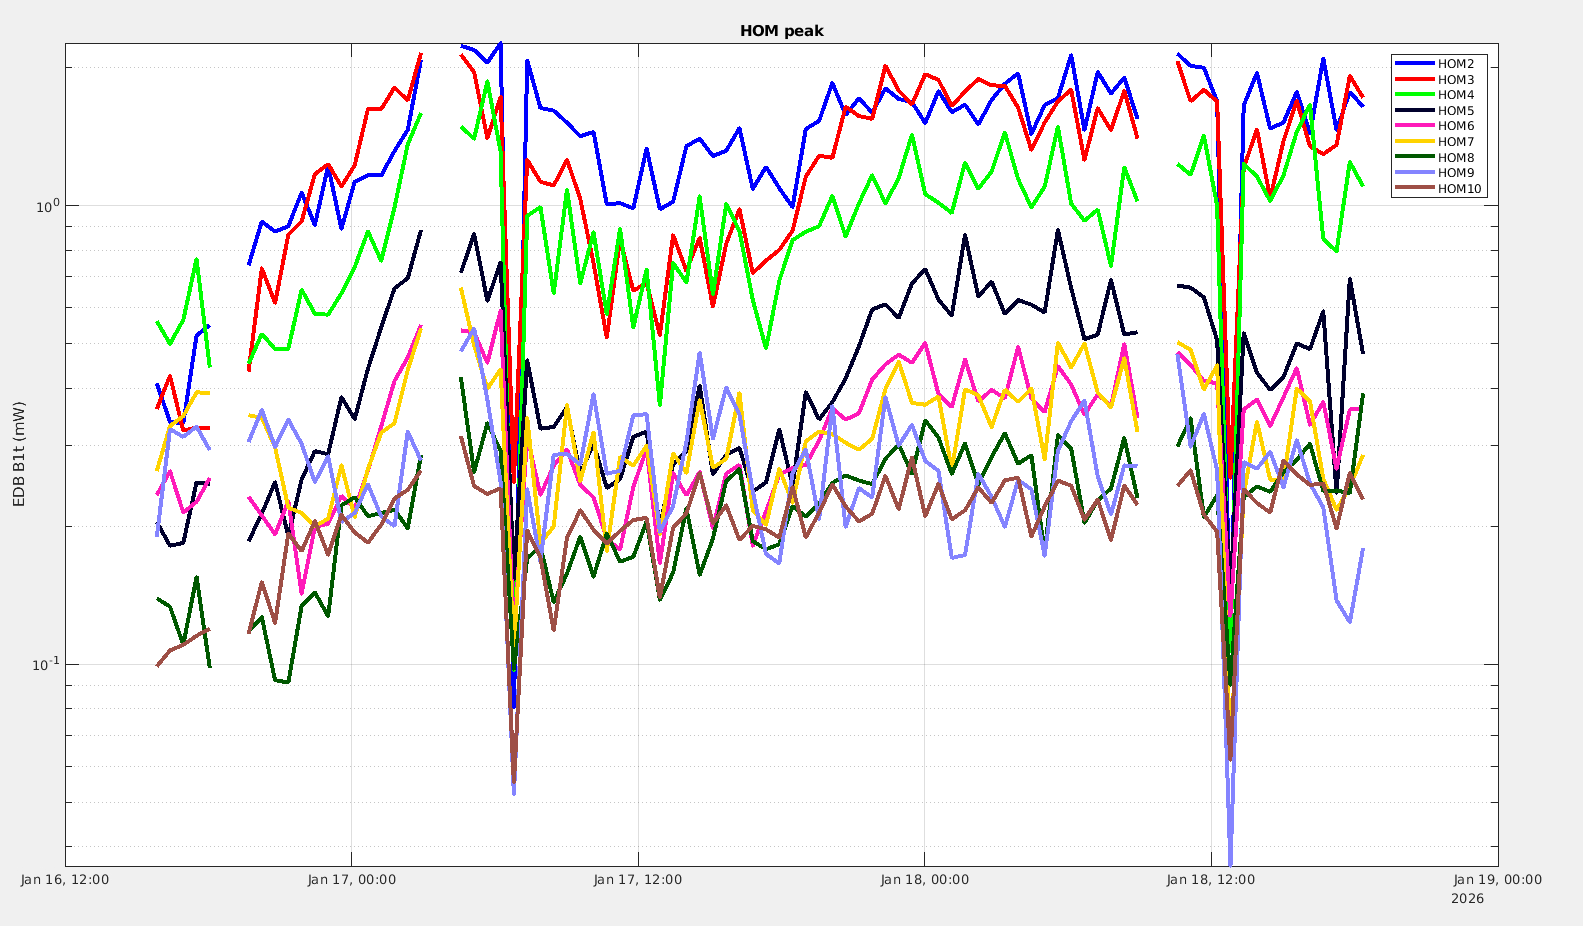
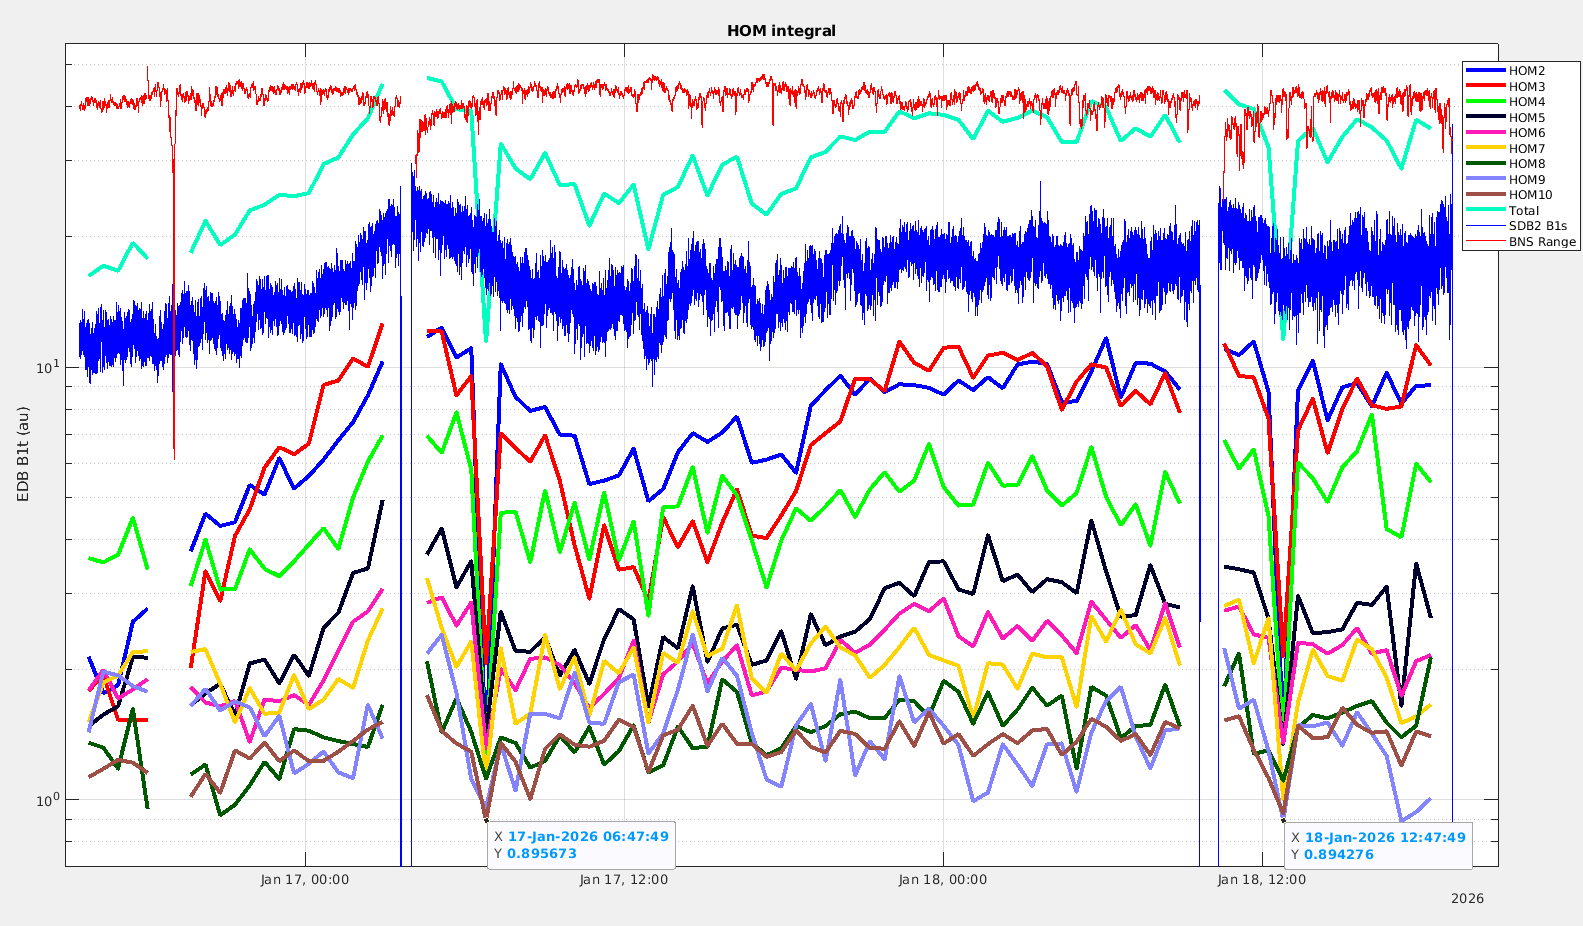
These measurements are done in parallel of the etalon loop being turned on a going through fringes, which are clearly visible in the power in the arms, B1p, BNS range, etc. On figure 3 one can see that on the black lines between 1:30 UTC and 3;00 UTC the power of the order 3 mode decreases by up to a factor 3 compared to other times. On figure 9 and to a lesser extent figure 7, one can see that the order 9 mode and to a lesser extent the order 7 mode increases at the same time as the order 3 mode decreases.

/users/mwas/OMC/EDB_OMC_fast_scan_20260114/EDB_OMC_fast_scan.m

Images attached to this report
Comments to this report:
mwas - 8:56 Friday 16 January 2026 (68500) Print this report

The scans have continued during yesterday, but looking at them directly becomes intractable because there is too many of them. Instead I have made a simple analysis of each of the HOM temperature regions based on the limit of the figures in the previous logbook entry. That is for each 5mK region around the HOM take the peak value of the EDB OMC transmission, and the integral of the transmission over that 5mK region. The motivation for having an integral is that the HOM of higher orders become more spread, and the integral should be an approximation of the total power of a given order N from TEM_N0 to TEM_0N.

Figure 1 shows the time series of the mode peaks, the etalon fringes are clearly visible, especially for the order 2 and order 3 modes. But all of the modes are not synchronized as noticed previously. The order 2 mode maximum is slightly after the order 3 mode, while the order 9 mode is almost exactly in opposite phase as mentioned previously. The drop on Jan 14 at 22:00 is because the OMC scan was disutrbed and the HOM peaks were not inside the preselected temperature regions. 

Figure 2 shows the time series of the mode integrals. To compare it with B1s there is also the sum of the first 10 modes. The sum of the modes follow relatively well what is seen directly on B1s, but with more dynamic as the sum changes by up to a factor 1.6 while B1s changes only by up to a factor 1.35. This could be explained by the fact that B1s contains more than just the first 10 modes, and the modes from 10 and above are not affected by etalon fringes anymore. Some of the HOM change by much larger factors, for example the order 3 mode change by a factor 4.

The B1s etalon fringes are not in phase with the BNS range fringes, but looking at the individual modes the BNS range is higher for low power on the order 8 mode. I don't see a physical reasons for it, so I expect it is a coincidence. Also the BNS range is higher whenever the order 9 mode is higher. The fact that the order 8 and 9 are out phase could make sense, as they are both close to co-resonating in the arm cavities, so we could be oscillating between being close to the order 8 mode or order 9 mode. But how the etalon effect does that is puzzling.

/users/mwas/OMC/EDB_OMC_fast_scan_20260114/EDB_OMC_slow_scan.m

Images attached to this comment
mwas - 17:26 Tuesday 20 January 2026 (68531) Print this report

The EDB OMC scans have continued throughout the weekend, up to Jan 18 20:20 UTC, when the interferometer unlock turned off the Vbias of the photodiode in transmission (EDB B1t). An action would be to add in the automation renabling the voltage bias of that photodiode after each lock acquisition. For most unlocks this is not needed, as the OMC scans so most of the time it is far from the resonance during the unlock, but on occasion it will be on resonance which will turn off its voltage bias and close the shutter. 

Figure 1 shows the peak height of the different HOM over 50 hours, with two scans that where too far from normal resulting in drops in measured HOM power, on Jan 16 around 12:00 and Jan 18 around 13;00.

Figure 2 shows the integrated HOM power over 50 hours, as before there is a large change in HOM power due to the etalon especially for modes 2, 3, and 4. And the etalon has settled in a set point with high HOM power, also visible on B1s. This has been adjusted since the weekend on Monday by a change of etalon set point. This long trend give us an idea on the stability of the measurement, the fluctuations over the time scale of a few hours are of the order of +/-20% of power, with more variability for the order 9 mode.

/users/mwas/OMC/EDB_OMC_fast_scan_20260116/EDB_OMC_slow_scan.m

Images attached to this comment
mwas - 7:33 Wednesday 21 January 2026 (68537) Print this report

Figure 1. Looking at the HOM from this night the level is fairly low when comparing to the etalon fringes from a few days ago. The order 3 mode is still relatively high, and looking at the etalon fringes it is for example comparable to Jan 15 at 11:30 UTC, while a lower power was achieved at 10:30 UTC on Jan 15. So reducing the etalon by the temperature change that occurred in 1h on Jan 15 could help, about 0.05 degree Celcius lower temperature, It was also corresponding to higher BNS range, although the maximum was even further away at ~9:00 UTC on Jan 15. 0.05 degree lower temperature that last night actually correspond to the set point of the loop, as the temperature of the RH was about 0.05 degree higher than the set point for both NI and WI, so it should converge to the slightly better working point by itself.

/users/mwas/OMC/EDB_OMC_fast_scan_20260120/EDB_OMC_slow_scan.m

Images attached to this comment
gouaty, bersanetti - 17:45 Wednesday 21 January 2026 (68540) Print this report

The PD flag in the DMS had been updated to include a check on the EDB B1t photodiode Vbias. The flag should turn red whenever the Vbias of this photodiode is not engaged after DC readout.

The DetMoni process was restarted at 16h45 utc.

bersanetti, gouaty - 0:26 Thursday 22 January 2026 (68541) Print this report

The configuration for EDB_B1t has been added to META_library, and the engagement of the PD has been added just before reaching LOCKED_DC_READOUT. To be tested at the next acquisition.

bersanetti - 0:32 Thursday 22 January 2026 (68545) Print this report

Tonight I found the automation stuck in LOCKING_DC_READOUT, because the new command to enable EDB_B1t was not working:

2026-01-21T22:52:40.581Z ITF_LOCK [LOCKING_DC_READOUT.run] USERMSG 0: EZCA CONNECTION ERROR: Any Other Error: Could not get value from channel: SDB_B1t_PD1_VBias

Looking at the error, META_library and the new configuration, one hypothesis is that the function that enables Vbias extracts the name of the bench from the first segment of the process name, but in this very specific case the name of the process and the name of the bench do not share the same segment (SDB and EDB respectvely), so the standard function cannot work and something specific needs to be devised.

I commented the engagement of EDB_B1t and the lock acquisition could proceed. To be debugged tomorrow.

Another long standing bug is that the autorelock selected LOW_NOISE_2 instead of LOW_NOISE_3_ALIGNED as target state. This used to happen with LOW_NOISE_1 and LOW_NOISE_3 as target, but the recent increase of states made the bug scale up the wrong request as well.

Search Help
×

Warning

Error

The present report has been modified outside this window. Please check for its integrity in the main page.

Refreshing this page will move this report into drafts.

×