Reports 1-1 of 1 Clear search Modify search
AdV-TCS (CO2 laser projector)
bersanetti, casanueva, magazzu, gouaty, melo, nardecchia, pinto, spinicelli, rocchi - 22:15 Tuesday 28 October 2025 (68051) Print this report
NI absorption measurement

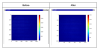
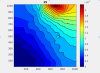
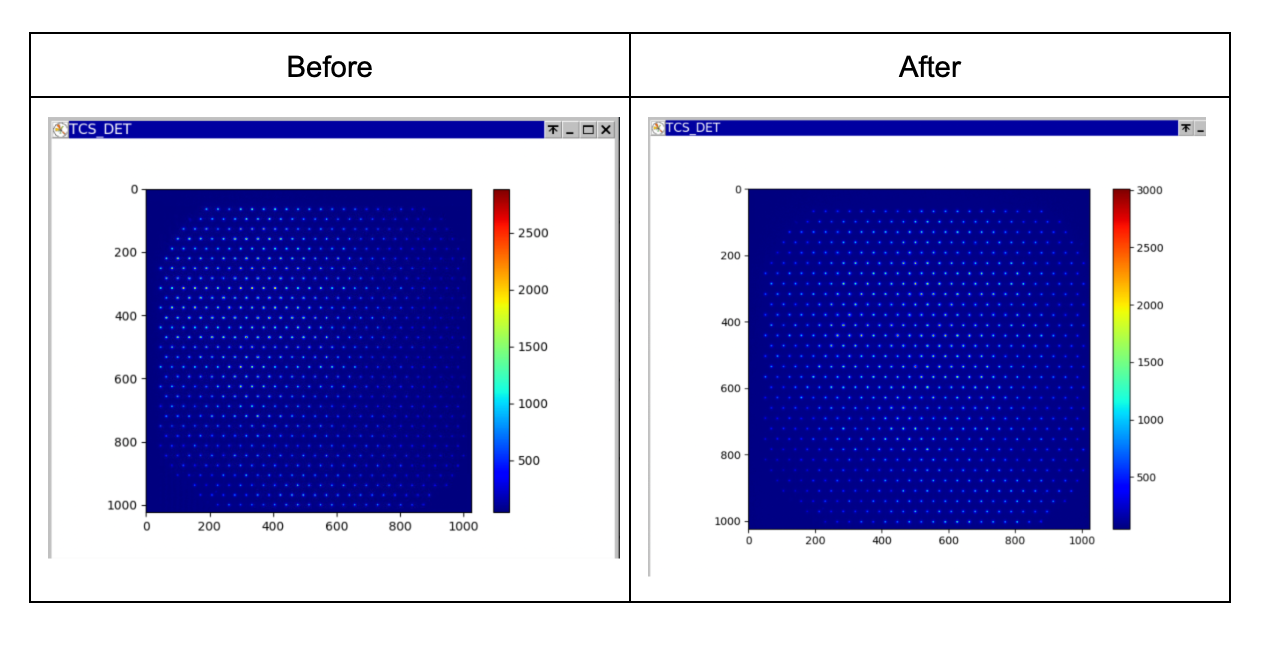
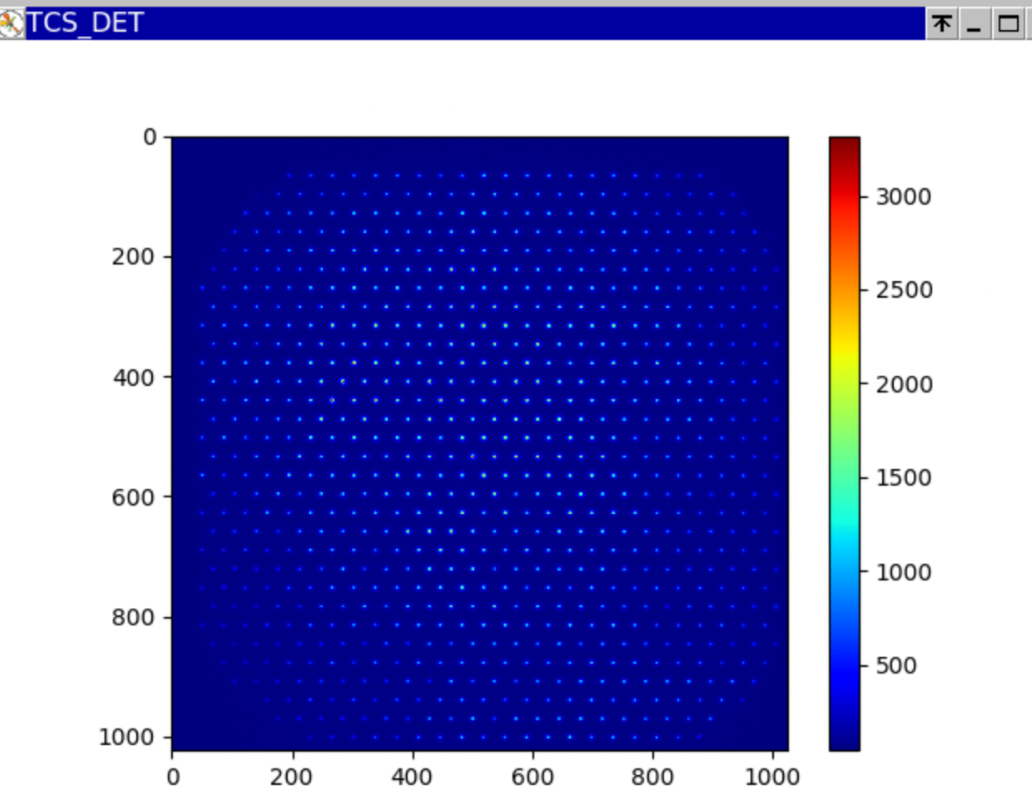
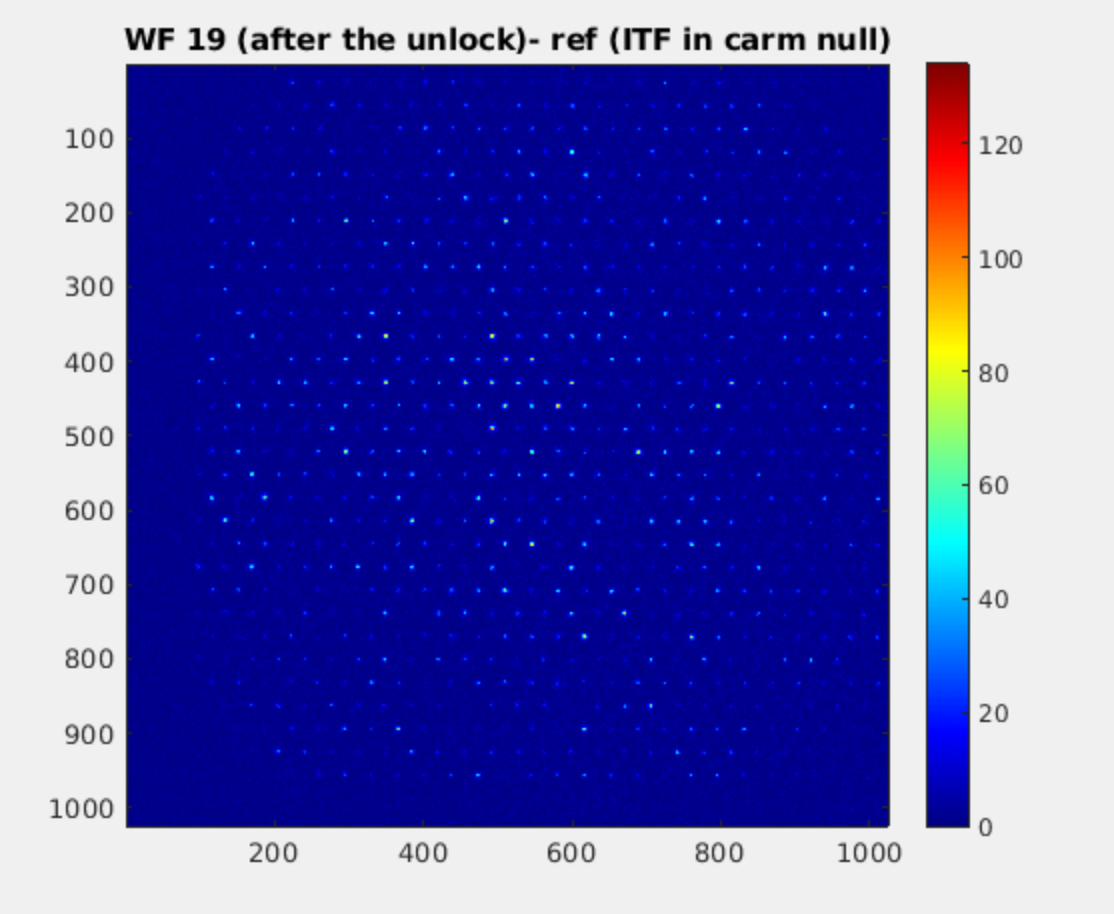
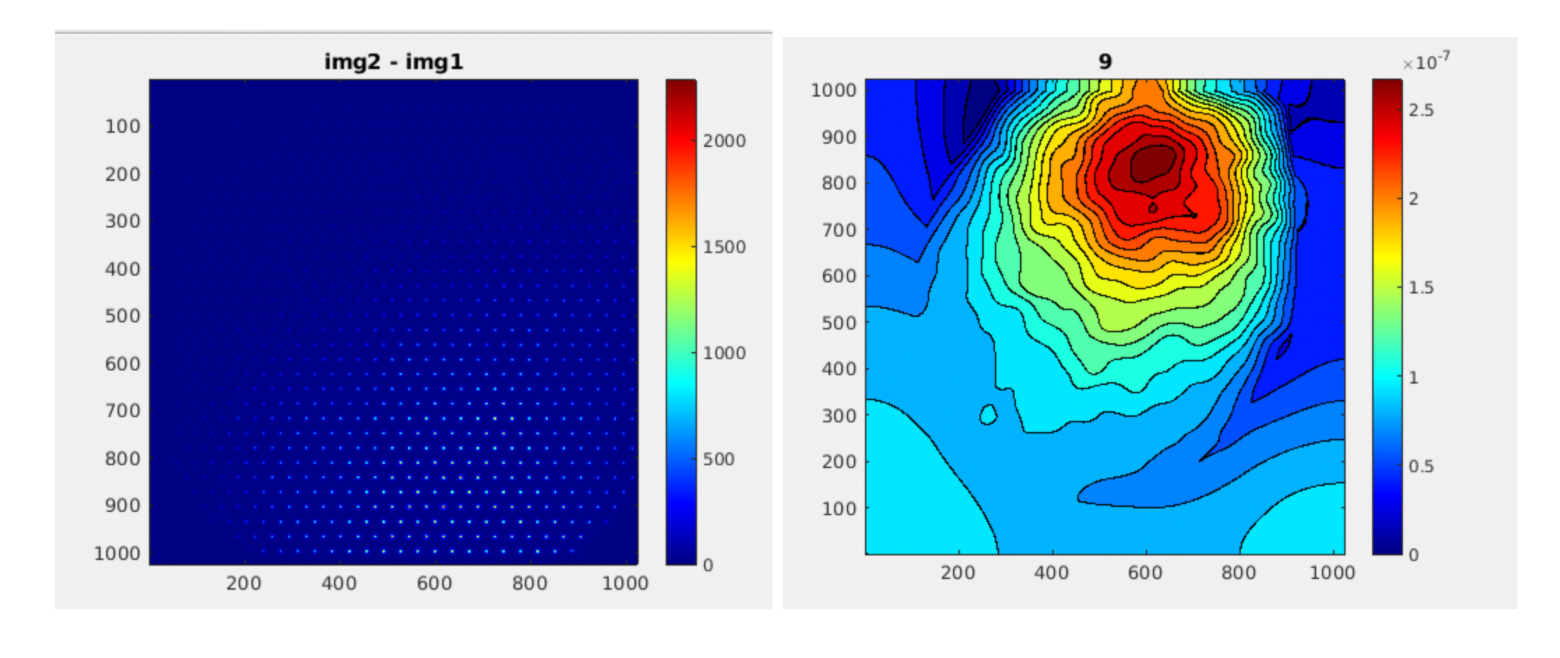
While waiting for the end of the PR CHRoCC transient, we decided to perform the first measurement on the NI. From the HWS-DET map, we noticed a non-uniform illumination pattern on the sensor with the ITF in CARM NULL 1F, so Suzanne and Andrea went to the EDB to adjust the steering mirror in front of the HWS. Figure 1 shows the illumination image before and after their intervention.

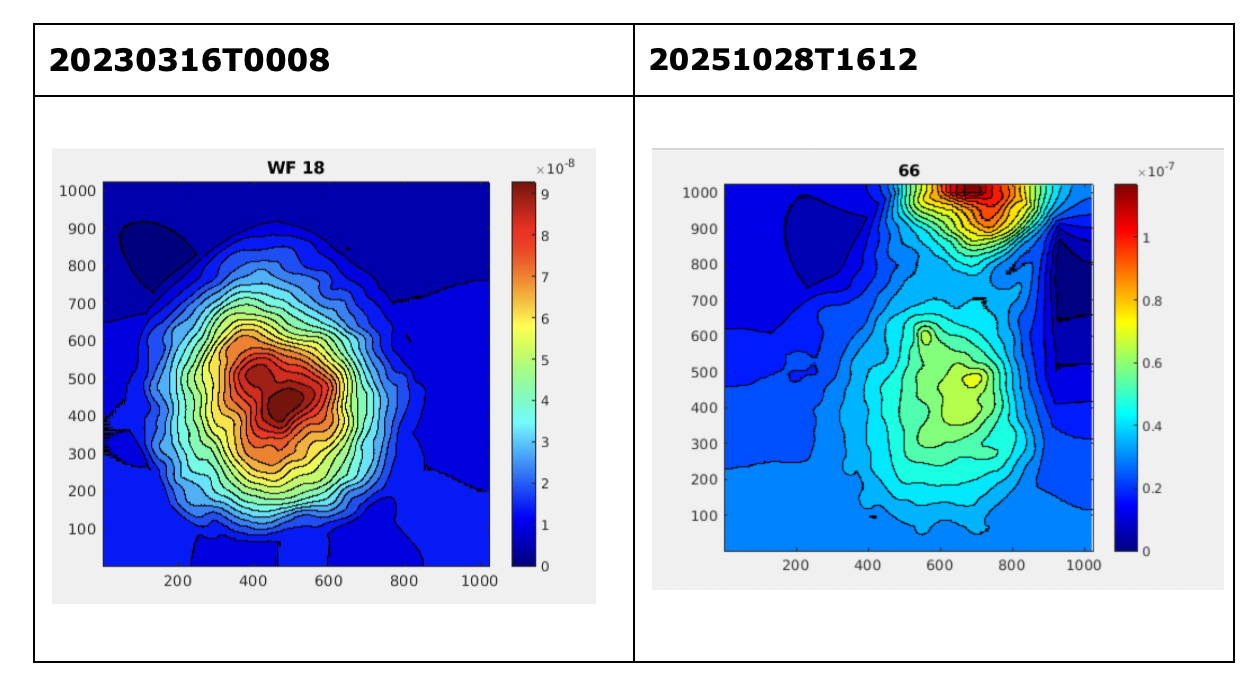
1) Acquisition started at 15:12 UTC, with the folder named 20251028T1612.

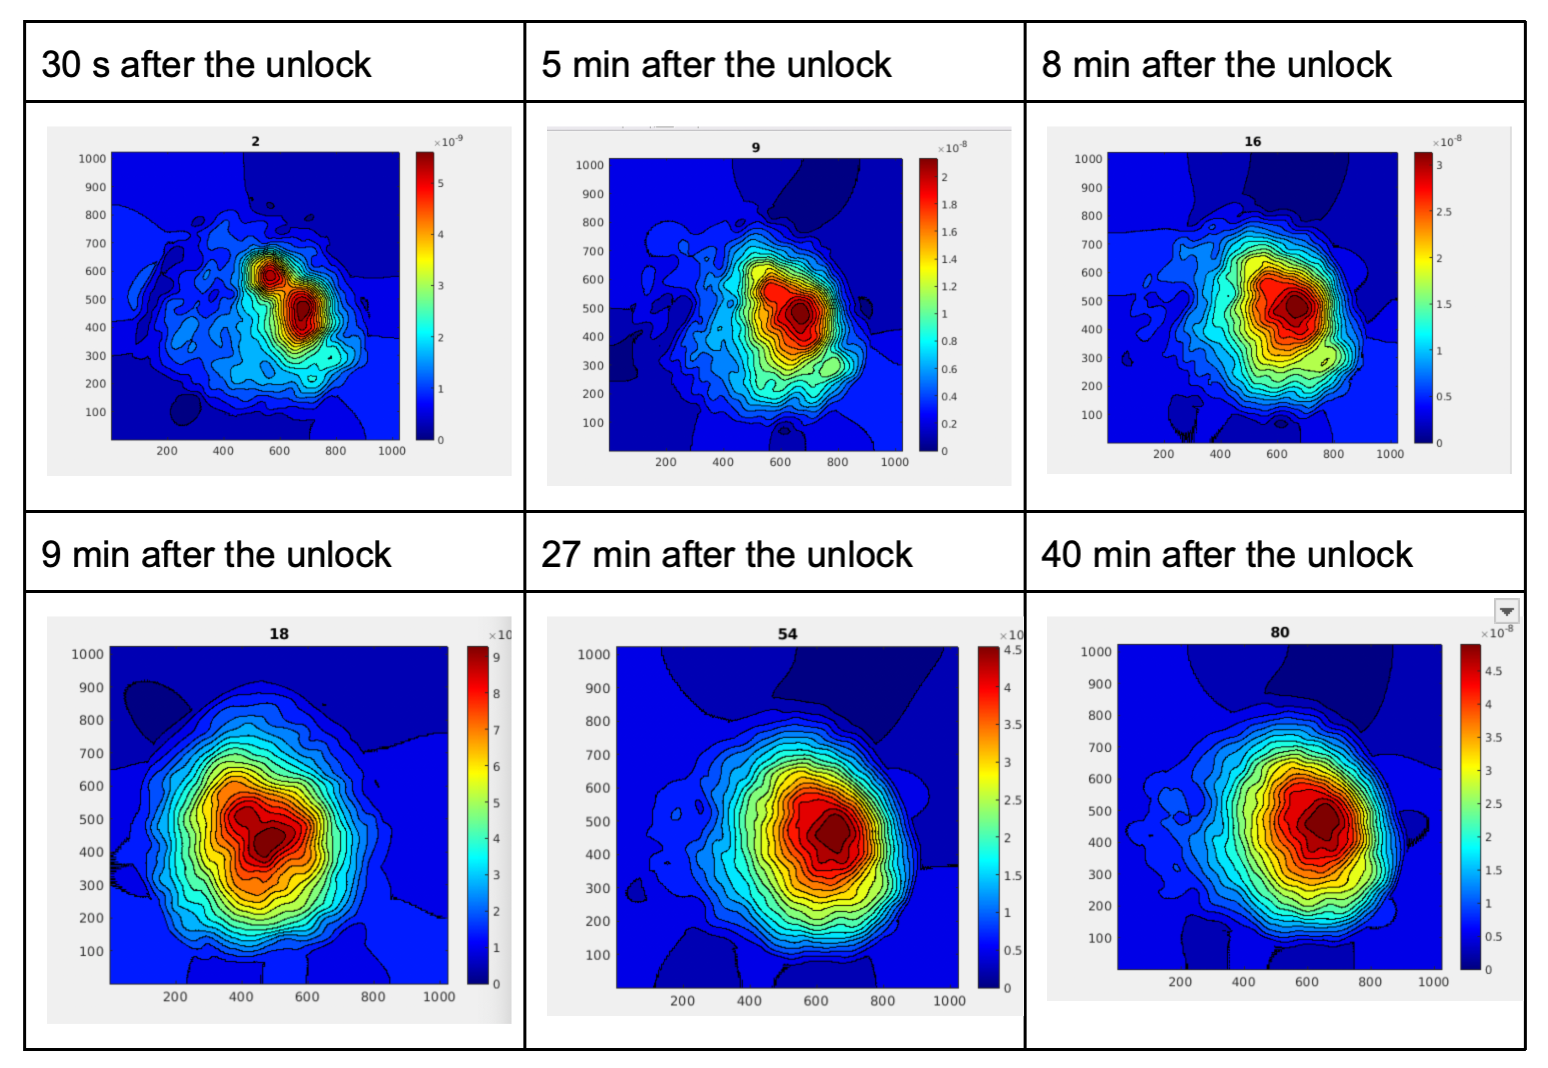
At 15:17 UTC, the ITF gently unlocked (WF 10). Immediately after the unlock, the NI was accidentally misaligned, but Diego realigned it promptly.

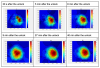
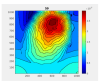
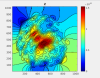
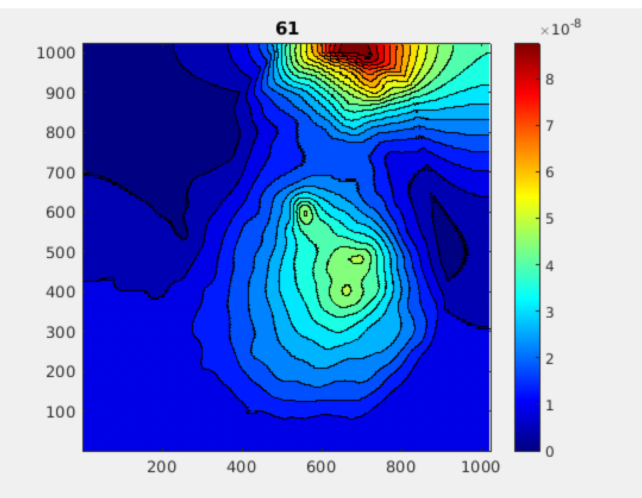
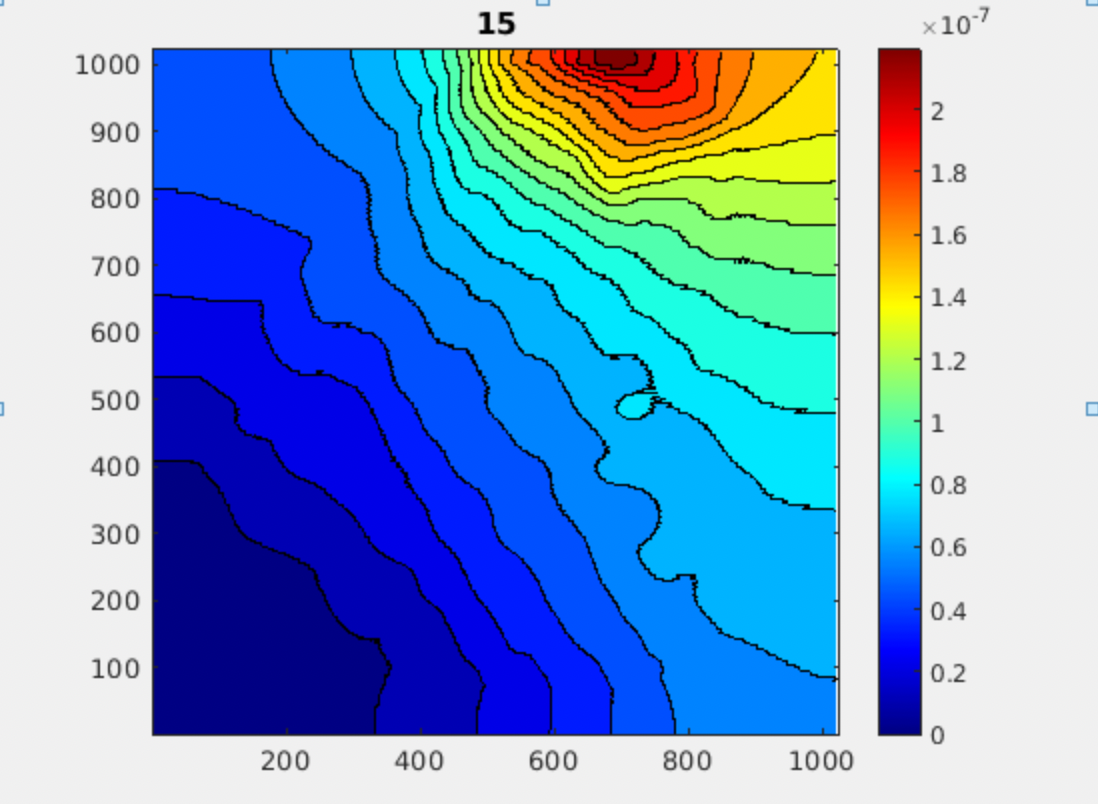
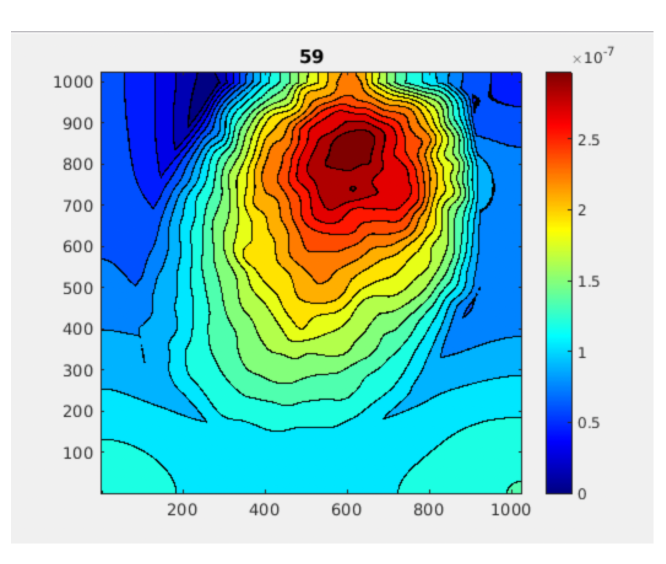
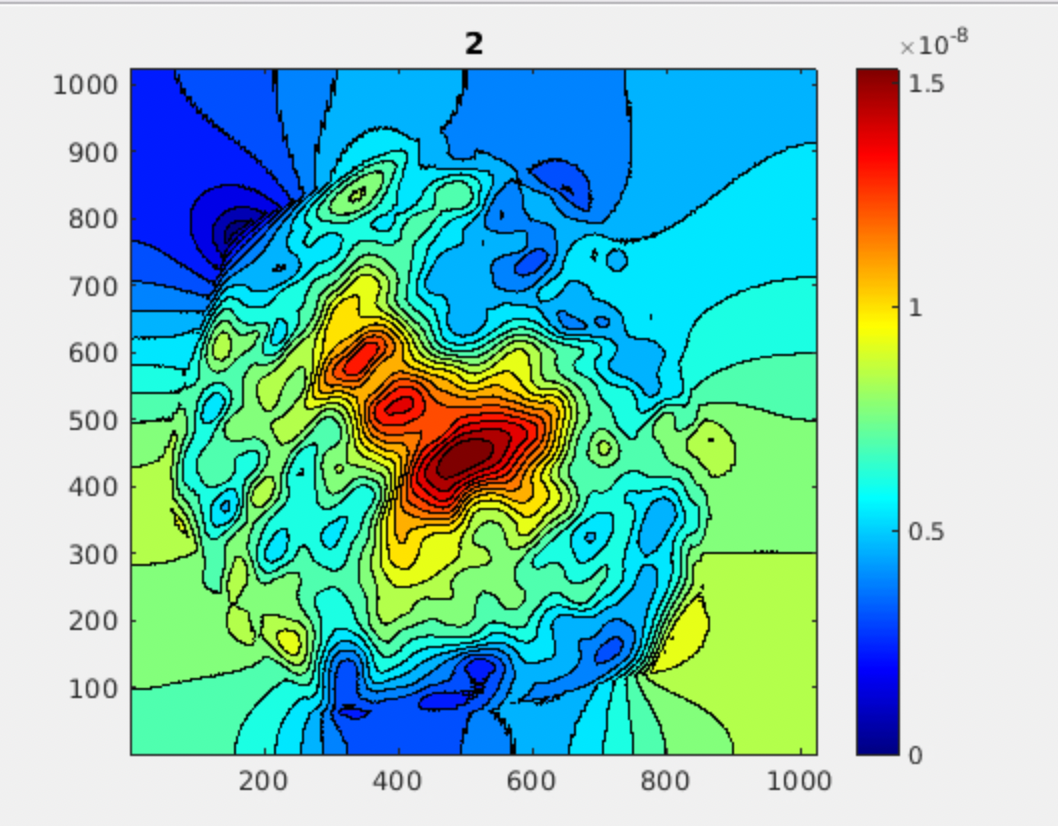
Starting from WF14 (about 2 minutes after the gentle unlock), a previously unseen structure appeared in the wavefront map.

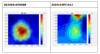
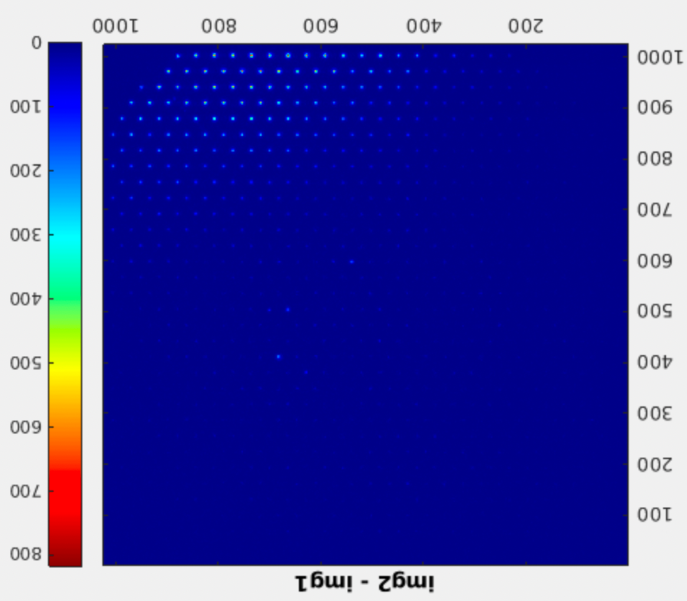
The picture below shows a comparison between the last measurement on the NI (left – 59448) and today’s measurement (right).

The measurement was interrupted at 16:11 UTC (WF 108).

To investigate whether the structure observed in the map could be an artifact, we checked that the SLED of HWS-INJ was OFF and all mirrors, except for the NI, were misaligned. Everything was Okay.

To confirm the results, we decided to repeat the measurement. The ITF was relocked at CARM NULL 1F at 16:27 UTC. 

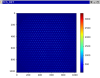
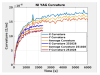
Before starting the measurement, I slightly increased the voltage applied to the SLED (from 1.05 V to 1.08 V) to raise the counts to approximately 3500 (see the third figure attached).

2) At 17.29 UTC, the HWS-DET acquisition started (20251028T1829). 

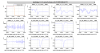
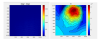
Acquisition stopped at 18:25 UTC (WF 103). The structure was still present (see Fig. 4).
At this point, Piernicola suggested that this structure could be due to a spurious beam from the new OMC installed on EDB.
We therefore contacted Romain to ask about the possibility of blocking the YAG beam near the viewports. 
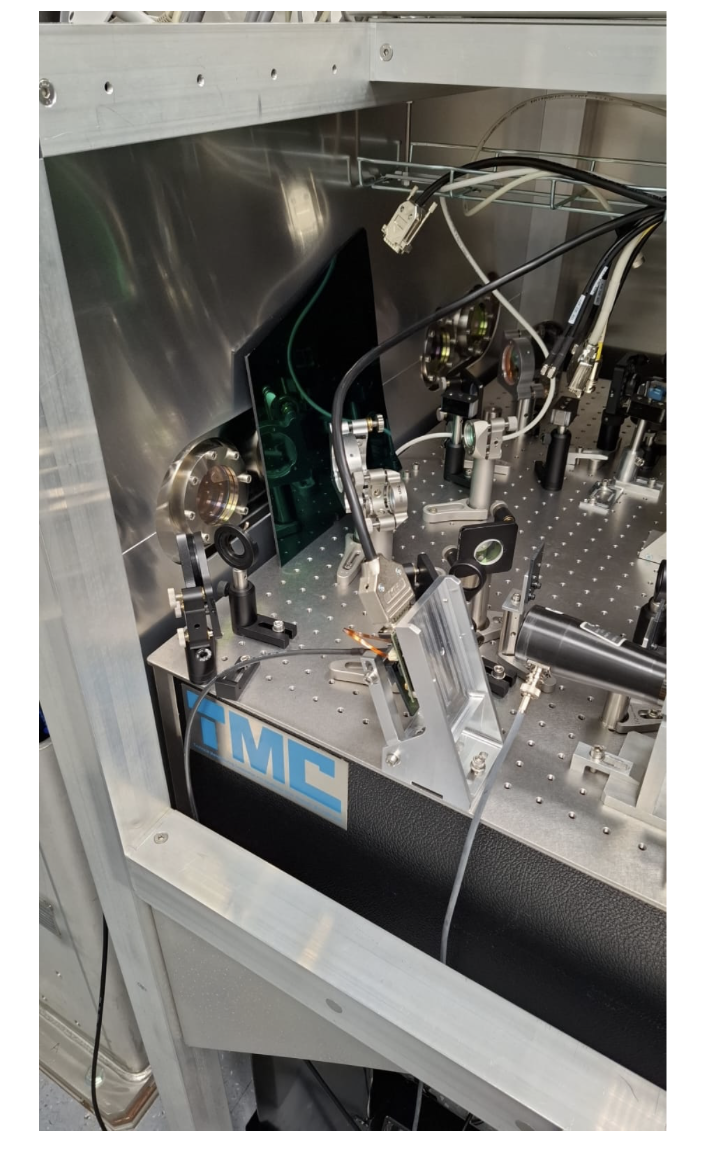
He gave us the green light, and Andrea, with remote support from Piernicola, went to DET to place an absorbing glass in front of the viewports (see Fig. 5).
3) So, after the ITF had been locked at CARM NULL 1F for one hour, we started the third acquisition at 20:04 UTC (20251028T2104).

The structure was still there. The measurement has been interrupted at 20.40 UTC (WF 67). At this point, Andrea returned to DET to remove the absorbing glass in front of the viewport and we restarted the lock acquisition at 21.00 UTC.
In conclusion, a new structure appears in the HWS-DET wavefronts approximately one minute after the gentle unlock. We repeated the measurements three times, and the results were consistent. Initially, we considered the possibility that it was caused by initial misalignment of the NI mirror. For the second measurement, we repeated the procedure, and for the third, we covered the viewports with absorbing glass to investigate whether the structure could be caused by a spurious beam from the new OMC. But even after blocking the viewports, the structure persisted in the maps.

Images attached to this report
Comments to this report:
nardecchia, rocchi - 11:29 Wednesday 29 October 2025 (68056) Print this report

With the purpose to shed some more light on the HWS measurement, we have analyzed the raw images before and after the appearance of the feature in the upper part of the wavefront.

Figure 1 shows the difference between the two raw images. As it can be seen, there is a significant modification of the illumination pattern on the HWS as soon as the ITF has unlocked. The change in the illumination pattern is responsible for the appearance of the feature.

This change in the illumination pattern can be explained with a displacement of the HWS probe beam (due to a misalignment of one of the optics or benches along the path) or with some spurious other beam (1064 nm or 532 nm) reaching the HWS plate. With the available data, it is not possible to discriminate between the two effects, even if a check of the LC signals (figure 2) seems to exclude the displacement of the probe beam.

Images attached to this comment
bersanetti, magazzu, nardecchia - 16:27 Wednesday 29 October 2025 (68058) Print this report

To investigate the hypothesis that the structure in the upper part of the HWS map is caused by the green beam, Diego modified the automation configuration to keep it OFF after the unlock. We then performed a new measurement with HWS-DET. For this purpose, I switched OFF the HWS-INJ SLED and switched ON the HWS-DET SLED.

The ITF was locked at CARM NULL 1F at 11:04 UTC. Acquisition started at 14:28 UTC (folder 20251029T1528), and the ITF gently unlocked at 14:36 UTC (WF14).

The structure was also present in the maps (see figure).
The measurement was interrupted, and the lock acquisition was restarted.

Images attached to this comment
rocchi - 11:19 Thursday 30 October 2025 (68062) Print this report

The issue with the HWS intensity changing during the gentle unlock is a long standing story, I found several entries reporting it and discussing the solution (60377, 60362, 60344, 59433, 59434, 59347).

In one of them (59433), the issue seems to be traced back to the ETMs misalignment during the unlock (but keeping them aligned seems worse).

In any case, the only solution seems to be the re-processing of the data. 

nardecchia - 18:11 Thursday 30 October 2025 (68068) Print this report

In the meantime, we performed some additional data analysis to further investigate the observed effects. The following results summarize the outcomes and comparisons made with previous datasets:

  • First, I verified that a beam shift occurs only on HWS-DET during the unlock, and not on HWS-INJ.
    By taking the difference between the CCD illumination patterns before and after the unlock of the last measurement 20251029T1009, no misalignment or spurious beam was observed (see Fig. 1). 

  • I reprocessed the HWS-DET data from acquisition (2) – 20251028T1829, reported in entry 68051, as suggested by Alessio.
    The reprocessing took WF21, the first wavefront acquired after the unlock, as the reference.  Some WFs acquired after the unlock are shown in Fig. 2.
    Then, I extracted the curvature and compared it with the one obtained from the last measurement performed with DET (20230316T0008).
    The two results are consistent with each other, as shown in Fig. 3. The current curvature is slightly lower, possibly due to a slightly lower input and/or circulating power in the arm, or because some curvature is lost as the YAG beam effect is at the right edge of the map (i.e. the SLED beam is decentered on the NI mirror).
  • I revisited the last absorption measurement performed with HWS-DET (20230316T0008), which had been reprocessed afterwards.
    Before reprocessing, considering for example the WF9, corresponding to approximately 30 s after the unlock, it appeared as shown on the right side of Fig. 4. On the left side of the same figure, the difference between the illumination profile of the reference acquired before the unlock and that acquired after the unlock is shown. Thus, comparing this difference map with the one reported in the entry  68056,  in 2023 the problem of beam displacement was more evident. Without reprocessing the wavefronts, the YAG never appears in the map (see an example is WF59- Fig. 5).
    By reprocessing the images with respect to WF8, the YAG effect becomes visible in WF9, as shown in Fig. 6, evolving over time in a manner similar to that observed in the most recent dataset.

Images attached to this comment
Search Help
×

Warning

Error

The present report has been modified outside this window. Please check for its integrity in the main page.

Refreshing this page will move this report into drafts.

×