Reports 1-1 of 1 Clear search Modify search
Environmental Monitoring (Environmental Monitoring)
Paoletti, Soldani, Fiori, Tringali - 13:38 Tuesday 07 October 2025 (67876) Print this report
Speed-up test of HVAC INJ machine

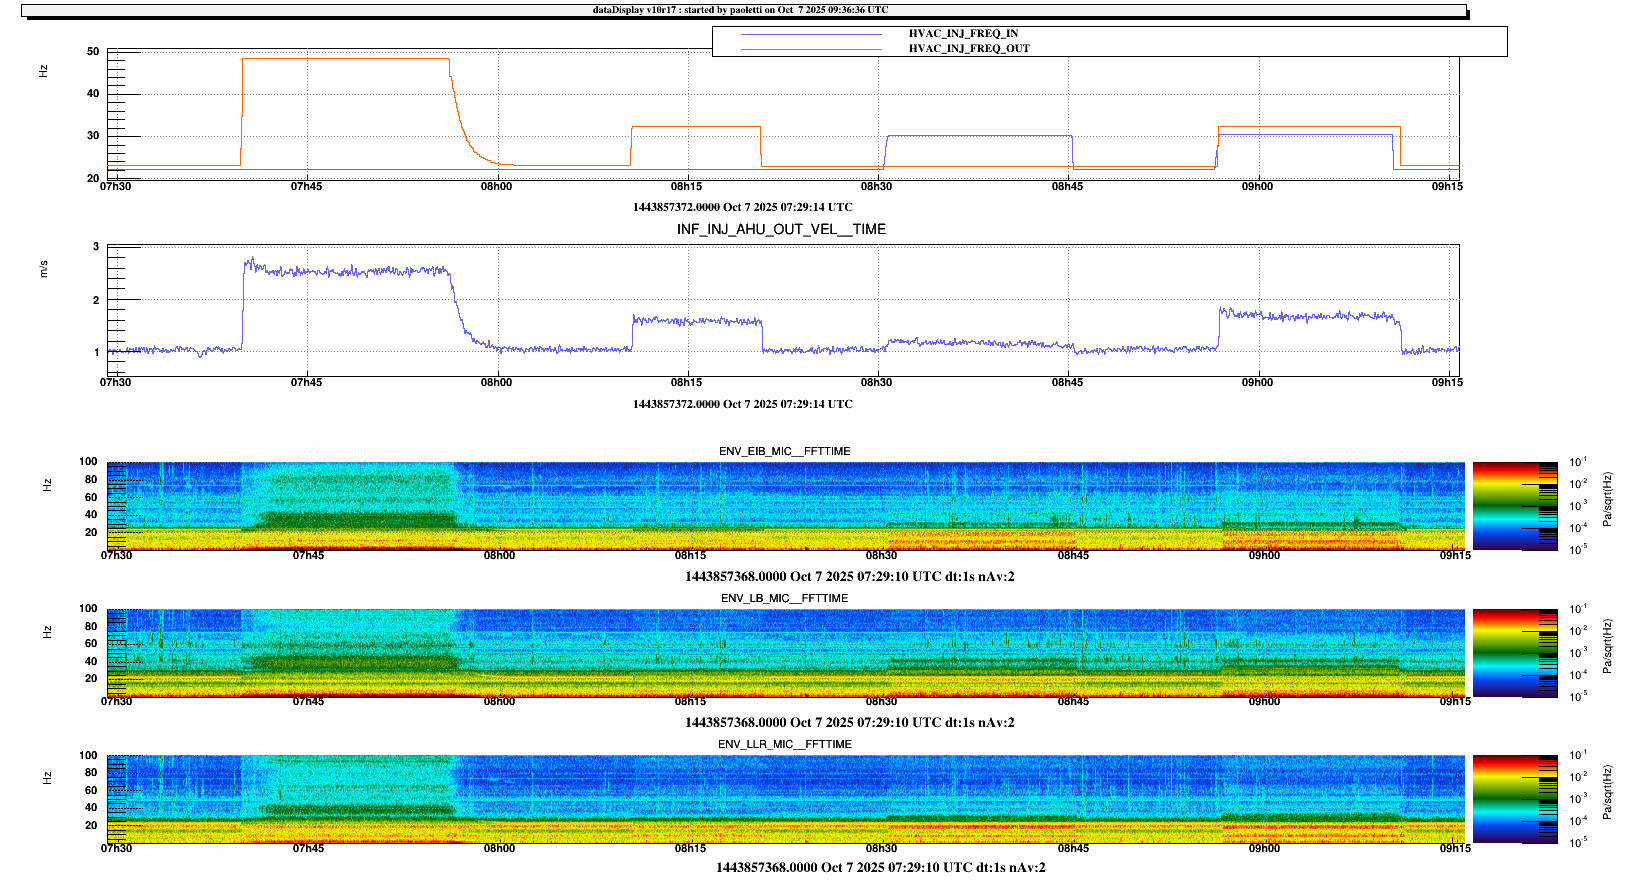
Today we tested some settings of the INJ HVAC system, in order to evaluate the noise increase inside the INJ lab.

This is the timetable (UTC) of the operations:

  • 07:39:40 Set to "person present in lab" mode (leave all systems in automatic mode)
  • 07:56:00 Switch back to "no one in lab" mode – 15 min
  • 08:10:30 Keep extraction (return air) flow rate constant + increase supply air fan to 33 Hz
  • 08:20:30 Keep extraction flow rate constant + return supply air fan to baseline value (~23 Hz)
  • 08:30:20 Keep supply air flow rate constant + increase extraction fan to 30 Hz
  • 08:45:20 Keep supply air flow rate constant + return extraction fan to baseline value (~20 Hz)
  • 08:56:30 Increase both supply and extraction fan frequencies simultaneously by 10 Hz
  • 09:10:30 Restore all parameters to initial conditions – end of test

A detailed analysis will follow.

It is worth noting that some acoustic noise was detected inside the INJ lab by the microphones. This could be a consequence of the maintenance operations carried out on the platform inside the CEB.

Also note that during the automatic setting at 07:39:40 UTC, only the supply fan was adjusted by the system.
Images attached to this report
Comments to this report:
Paoletti - 14:26 Wednesday 08 October 2025 (67885) Print this report

Below are the useful time windows for analysis (all times in UTC on October 7th), selected to avoid, as much as possible, noise from maintenance activities:

  • Quiet:  02:00:00 + 600s

  • Step 1: 07:49:00 + 300s

  • Step 3: 08:18:00 + 120s

  • Step 5: 08:30:45 + 120s

  • Step 7: 09:04:05 + 120s


Fiori, Passaquieti, Tringali, Soldani - 16:06 Tuesday 04 November 2025 (68091) Print this report

This morning, we performed a test to evaluate the impact of the air duct valves' operation on the noise in the Laser Laboratory.
The valves under study control the supply and return air flux in the vicinity of the optical bench area.
The valve openings were actuated via the Kieback & Peter control interface, Figure 1 and 2.
A value of 0% corresponds to a fully closed valve, while 100% corresponds to a fully open valve.
The opening of these two valves is set to 100% for the supply line and 0% for the return line in SCIENCE mode operation.
During the whole test, the fan frequency for the supply air unit was kept fixed at 23.0 Hz, and that of the return air unit at 20.4 Hz, respectively.
Below is the list of actions performed during the test (see Figure 3):

Time (UTC) Supply valve opening (%) Return valve opening (%) Note
09:53  70 % 0%  
10:07  50% 0% VAC pump in SIB2 room switched-off at 10:08 UTC
10:14 10% 0%  
10:22 100% 0%  
10:23 100% 90%  
10:28 100% 0%  
10:34 100% 50%  
10:53 100% 10% restarted at 10:50 UTC of the Bacnet server to recover HVAC_INJ* sensors 
11:00 100% 0%  
11:04 5% 0%  
11:10 100% 0% SCIENCE mode operation


It is worth noting that during the test, a replacement of the split units was ongoing in the Injection electronic room (Piscina) and human activity was present in the Central Building.

Images attached to this comment
Tringali, Berni, Fiori, Passaquieti, Soldani - 17:57 Tuesday 11 November 2025 (68137) Print this report

This morning, taking advantage of Matthieu and Piernicola’s presence in the Laser Laboratory, we checked the valve opening values in the ACCESS (people inside) and SCIENCE (no people inside) operating modes.
In Figure 1 is reported the behaviour of some parameters: supply (OUT) and return (IN) frequency, flux, pressure....  Below are some observations:

  • when switching between the two AHU operating modes (SCIENCE and ACCESS), the supply fan frequency is manually adjusted via the Kieback & Peter control interface (acting on the inverter), while the return fan speed automatically readjusts accordingly;
  • although the operating mode was set back to SCIENCE, the frequency values of supply (*FREQ_OUT*) and return (*FREQ_IN*) did not exactly match the initial ones, Figure 2;
  • while the supply fan values appear to correspond well with the inverter display readings, the return fan shows a difference of approximately 2 Hz between the inverter display and the trend in the plot;
  • the inverter values for the supply and return fans, as configured via the Kieback & Peter control interface, do not correspond to the values shown on the inverter displays;
  • the supply and return valve openings in the different areas of the Laser Laboratory are always manually set to fixed values, as reported in the table below, for both AHU operating modes.
Area Supply valve opening (%) Return valve opening (%)
SAS 0 0
Atrium 0 6
Benches 100 0
Mini-tower 10 0

A value of 0% corresponds to a fully closed valve, while 100% corresponds to a fully open valve.

The attached drawings show the distribution of the supply (blue) and return (red) air ducts. The position of the valves along the ducts and in the different areas is indicated by the label RP (regolatore di portata, flow regulator).

Images attached to this comment
Non-image files attached to this comment
Search Help
×

Warning

Error

The present report has been modified outside this window. Please check for its integrity in the main page.

Refreshing this page will move this report into drafts.

×
