Summary:
1) DARM lines show up in HOMs power spectra in transmission of EDB OMC
2) the estimated HOM-DARM coupling is at the level of a few percent
3) the estimated coupling with DARM is highest for TEM03; it decrease with HOM order but has a peak on orders 8÷9
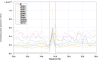
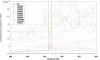
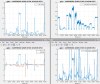
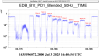
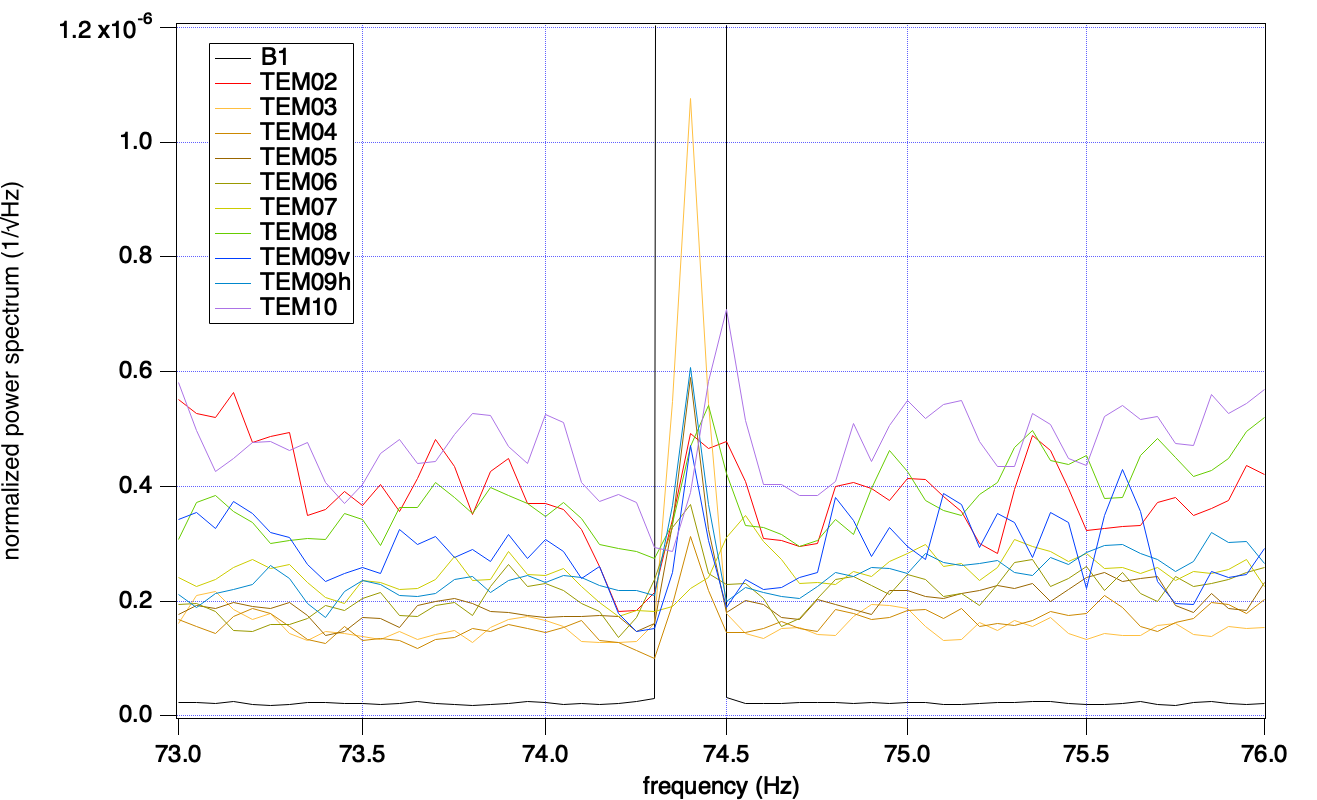
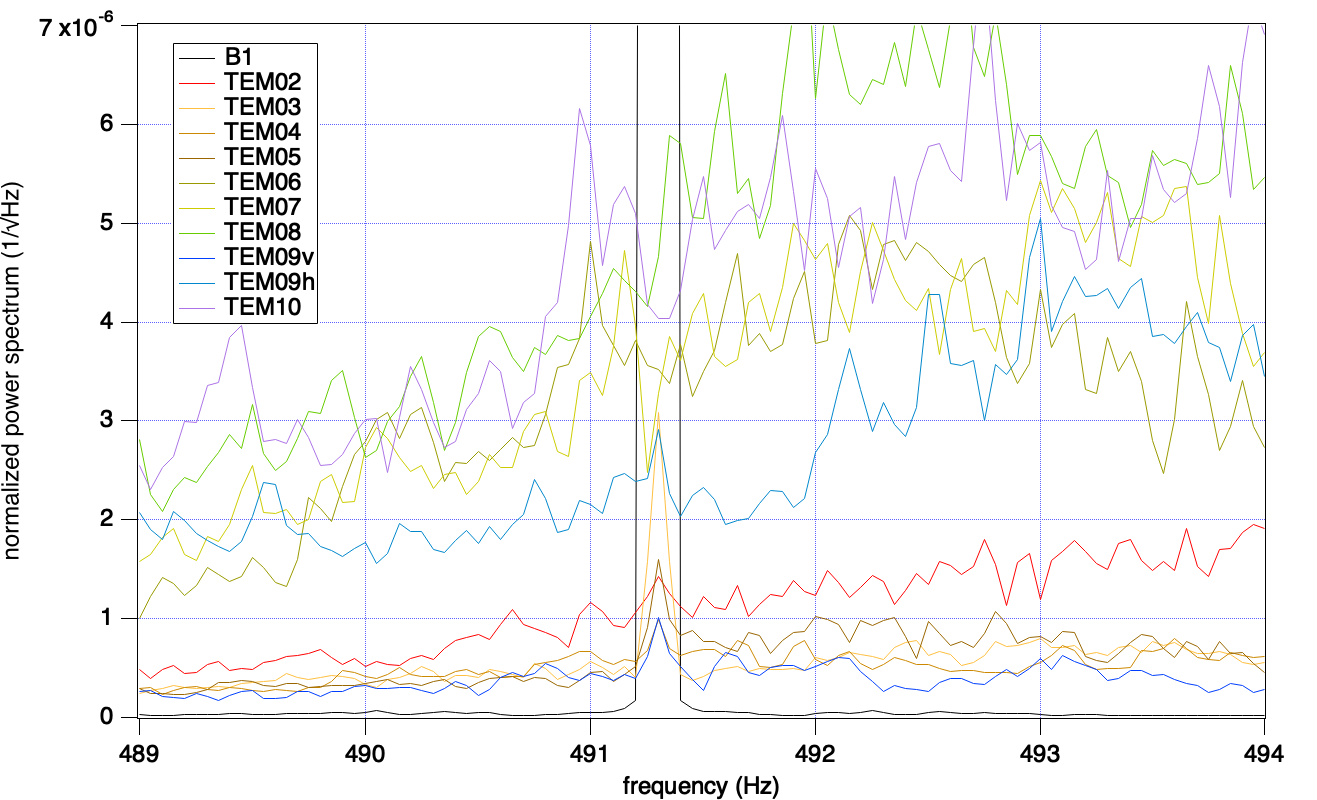
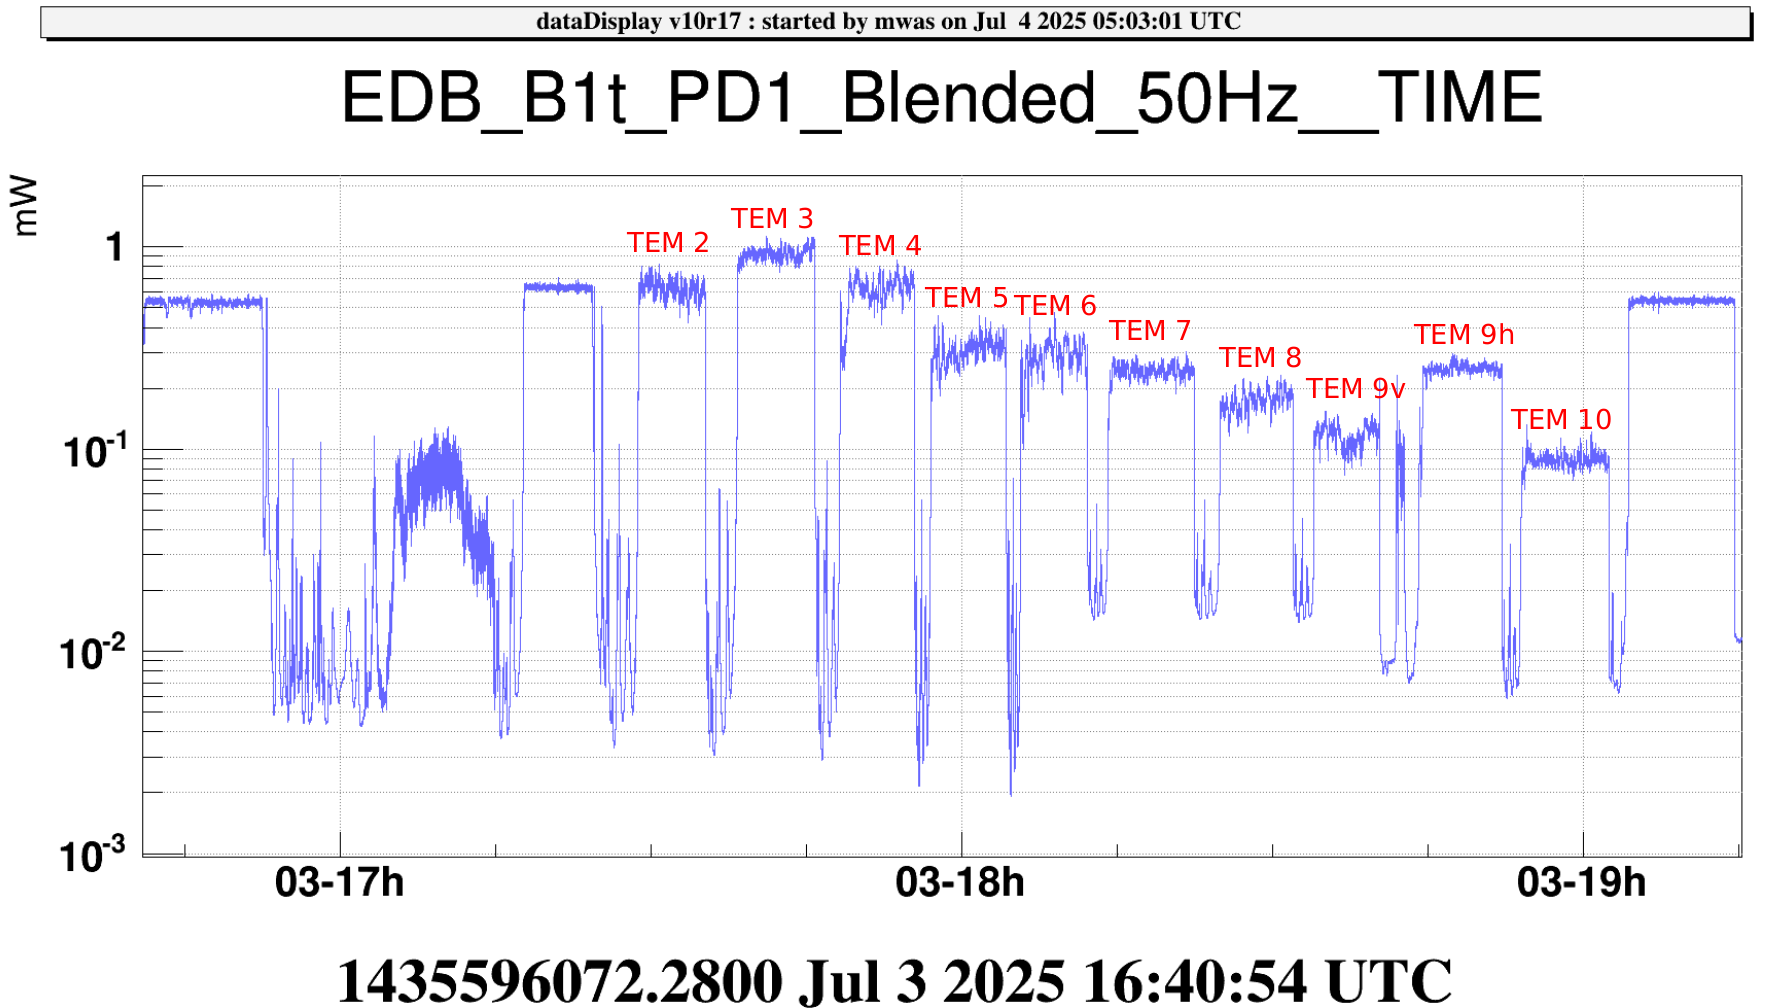
Locking the EDB auxiliary OMC on high order modes allows to search for possible couplings between high order modes and the DARM TEM00 mode on the dark fringe beam. Looking at data from Jul 3 one can see that the strongest DARM lines at 74 Hz and 491 Hz are visible in some of the spectra of the EDB OMC transmission when the OMC is locked on HOMs. The first two attached pictures show the RIN spectra of the OMC transmission - i.e. EDB_B1t_PD1_blended normalised to the mean DC value (EDB_B1t_PD1_DC, see last plot) for the various HOMs, zoomed around the two main DARM lines at ~74 Hz and ~491 Hz. RIN spectra are in linear vertical scale, have 50 mHz resolution, and are averaged over about 5 minutes each. The B1 RIN spectrum is also shown in black. The set includes a spectrum for each HOM up to order 10; there are two measurements for order 9 HOMs, with horizontal (TEM81) and vertical (TEM09) shape.
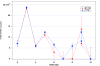
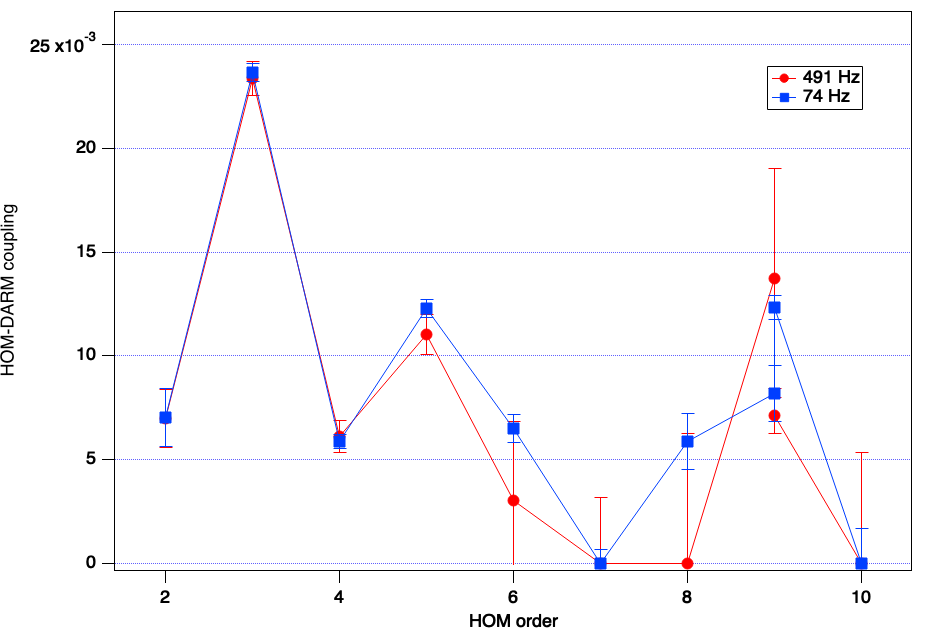
The DARM lines are visible in many of the HOM RIN spectra, but the SNR is better at 74 Hz than at 491 Hz. An estimate of the coupling between HOMs and TEM00 can be obtained by the ratio of line amplitude in HOMs and DARM spectra. The third plot shows the result, where for each HOMs the line amplitiude is computed after quadratic subtraction of the mean background noise around the line frequency, and error bars are the standar deviation of RIN spectra in the frequency regions shown in the plots (with the lines excluded). From the plot one can deduce that:
- HOMs to DARM coupling is at the level of a few percent
- the coupling is substantially higher (~2.5%) for order 3 mode than for any other mode. In particular, for the lowest even modes (order 2 and 4) the coupling is ~5 times smaller than for order 3.
- the coupling is sensibly high (~1%) for order 9, and is not negligible for order 8. This is probably not a big surprise, as the orders 8 and 9 are known to be close to the arm cavity resonances.
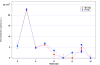
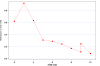
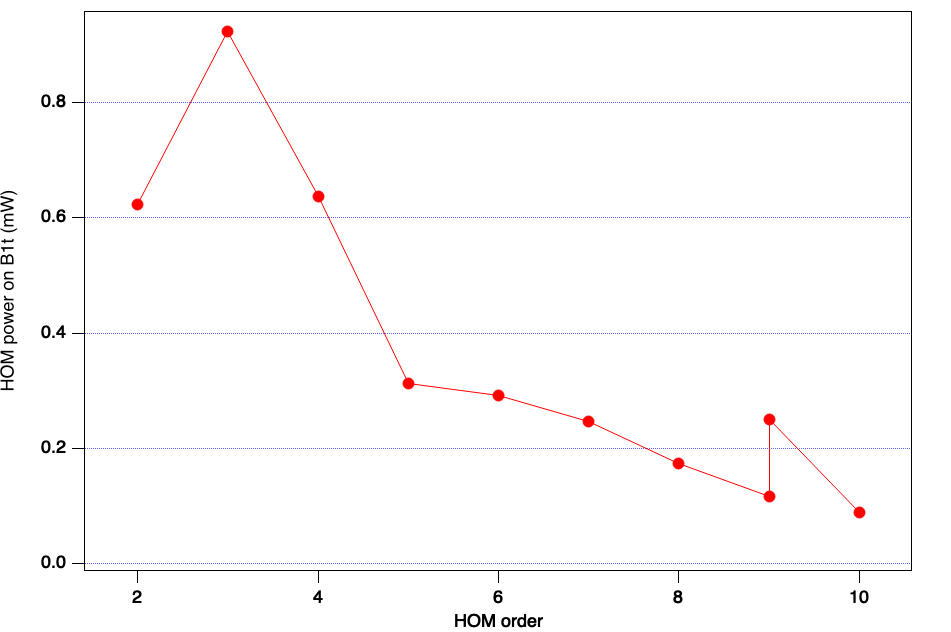
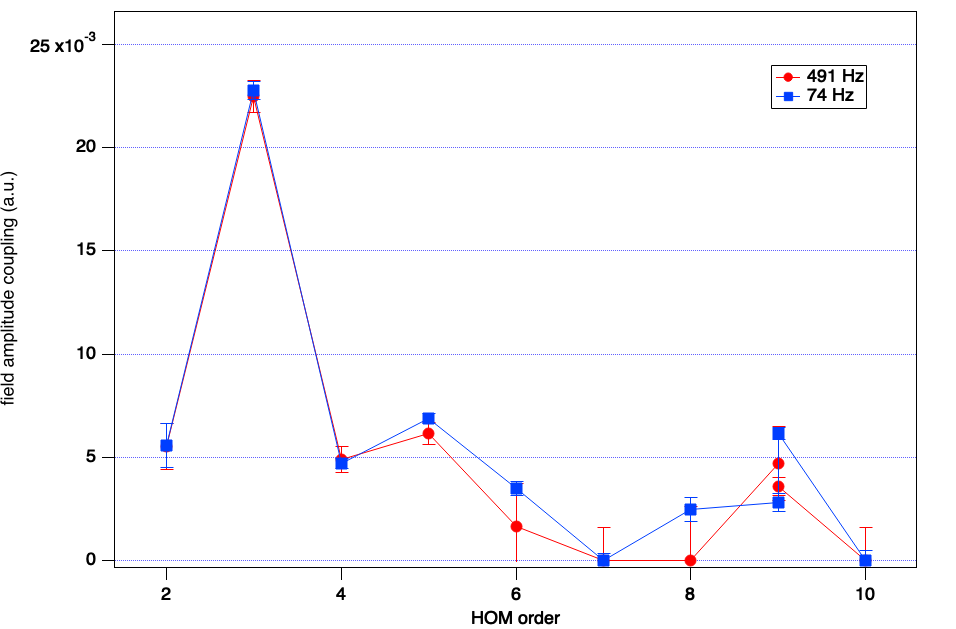
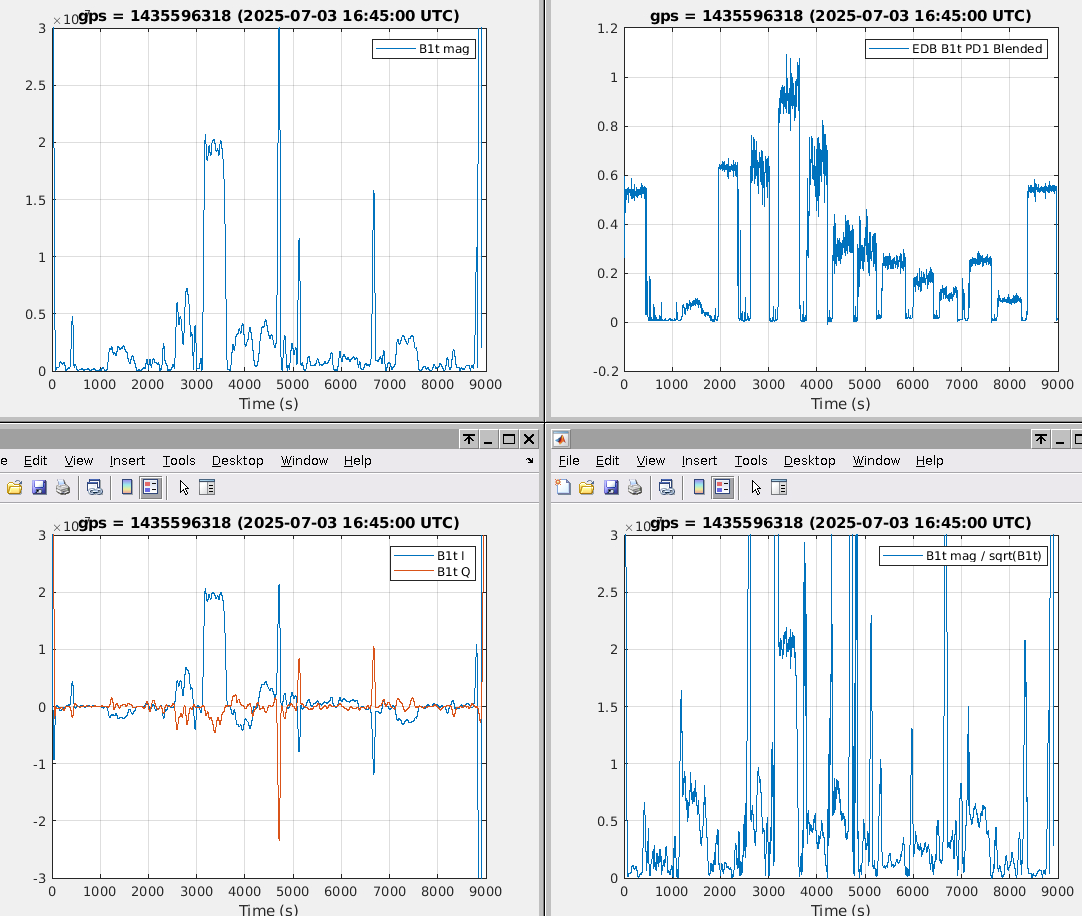
If the measured coupling is responsible for the mystery 1/f^2/3 noise, one would expect the contribution of each HOM to be proportional to the product of the coupling factor and the field amplitude (i.e. the sqrt of the optical power in that mode). The 4th plot shows the relative field amplitude expected contribution, i.e. the HOM-DARM coupling (from 3rd plot) times the sqrt of the HOMs power (from 5th plot). The expected contribution of TEM03 is clearly dominant.
It would be good to repeat such mesurements, in particular if the newly installed B1t photodiode provides better SNR, to possibly confirm the conclusions. Analysing the same data set with a demodulation of HOMs spectra with the DARM lines might also improve the quality.