Reports 1-1 of 1 Clear search Modify search
Detector Characterisation (Glitches)
direnzo, longo - 23:30 Wednesday 17 September 2025 (67733) Print this report
Scattered Light Correlation Study During High Microseismof Sept 10–11

Following Michal’s input, I repeated the standard correlation study for Scattered Light (#64022, #64041) during the period of elevated microseismic noise (sea activity) between September 10-11, in order to identify the dominant residual source after the intervention on the West End baffle.

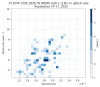
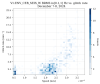
As a first step, I compared the glitch rate (frequency < 50 Hz, SNR > 5, noting that this rough cut also includes other types of glitches) with the BRMS between 0.1 and 1 Hz from ENV_CEB_SEIS_W, both in this recent period and during another high microseism episode, December 7-8, 2024. The current rate remains below ~8 glitches/min even with seismic velocity above 3 µm/s. In contrast, last December the rate was nearly double for comparable microseism levels. Refer to Figures 1 and 2.

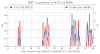
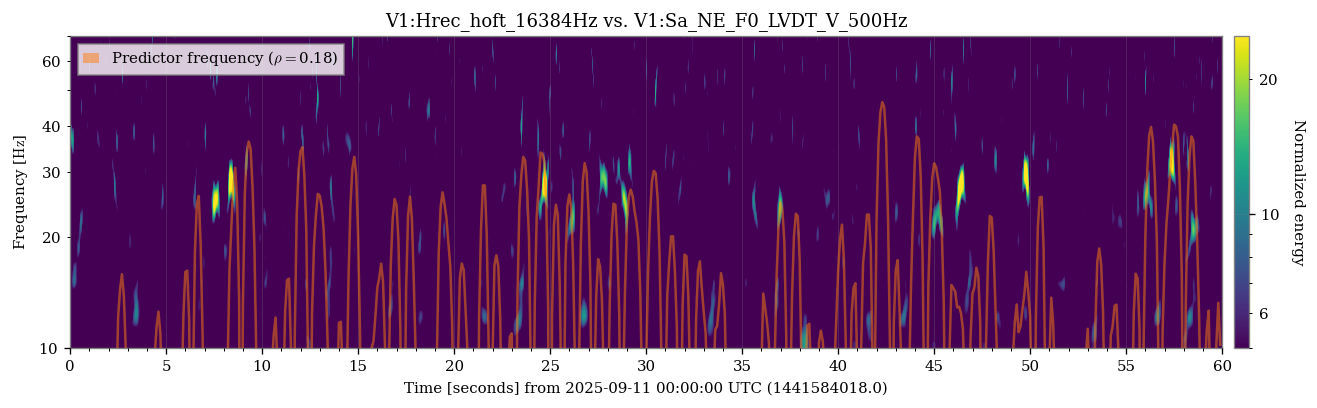
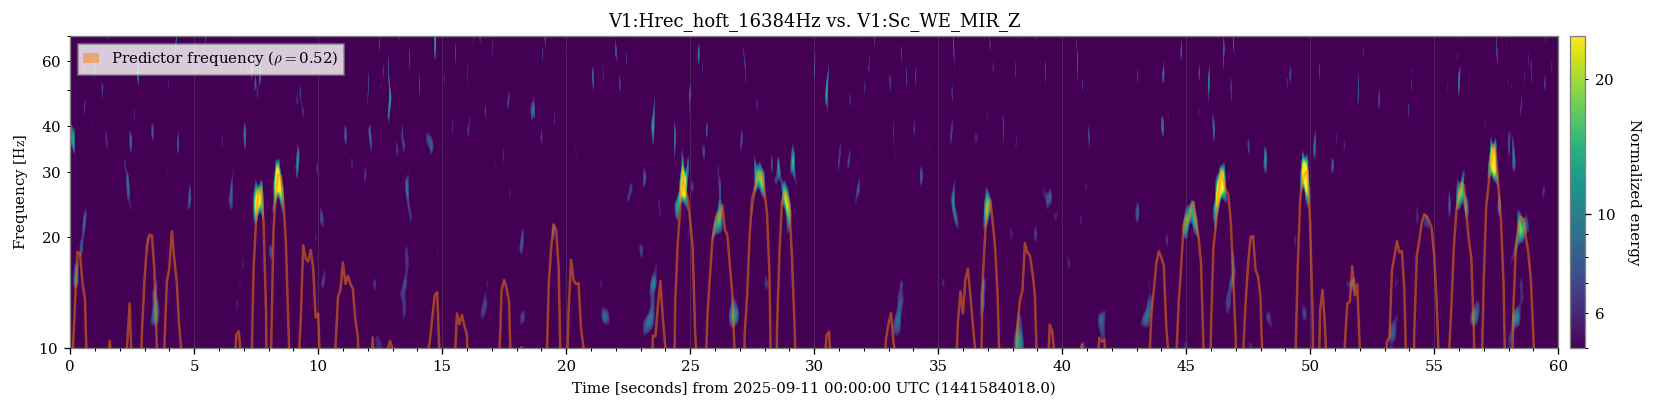
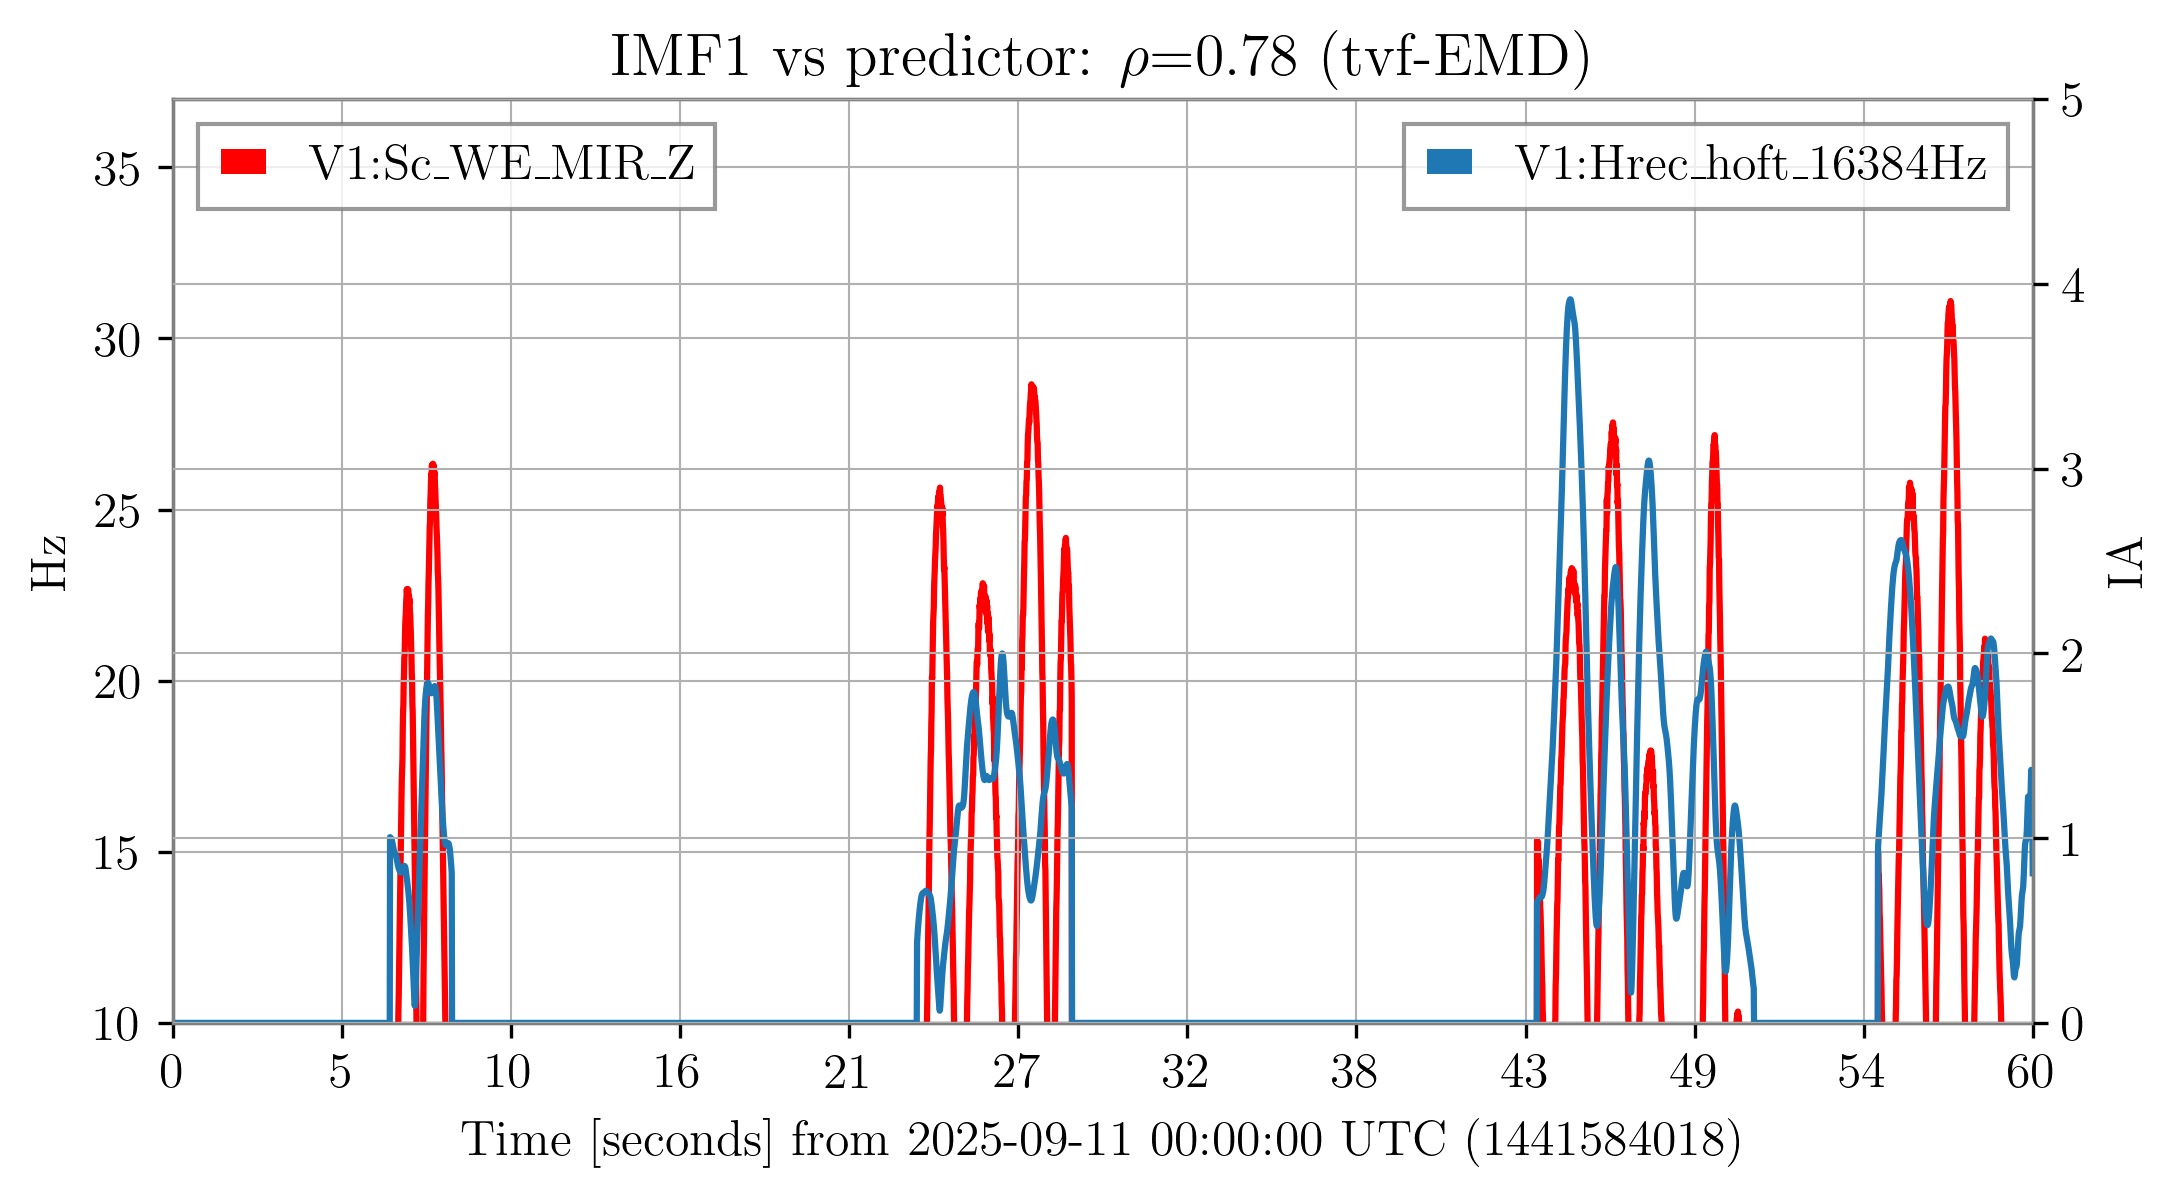
I then repeated the usual analysis to search for correlations. The attached list shows the most correlated channels, along with plots of some representative cases. All channels with correlation > 0.2 are associated with the West End, F0, and F7, as in the past. A weaker correlation was also identified with some North End channels, such as Sa_NE_F0_LVDT_V, though visual inspection suggests no clear similarity between this channel’s velocity and the glitch frequency (see Fig. 5).

Time permitting, the analysis could be extended to other periods of strong sea activity. For now, however, the data support a reduction in scattered light glitch rate while confirming the West End as the primary source.

Images attached to this report
Non-image files attached to this report
Comments to this report:
longo - 9:47 Tuesday 07 October 2025 (67874) Print this report
I think is useful to give details regarding the methodology for scattered light noise hunting that is currently being used, so that if anyone is interested in reproducing results using the gwas pipeline it can refer to this comment.

The gwas pipeline makes use of adaptive decomposition (pytvfemd) to decompose a target time series (in this case, h(t)) affected by glitches, into oscillatory modes referred to as intrinsic mode functions (IMFs). The envelope of such IMFs, the instantaneous amplitude IA, is known to be well correlated to the predictor of the noise source (in this particular case, Sc_WE_MIR_Z). I attach results (glitch.png) obtained using the gwas pipeline, you should be able to reproduce results from this entry by running (minigwas is for single time intervals, gwas is for daily analysis using Condor):

./minigwas --gps 1441584048 --target V1:Hrec_hoft_16384Hz --seconds 60 --fs 100 --channels /users/longo/Desktop/single/sc_we_mir_z.txt --opath /users/longo/Desktop/ --thr -1 --imfs 1,2 --combos 1 --fl 25 --bwr 0.1 --bsp 26

where the .txt file contains the channel name V1:Sc_WE_MIR_Z (it can contain a long list of channels if you wanna do a "brute force search").

If I didn't make mistakes, having obtained the folder with the output of minigwas, running the glitch.py script I'm attaching you should be able to replicate the figure I'm posting. The pipeline is available on pypi, so you should be able to install it (feel free to email me if needed) by doing:

pip install gwas_tools (https://pypi.org/project/gwas-tools/)
git clone https://git.ligo.org/stefano.bianchi/gwpipelines

and editing gwas and minigwas, setting the right environments. To use gwas, you should also install pytvfemd (https://pypi.org/project/pytvfemd/) which is the Python version of tvf-EMD, developed by Stefano Bianchi.

As the glitch considered here was not persisting over the whole 60s interval considered, I selected relevant times of interest by hand after running the pipeline. This way, a higher correlation can be obtained using tvf-EMD (0.78).

Two nice features to add to minigwas could be:
1) the possibility to pass a channel name directly as input, without having to write a .txt file
2) the possibility to refine the analysis, focusing on smaller time intervals, while still allowing to run one single scan on a longer stretch of data (what I did by hand in this case). This, if glitches are separated in time, I think could increase obtained correlation.

If you're interested in the method you can see these papers:
Guillermo Valdes et al 2017 Class. Quantum Grav. 34 235009 https://doi.org/10.1088/1361-6382/aa8e6b
Alessandro Longo et al 2020 Class. Quantum Grav. 37 145011 https://doi.org/10.1088/1361-6382/ab9719
Alessandro Longo et al 2022 Class. Quantum Grav. 39 035001 https://doi.org/10.1088/1361-6382/ac4117
Stefano Bianchi et al 2022 Class. Quantum Grav. 39 195005 https://doi.org/10.1088/1361-6382/ac88b0
Alessandro Longo et al 2024 Class. Quantum Grav. 41 015004 https://doi.org/10.1088/1361-6382/ad0db0
Alessandro Longo et al J. Appl. Phys. 138, 090701 (2025) https://doi.org/10.1063/5.0273058
Images attached to this comment
Non-image files attached to this comment
Search Help
×

Warning

Error

The present report has been modified outside this window. Please check for its integrity in the main page.

Refreshing this page will move this report into drafts.

×