An attempt to produce another polynomial reconstruction of the sensitivity has been done. The first problem to face is the presence of many glitches, reducing the length of the available good segments of data. We used a trick which seems acceptable: from a long period of continuous lock in the same condition, a list of segments has been selected, putting a threshold on BNS range and considering only the segments long enough. On those data, an amplitude spectral density has been computed, making the average of the averages.
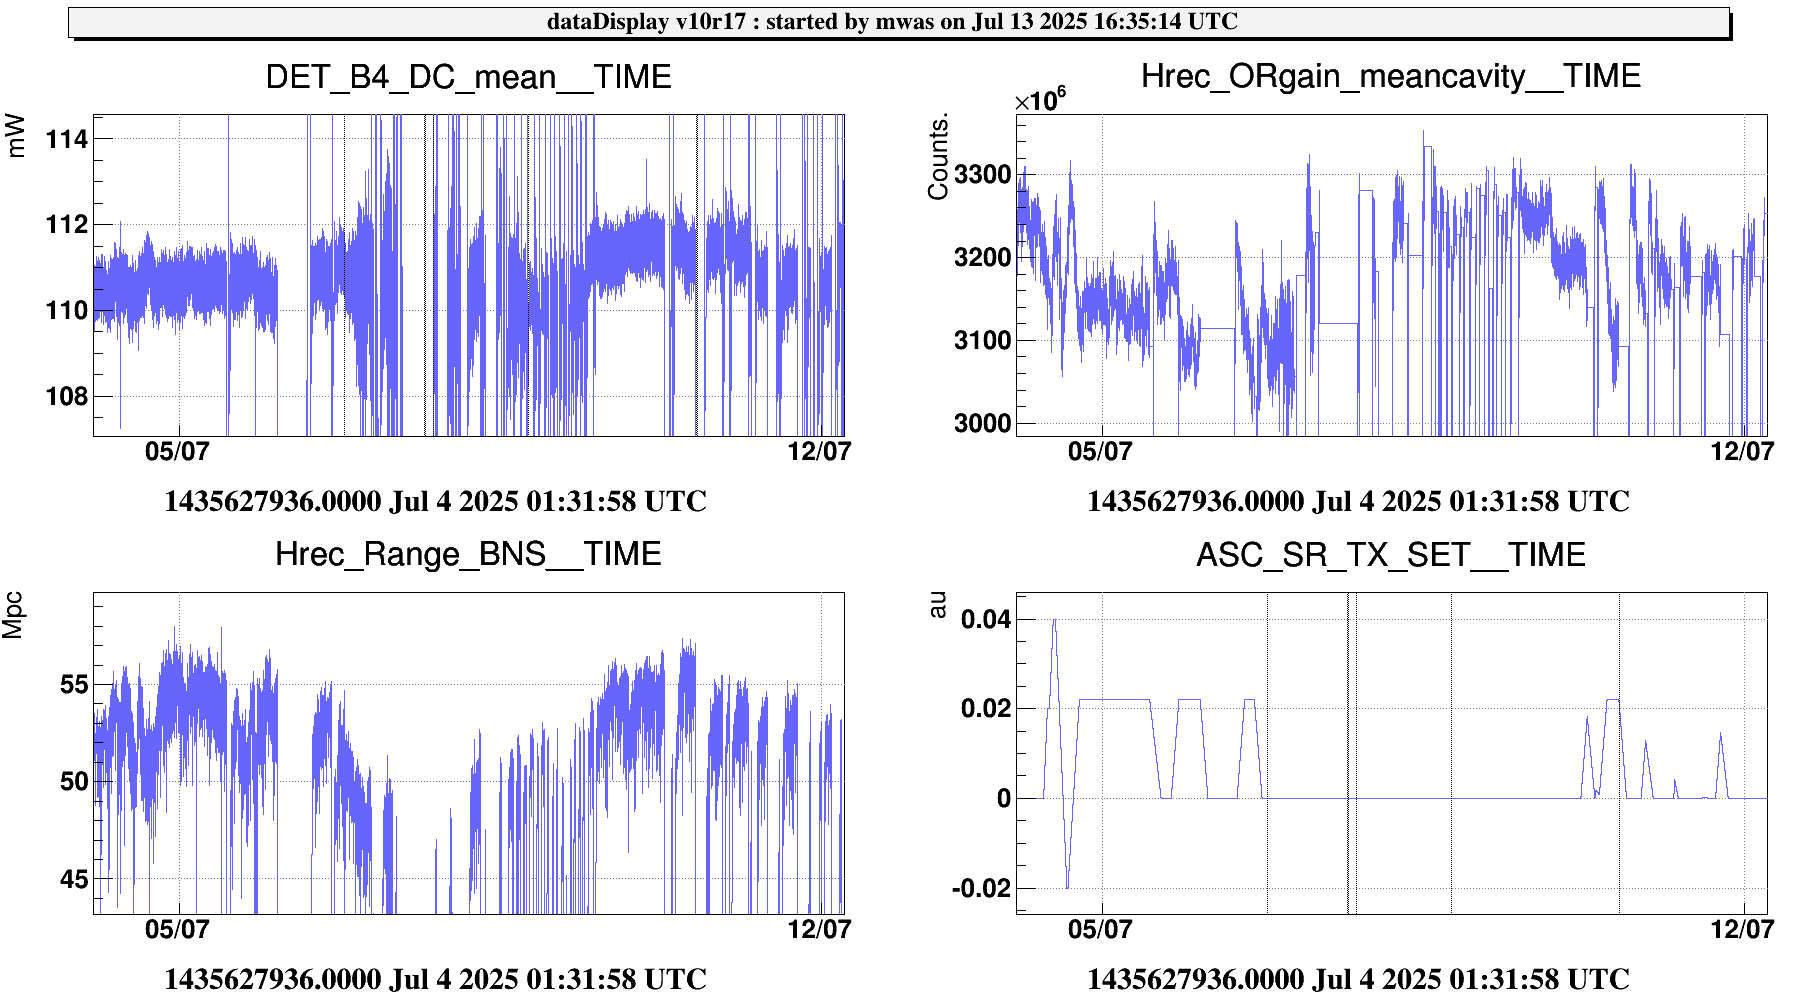
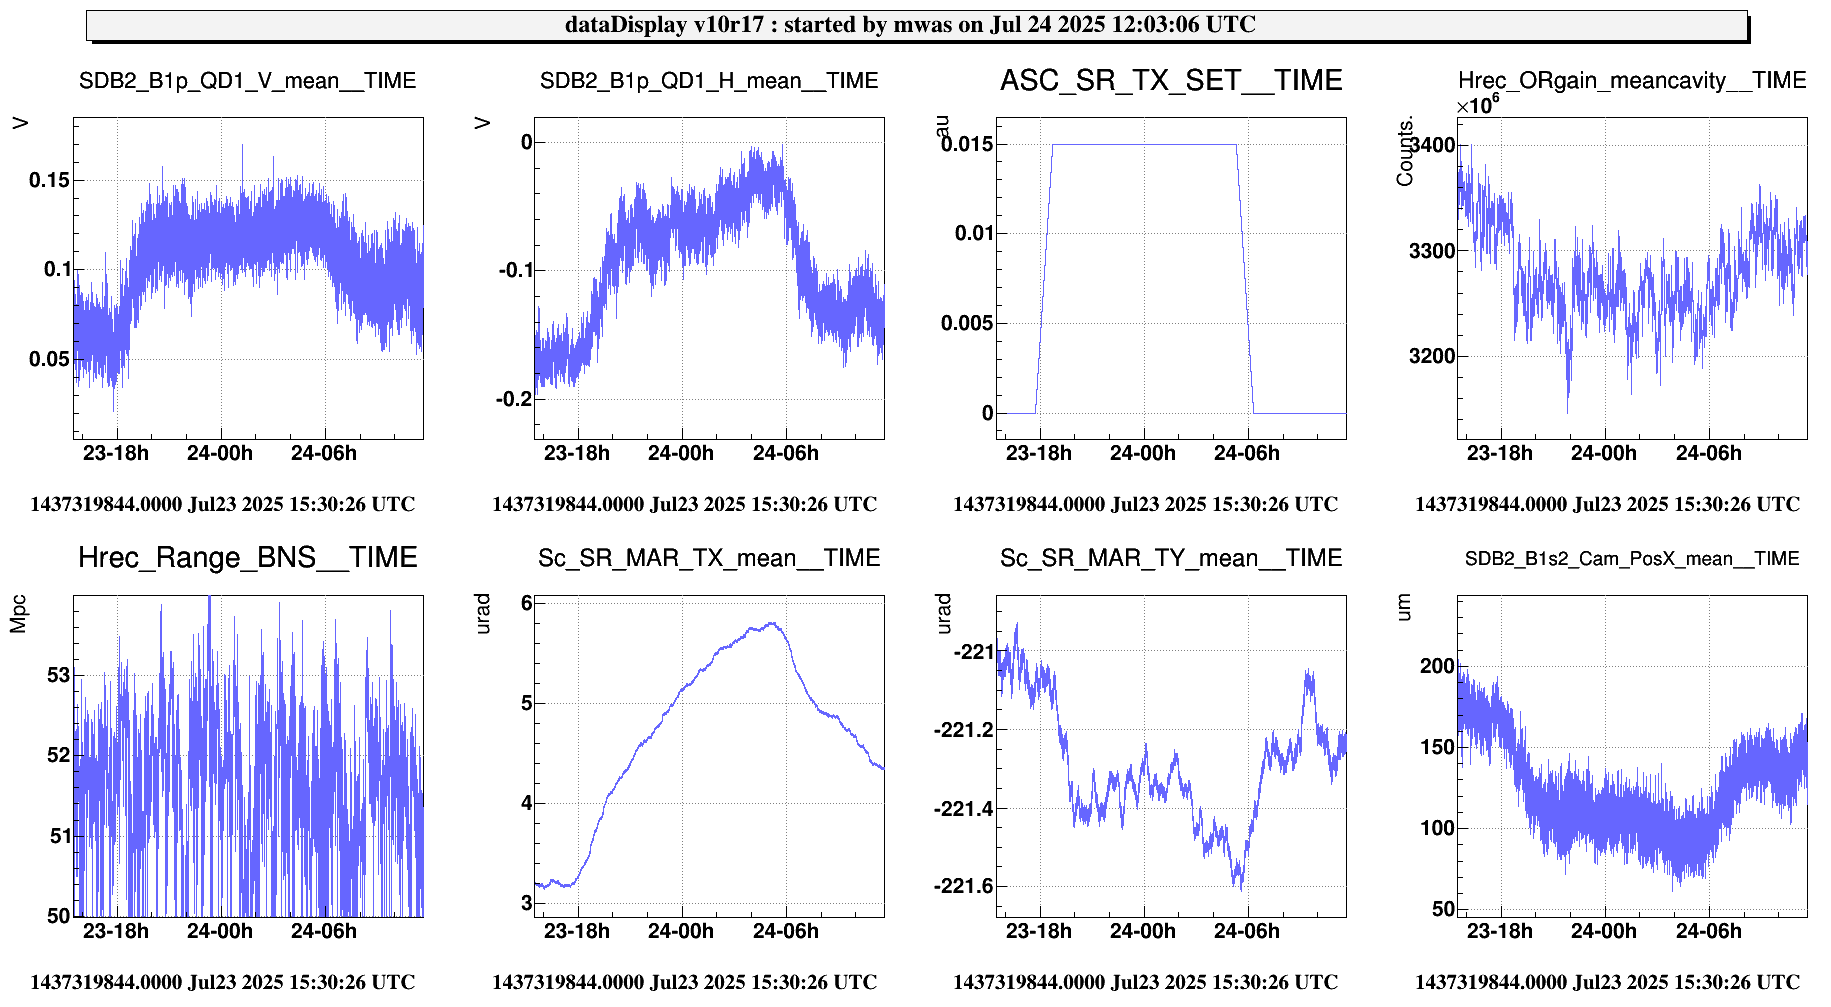
This operation has been done for the data acquired on Jul 4, starting from 16:40 UTC, for 70000 seconds. The BNS range was high thanks to the offset on SR_TX. Eleven segments with BNS range > 55.8 Mpc has been selected for a total time of 2156 s, obtaining an averaged range of 56.5 Mpc.
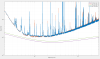
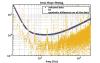
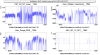
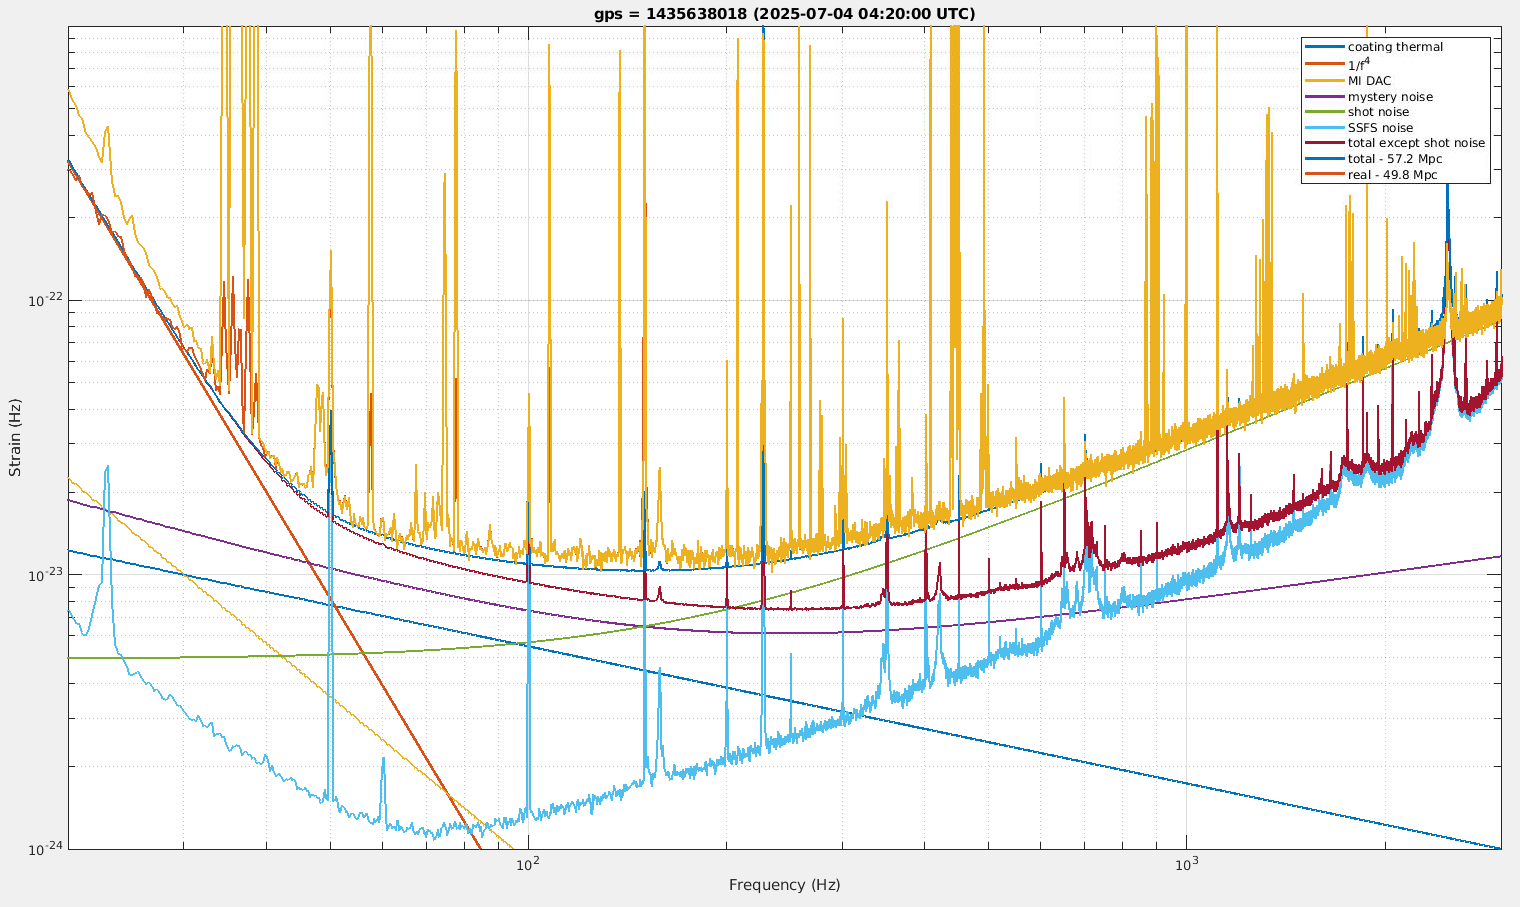
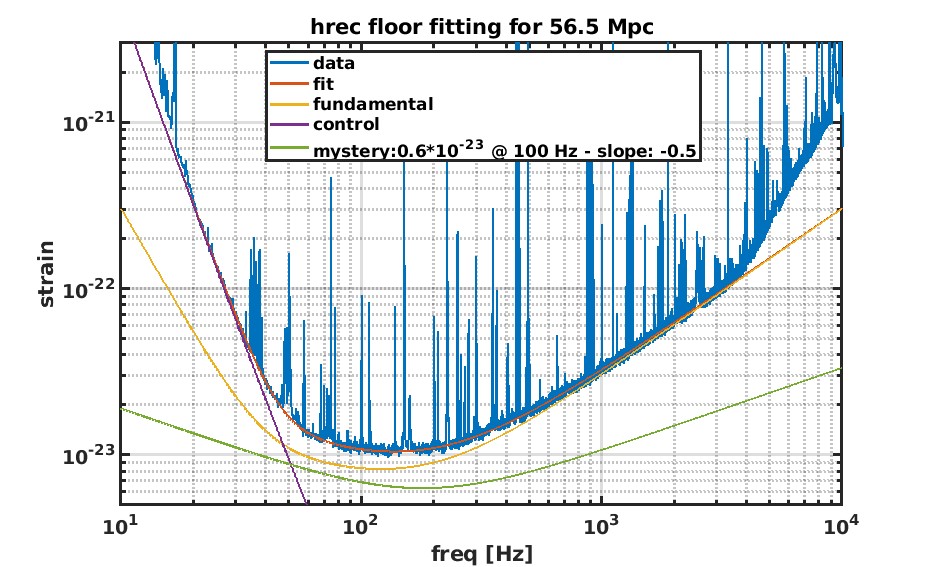
The floor of the spectrum has been reconstructed by a quadratic sum of simple contributions
- 1/f^4 3.2e-23 @ 35 Hz (control noise)
- 1/f^3 0.29e-23 @ 60 Hz (control noise) a small adjustment of the low frequency part, dominated by the previous term
- 1/f^2.5 30e-23 @ 10 Hz (pendulum thermal noise)
- 1/f^0.5 0.55e-23 @ 100 Hz (coating thermal noise)
- 1/CavPOLE 0.55e-23 @ 0 Hz (readout noise)
- 1/(CavPOLE*f^0.5) 0.6e-23 @ 100 Hz (mystery noise); the amplitude regards the 1/f^0.5 part, before the cavity pole.
The list of contribution is a bit arbitrary and doesn't want to be a real noise budget: the only check that it could be a good model comes from the quality of the final reconstruction, but other models could be equally good or better.
The final reconstruction is the output of a semi-automatic iterative process, which returns the 6 amplitudes shown in the list. It is a search of a minimum error, but not on 6 free parameters: the two regarding the thermal noise are fixed, coincident with an expected value. A check on those two values has been done, observing that the quality of the fit starts to degradate if too different vaues are choosen. A full automatic search was unsatisfactory, because too dipendent on the starting values.
A note on the mystery noise slope: putting it as a parameter of the search, the output was nomally closer to -0.5 than -0.66. Using it as a fixed number, the results were normally more accurate with -0.5, than -0.66. A fixed number -0.5 has been considered the best choice: using slopes as parameters gives not well converging results and seems not a good way to proceed, if the aim of the study is the evaluation of contribution amplitude in different conditions. As a personal opinion, -0.5 slope is preferable also in case of equivalent fitting accuracy, because it has more probability of being associated to a fundamental process.
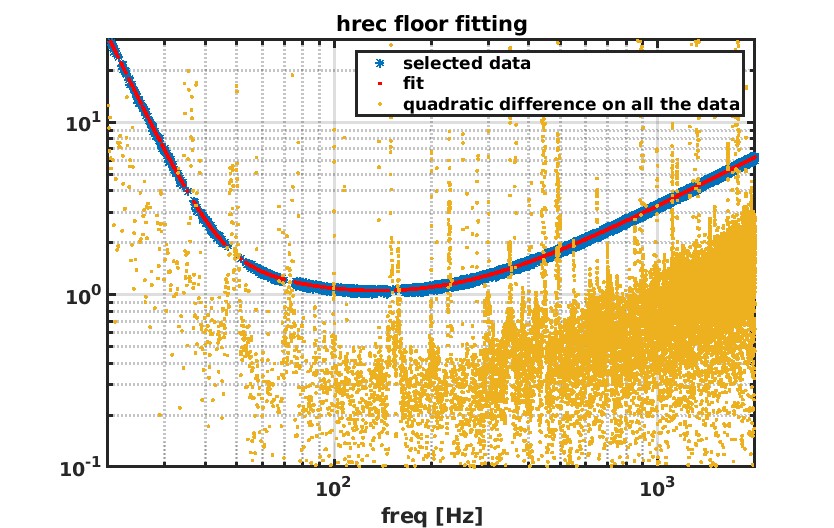
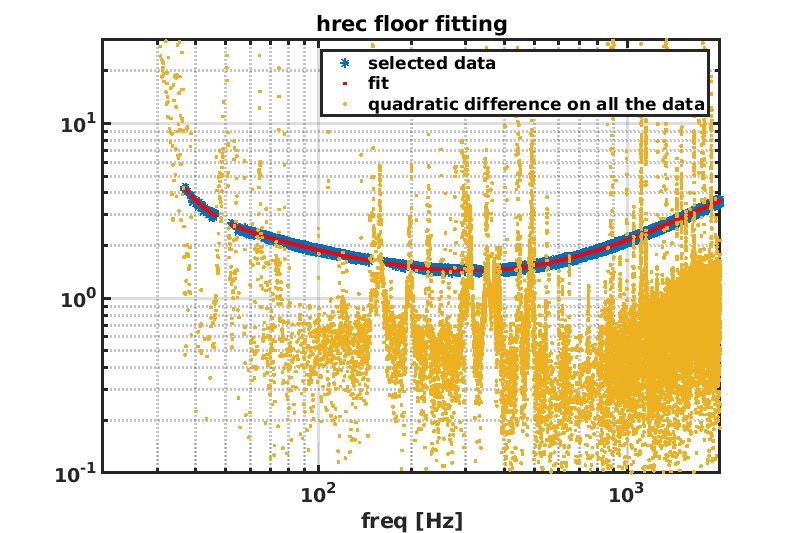
The optimal values of the parametric amplitudes have been obtained after a double iteration. The first has been applied to all the dots in the interval 15-2000 Hz. Using the first result, several dots has been excluded: all the ones too far from the fit. The aim of this selection was to exclude peaks, bumps and lines from the curve and keep only the floor. A second search has been done on the selected data.
Fig 1 shows the reconstruction for 56.5 Mpc curve.
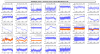
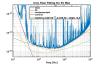
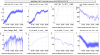
Fig 2 shows shows the accordance between the selected data and the fit. The yellow dots are residual values for all the data, re-including the dots excluded after the first iteration.
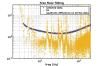
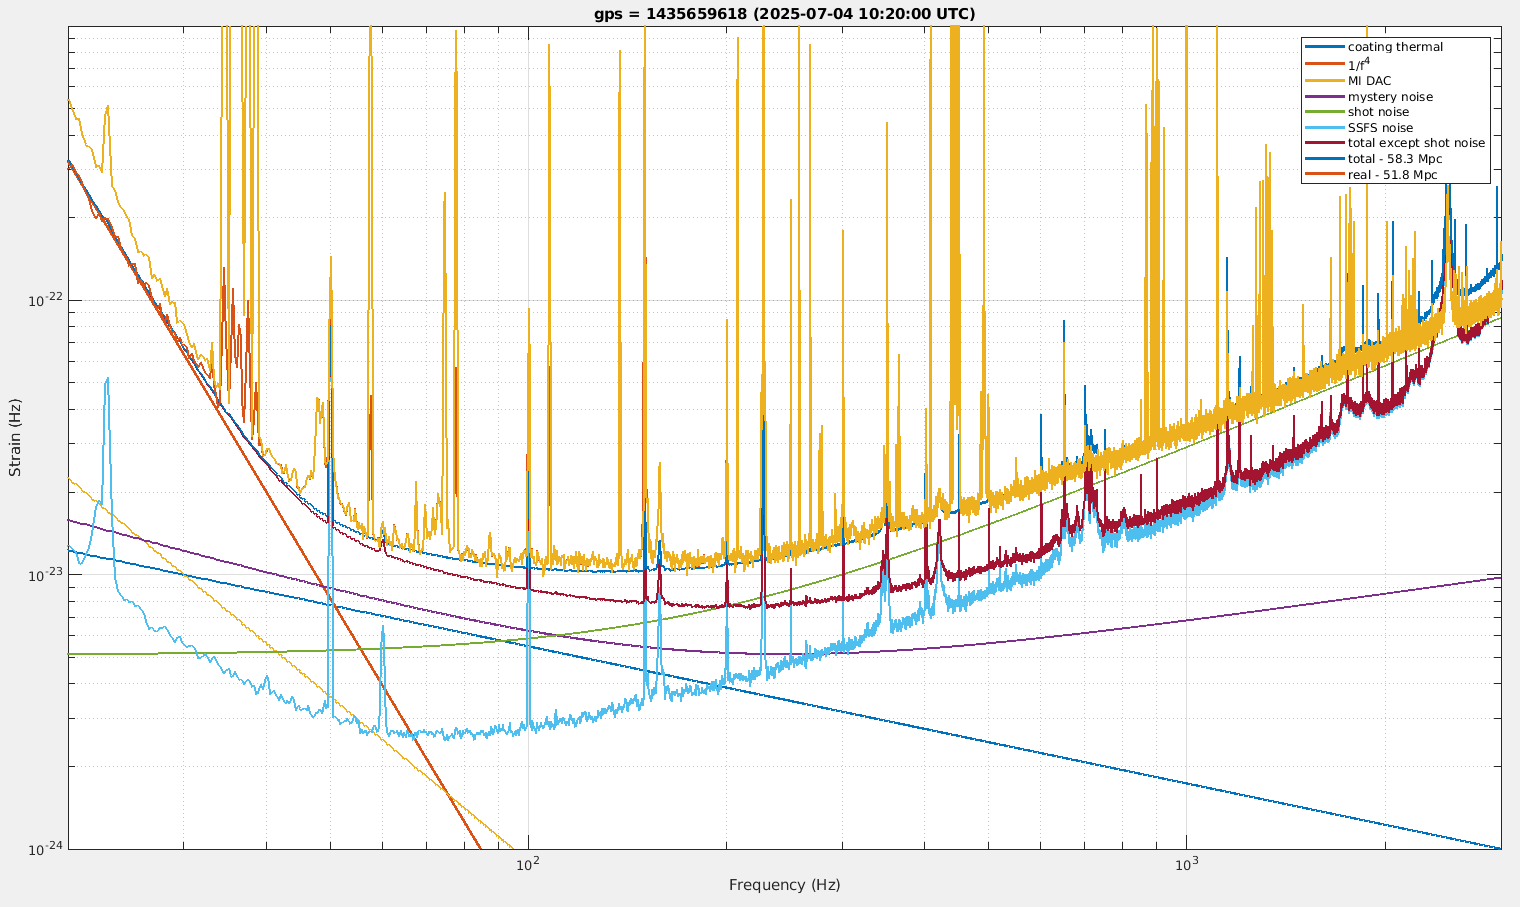
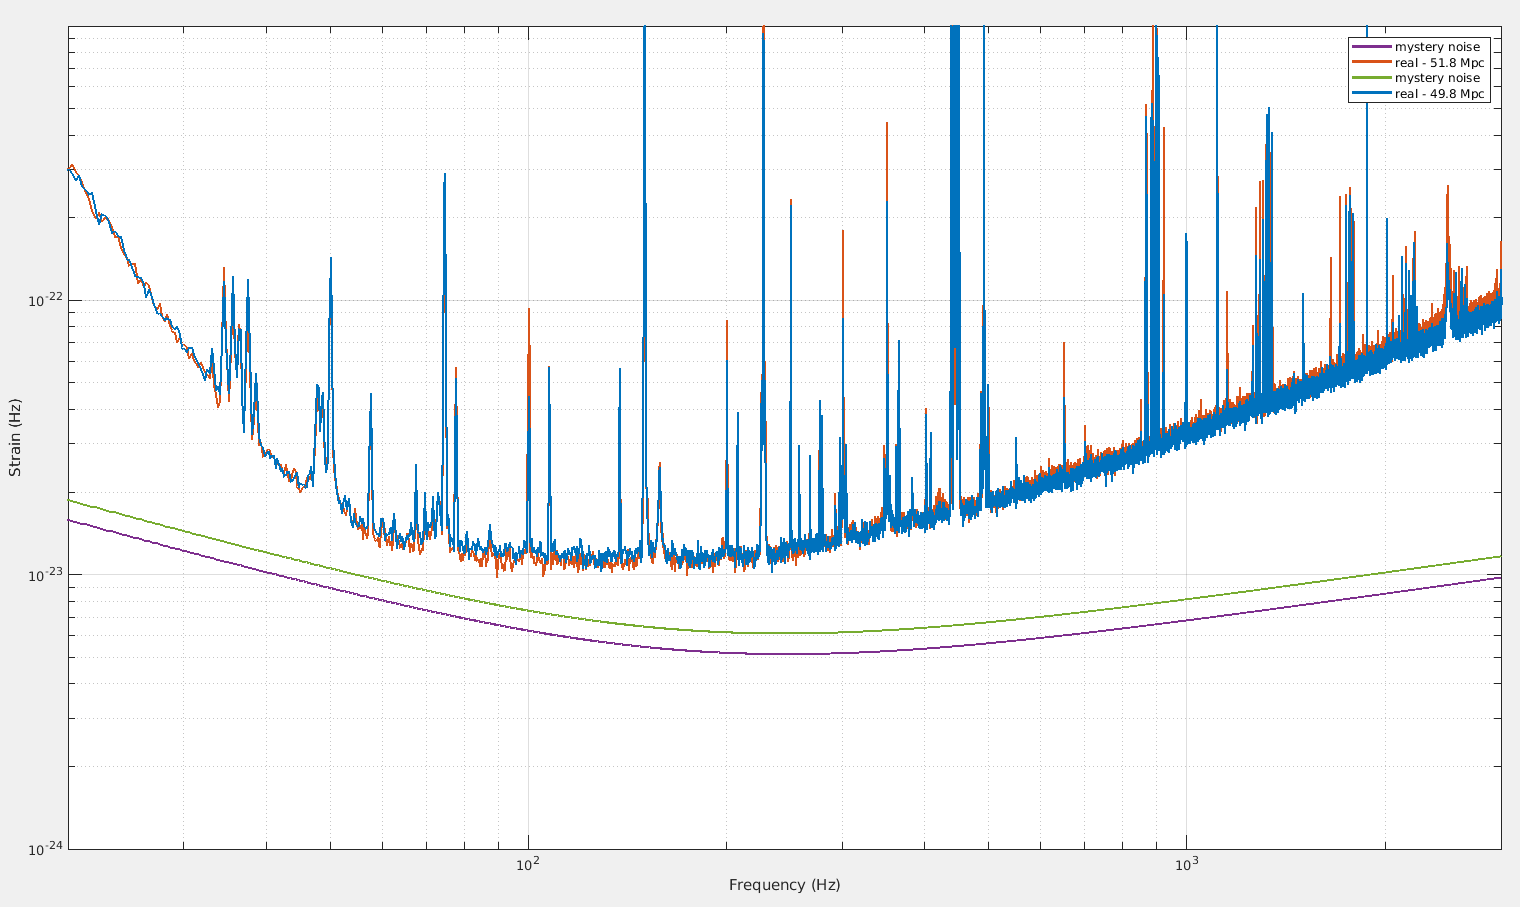
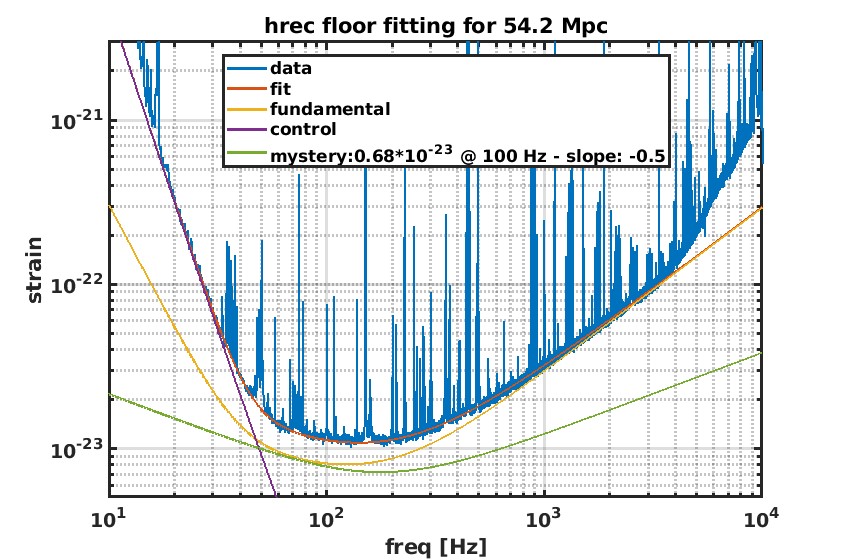
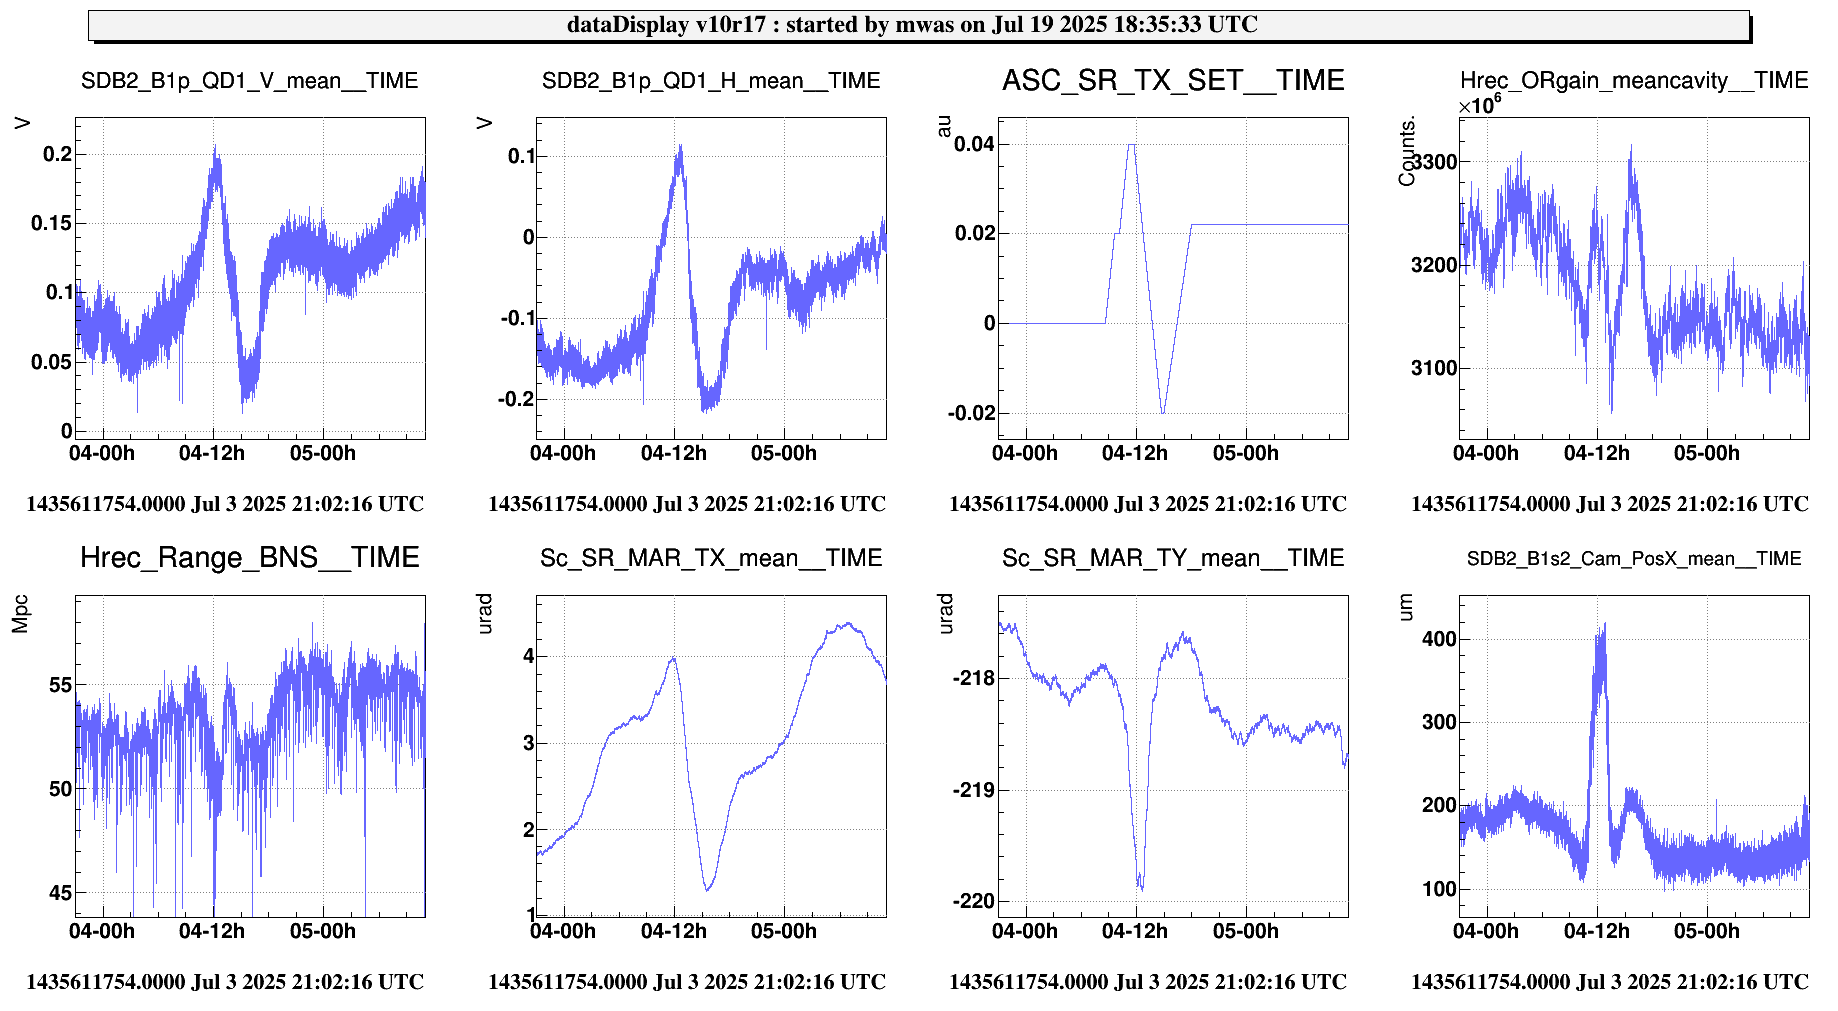
Fig 3 shows a similar analysis performed on data acquired with SR_TX aligned, starting from Jul 3 20:05, 45000 s. THe threshold on BNS has been put at 53.5 Mpc. The averaged range is 54.2 Mpc. The new amplitude of the mystery noise is 0.68e-23; the one with the adjustment of SR_TX was 0.60e-23. The output was slightly different also for other two components: the 1/f^3 and the readout noise. For both, the amplitude is about 6 % lower than the previous case. At high frequency the variation could be explained by an increase of the optical gain; the variation at low frequency could be not significant because regards a small component of uncertain origin.
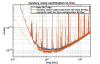
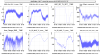
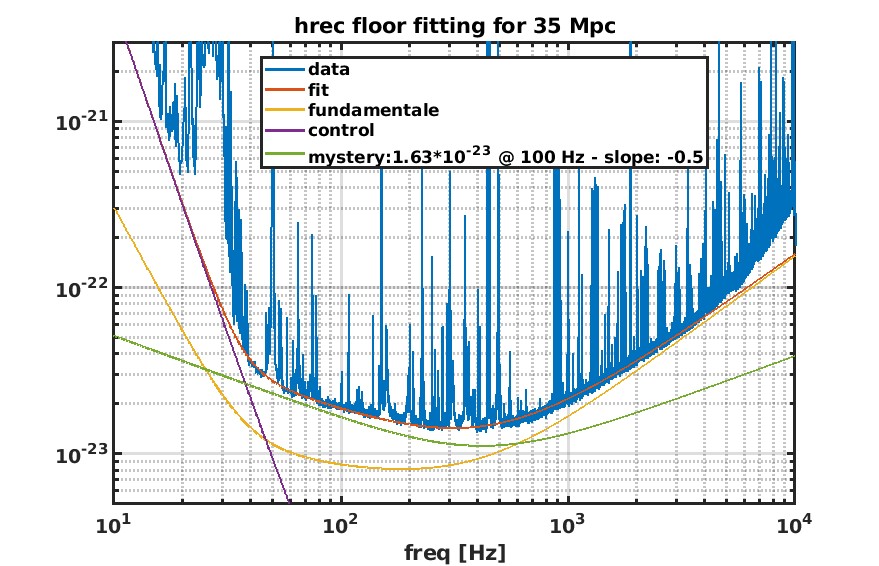
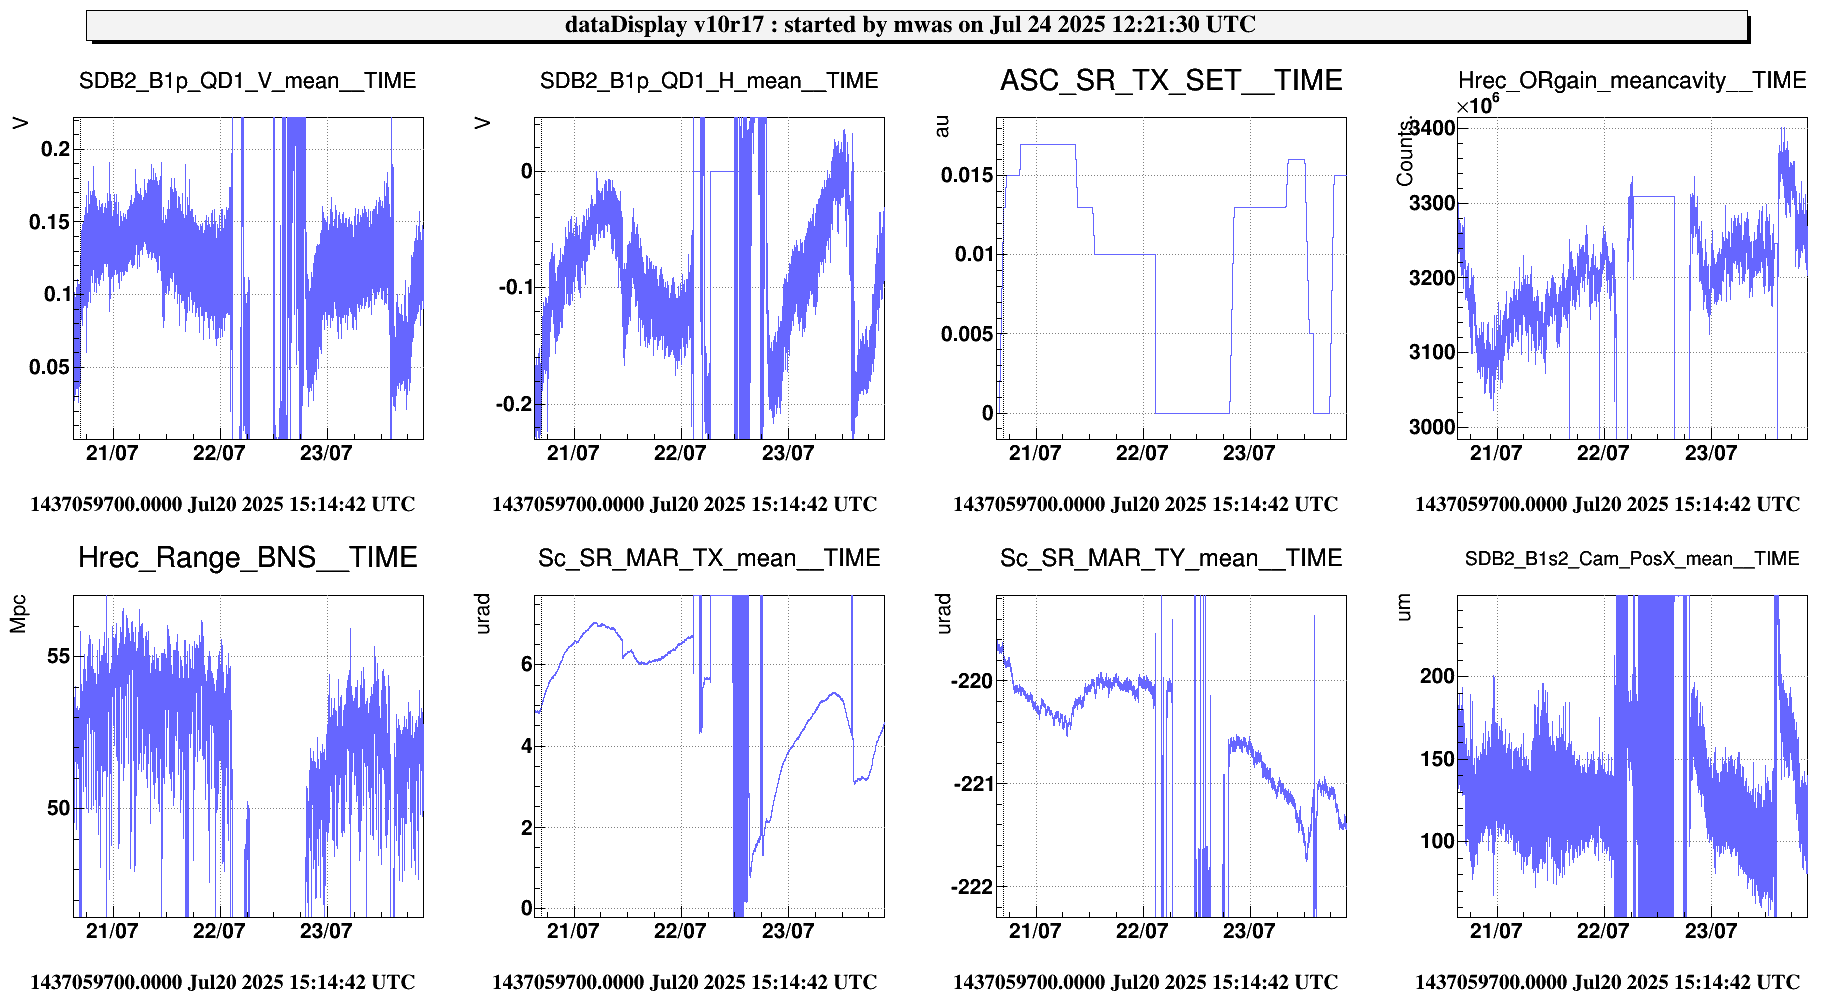
Fig 4: the same analysis has been applied to data in LN2, SR_TY aligned and mystery noise dominant in the data (Jul 3 15:45). Also for those data, the slope -0.5 seems to me preferable, even if the quality of the fit is less good (see also fig 5).
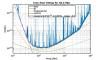
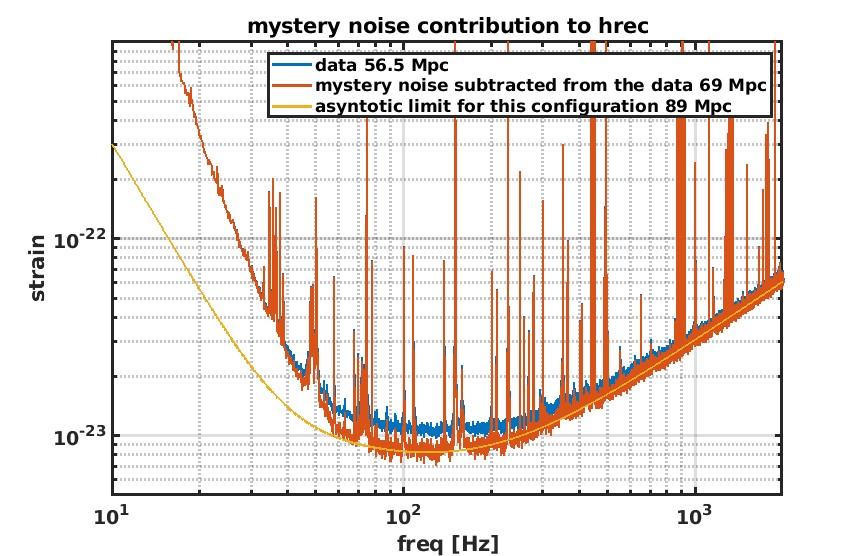
Fig 6: the recontruction done for the curve at 56.5 Mpc is used to show how a curve without mystery noise would be. The BNS range would reach 69 Mpc and there would be still a lot of noise to remove, before reaching the supposed limit of fundamental noise for this configuration, at 89 Mpc.


