Reports 1-1 of 1 Clear search Modify search
AdV-COM (1/√f noise)
mwas - 13:46 Friday 16 May 2025 (66804) Print this report
OMC scans with SR aligned and misaligned

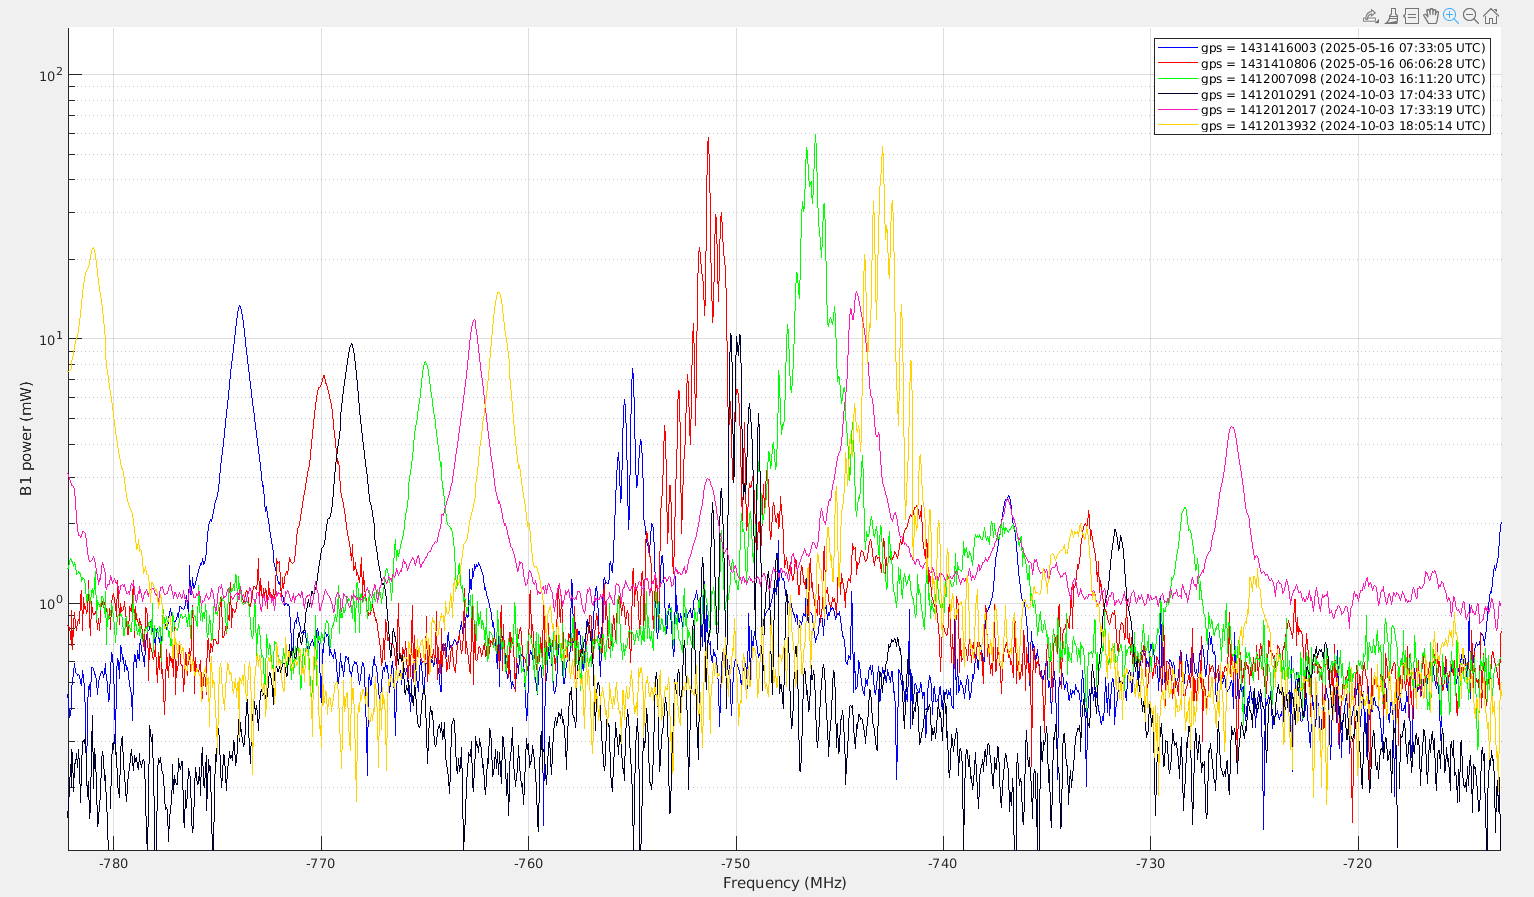
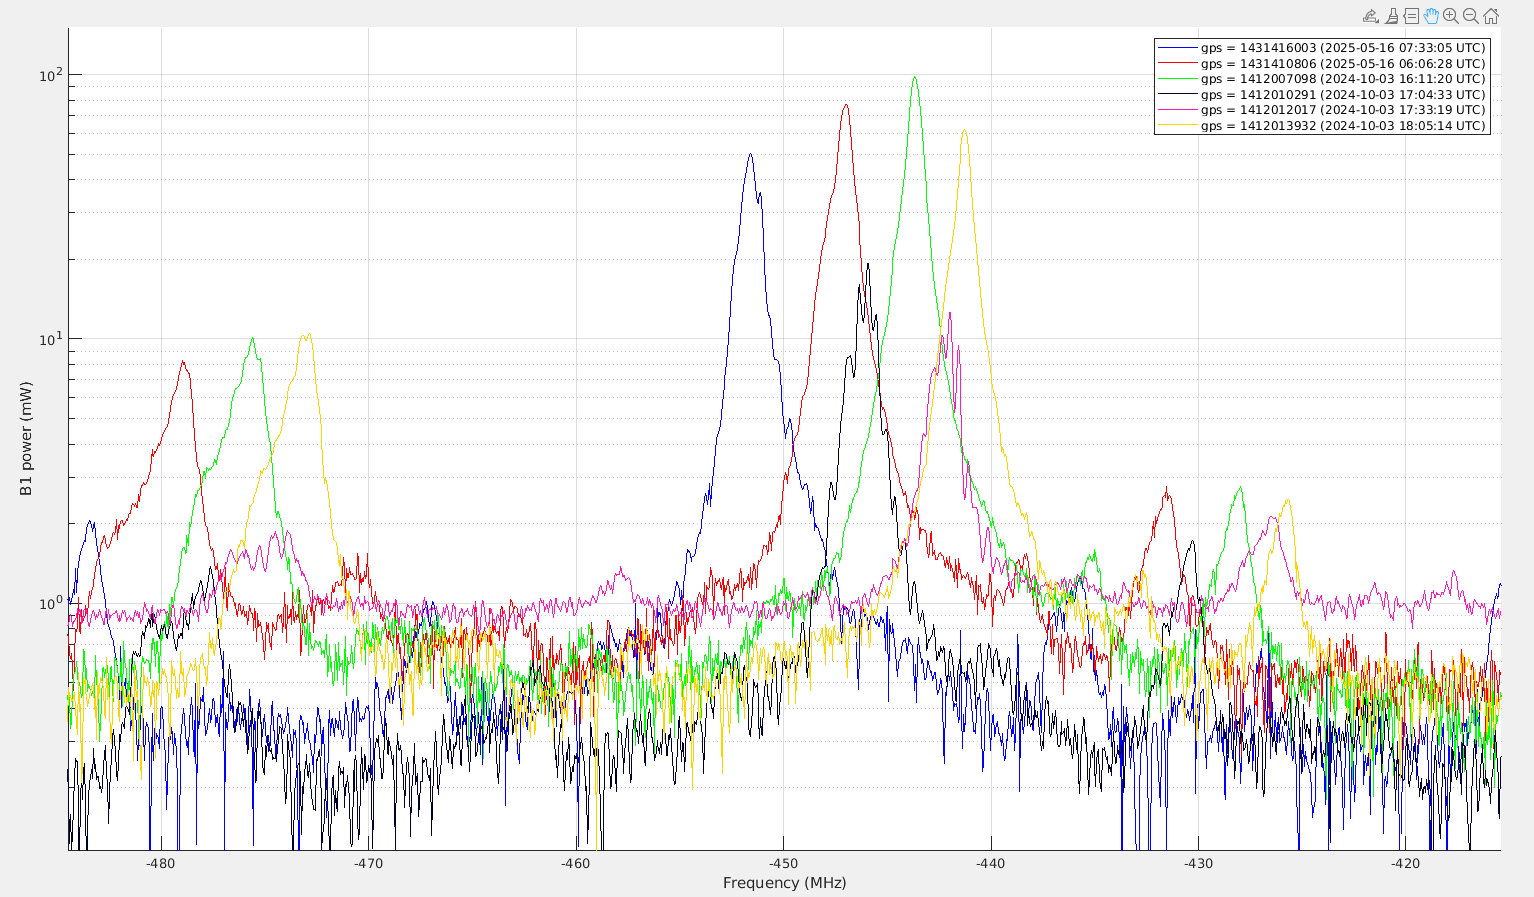
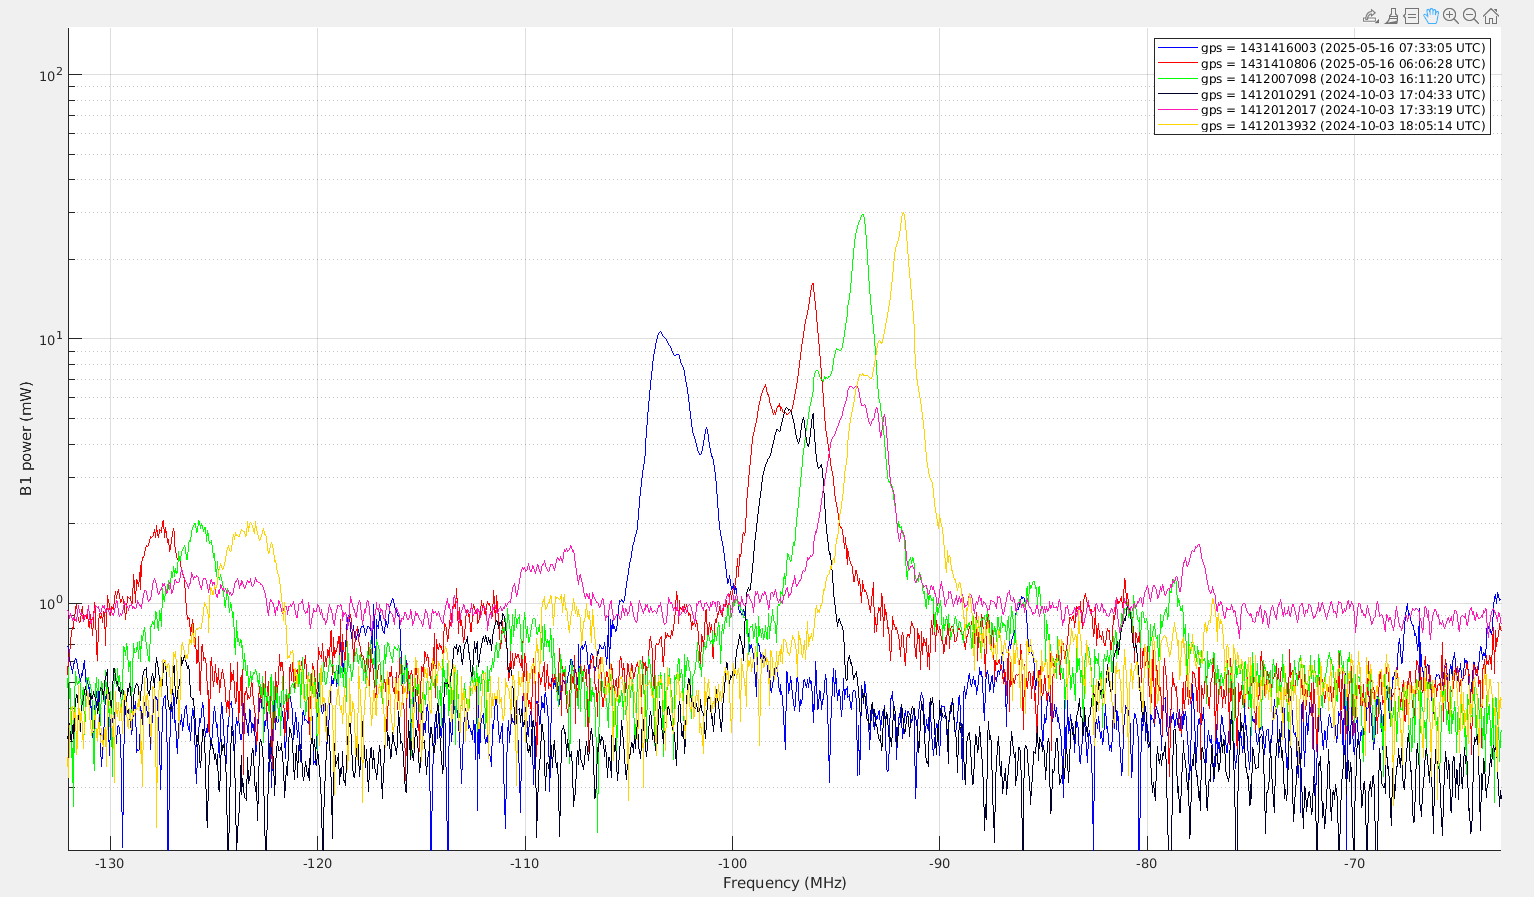
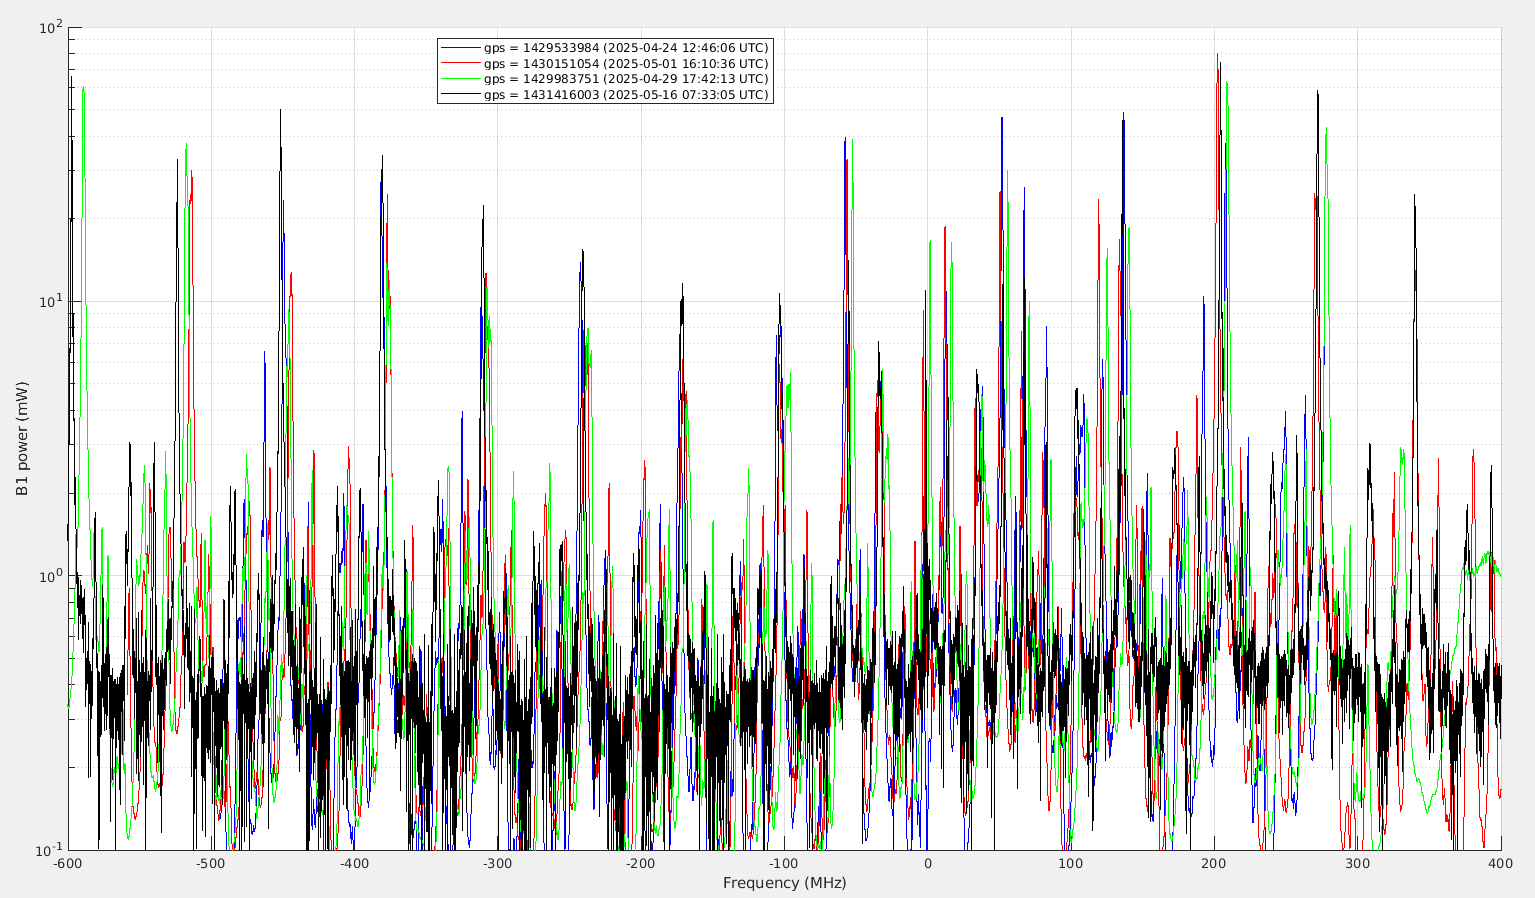
In order to compare with previous measurements before the WE replacement (https://logbook.virgo-gw.eu/virgo/?r=65254) I have made this morning scans of the OMC with SR aligned and misaligned (initially planned for yesterday evening). The data analysis and comparison with previous scans of the SDB1 OMC and the EDB OMC remains to be done.

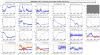
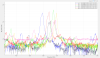
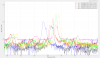
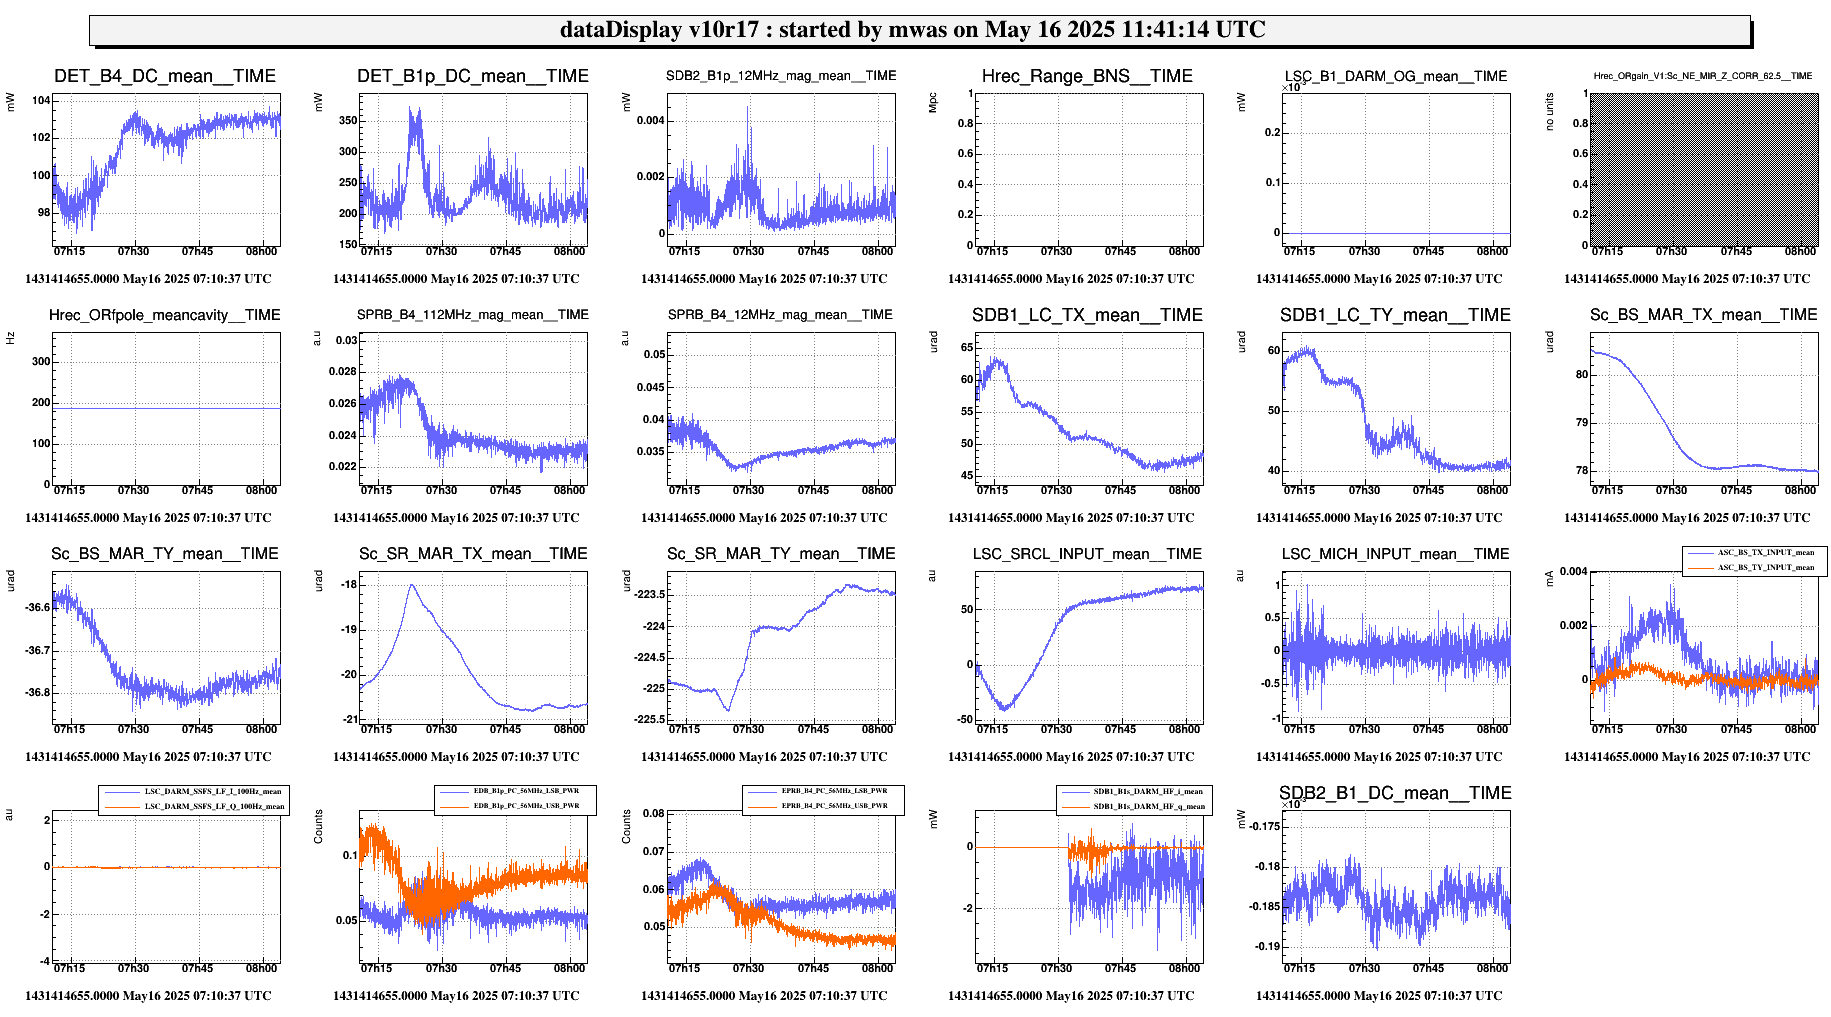
Figure 1 One thing that I have noticed is that when misaligning SR in CARM NULL 1F around 07:40 UTC, the power on B4 (carrier recycling gain) has increased. Which would mean that the effect of the point absorber, even with the beam off-center on WE depends on signal recycling, and with signal recycling misaligned the losses due to the point absorber are smaller.

Measurements times

06:06 UTC - OMC scan start in CARM NULL 1F (20min after lock)
unlock near the end of the scan

relock, SR_TY steady around -225.0 wihle SR/BS TX moving (due to the
mis-centering on WE), starting to add offset on SR_TY while the other
transients are ongoing. But SR TY moved -225.4 just before that, so using that as a reference of aligned SR to add ~2urad of misalignment to.

7:25 UTC, SR_TY_SET = 0.3
7:28 UTC, SR_TY_SET = 0.5
7:30 UTC, SR_TY_SET = 0.15 to stabilize at SR TY = -224

7:33 UTC - OMC scan start with SR misaligned
7:40-7:44 increase SR_TY_SET to 0.25 and then reverted to 0.2 to recover DCP around 190Hz and lower B1p power
Overshoots to DCP of ~150Hz, continously adjusting the SR TY offset to try to stay around 190Hz.

08:04 restoring SR alignment

Images attached to this report
Comments to this report:
mwas - 7:49 Thursday 22 May 2025 (66826) Print this report

This is the analysis of the OMC scans done last week. The lines in blue, black and magenta correspond to SR misaligned, and the lines in red, green and yellow to SR aligned. The first two lines (red and blue) are for the WE mirror with the large point absorber, and the rest is measurements from October 2024 and provides a reference. Overall there is no sigificant difference compared to last year. 

A possible exception is mode of order 5, which is large (50-80mW) for both SR aligned and misaligned last week compared to the aligned case (10-20mW), while last year it was large only for SR aligned, and less clearly the same is true for the mode order 6 and 7. But this is not reliable, as looking at the scan with the downgoing temperature of the OMC the modes for SR aligned are not high, and are at similar level as last year, the SR misaligned case is not well controlled as the SR misalignment is added by hand and drifting.

Figure 1, zoom on order 1 mode, it is higher when SR is misaligned

Figure 2, zoom on order 2 mode, no significant difference

Figure 3, zoom on order 3 mode, it is higher when SR is aligned

Figure 4, zoom on order 4 mode, it is higher when SR is aligned

Figure 5, zoom on order 5 mode, it is higher when SR is aligned, and also for SR misaligned only for last week scan

Figure 6,  zoom on order 6 mode, it is higher when SR is aligned, and also for SR misaligned only for last week scan

Figure 7, zoom on order 7 mode

Figure 8, zoom on order 8 mode

Figure 9, zoom on order 9 mode

Figure 10, zoom on order 10 mode

Figure 11, zoom on order 11 mode, the 56MHz upper sideband TEM00 is visible around -50MHz

Figure 12, zoom on order 00 mode, the 56MHz upper sideband order mode is visible around +20MHz for the SR misaligned scans

Figure 13 shows the up-going and down-going scan with SR misaligned, and the highlighted modes order 5 and 6

Figure 14 for completeness shows the up-going and down-going scan last week with SR aligned.

/users/mwas/OMC/OMC_scan_demod_20250516/OMC_SCAN.m

Images attached to this comment
mwas - 16:23 Thursday 22 May 2025 (66831) Print this report

I have some of the EDB OMC scans that were done in LN3 in the past few weeks. In the figures below in blue is a scan with the beam centered on WE before the tuning of the RH, and in red and green with the beam off-center, while in black is a scan of the SDB1 OMC with SR manually misaligned by a comparable amount to the LN3 configuration. For the EDB OMC the expectation is that 5% of the beam power reaches the photodiode, so in principle it needs to be multiplied by 20 to have the power at the level of the SDB1 OMC reflection, in practice I have multiplied it by a factor 100 instead to have comparable heights of the peaks in the scan. It is unclear why this is the case, it could be the EDB OMC alignment which is bad, and lowers all of the peaks in a similar way, but I find that doubtful. More likely there are mistakes in the estimation of the transmission to the EDB OMC and/or to B1 PD3 in transmission of the SDB1 OMC.

Figure 1 shows the full scan, the height of the peaks roughly agree between all cases for most of them. Note that for the EDB OMC some of the scan data is missing or incorrect at the beginning or end of the frequency range.

Figure 2 zooming in the 56MHz TEM00 (-56MHz and +56MHz and their order 1 modes (+16MHz and +128MHz) look higher in the EDB scans. I don't have a good explanation for that.

Figure 3 zooms around the carrier TEM00, what is surprising is that ther is one, as normally that should be all transmitted by the SDB1 OMC , and nothing should reach the EDB OMC. It is puzzling. It could be the 6MHz sideband if the reconstruction of the frequency from the scan is wrong, but in that case it is still surprising why the peak is much larger than in the reference scan of the SDB1 OMC (black line).

/users/mwas/OMC/EDB_OMC_scan_20250424/EDB_OMC_SCAN.m

Images attached to this comment
Search Help
×

Warning

Error

The present report has been modified outside this window. Please check for its integrity in the main page.

Refreshing this page will move this report into drafts.

×