We started at 18:57 UTC and finished at 23:01 UTC, due to an unlock.
Unlocks:
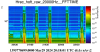
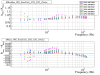
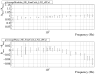
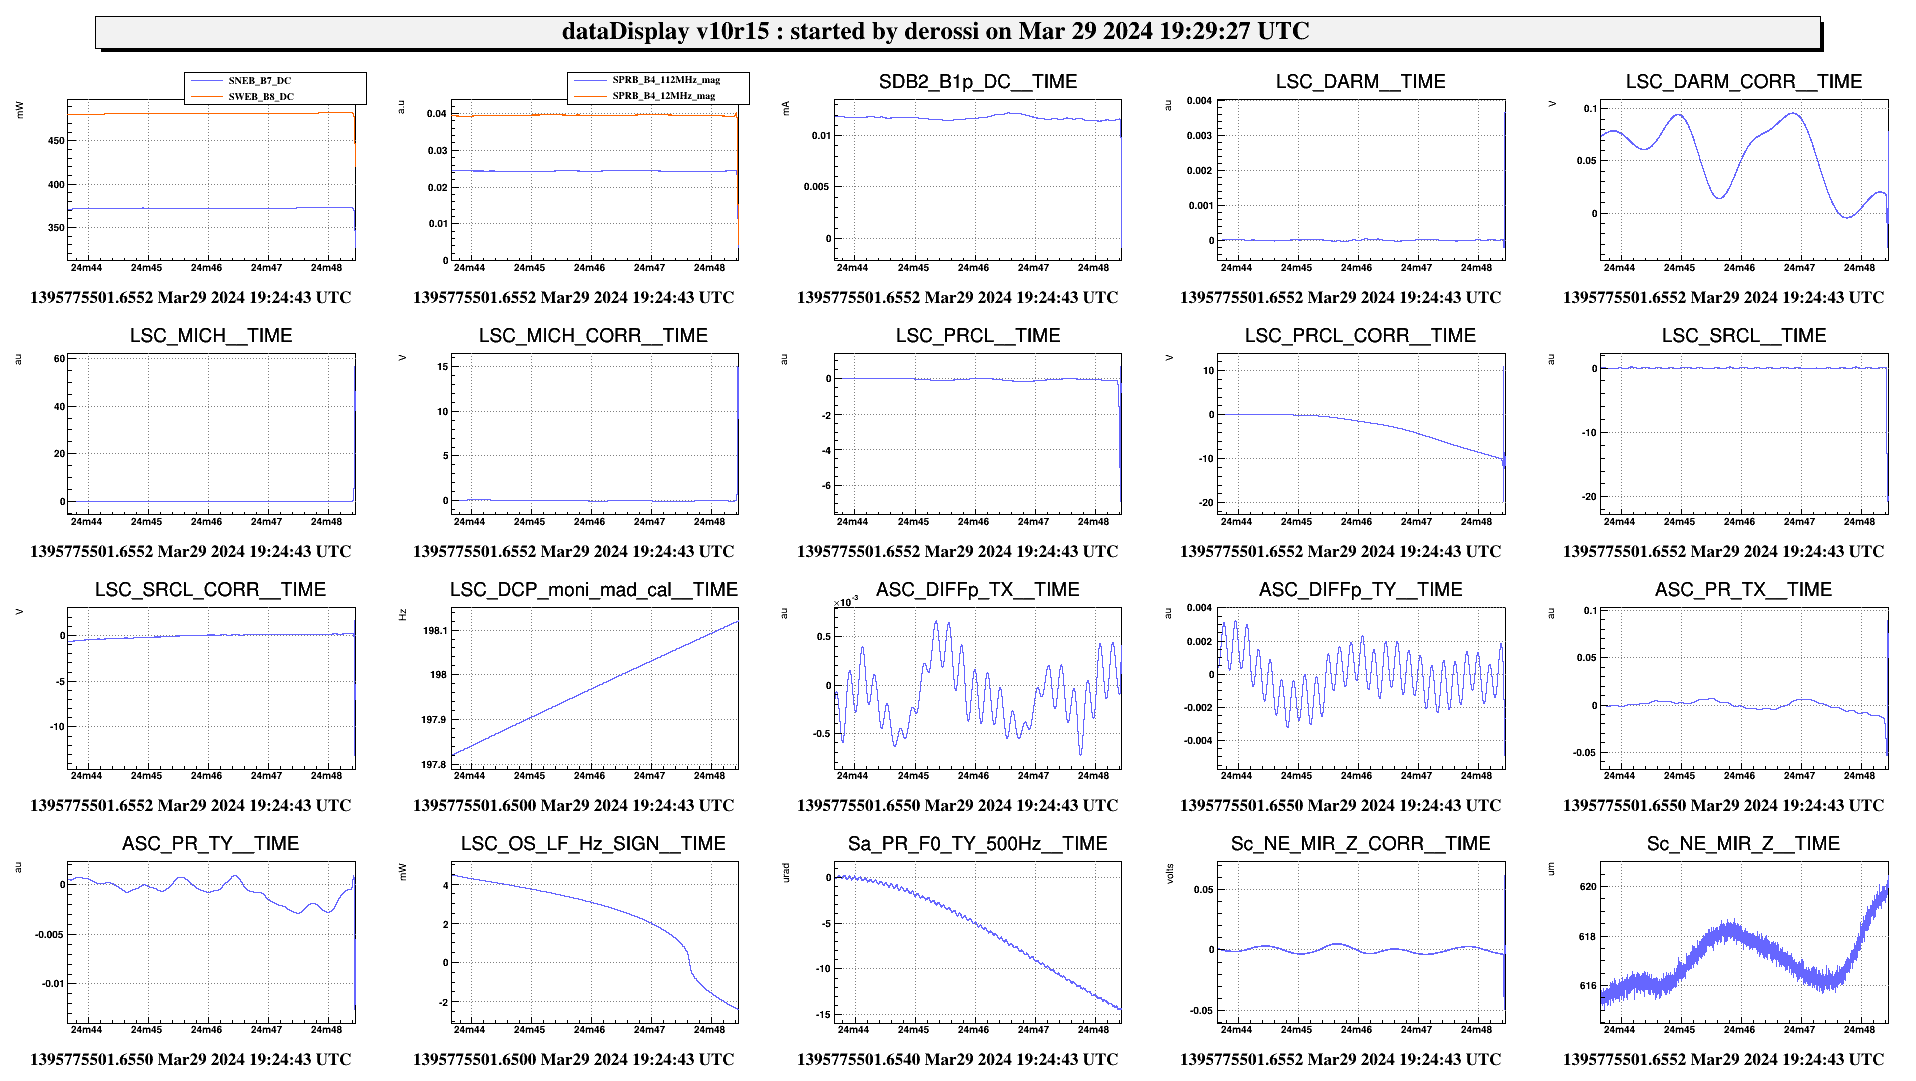
- First unlock happened at 19h24 from LN3 due to PR_F0_TY (Fig2)
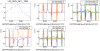
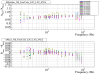
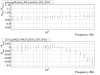
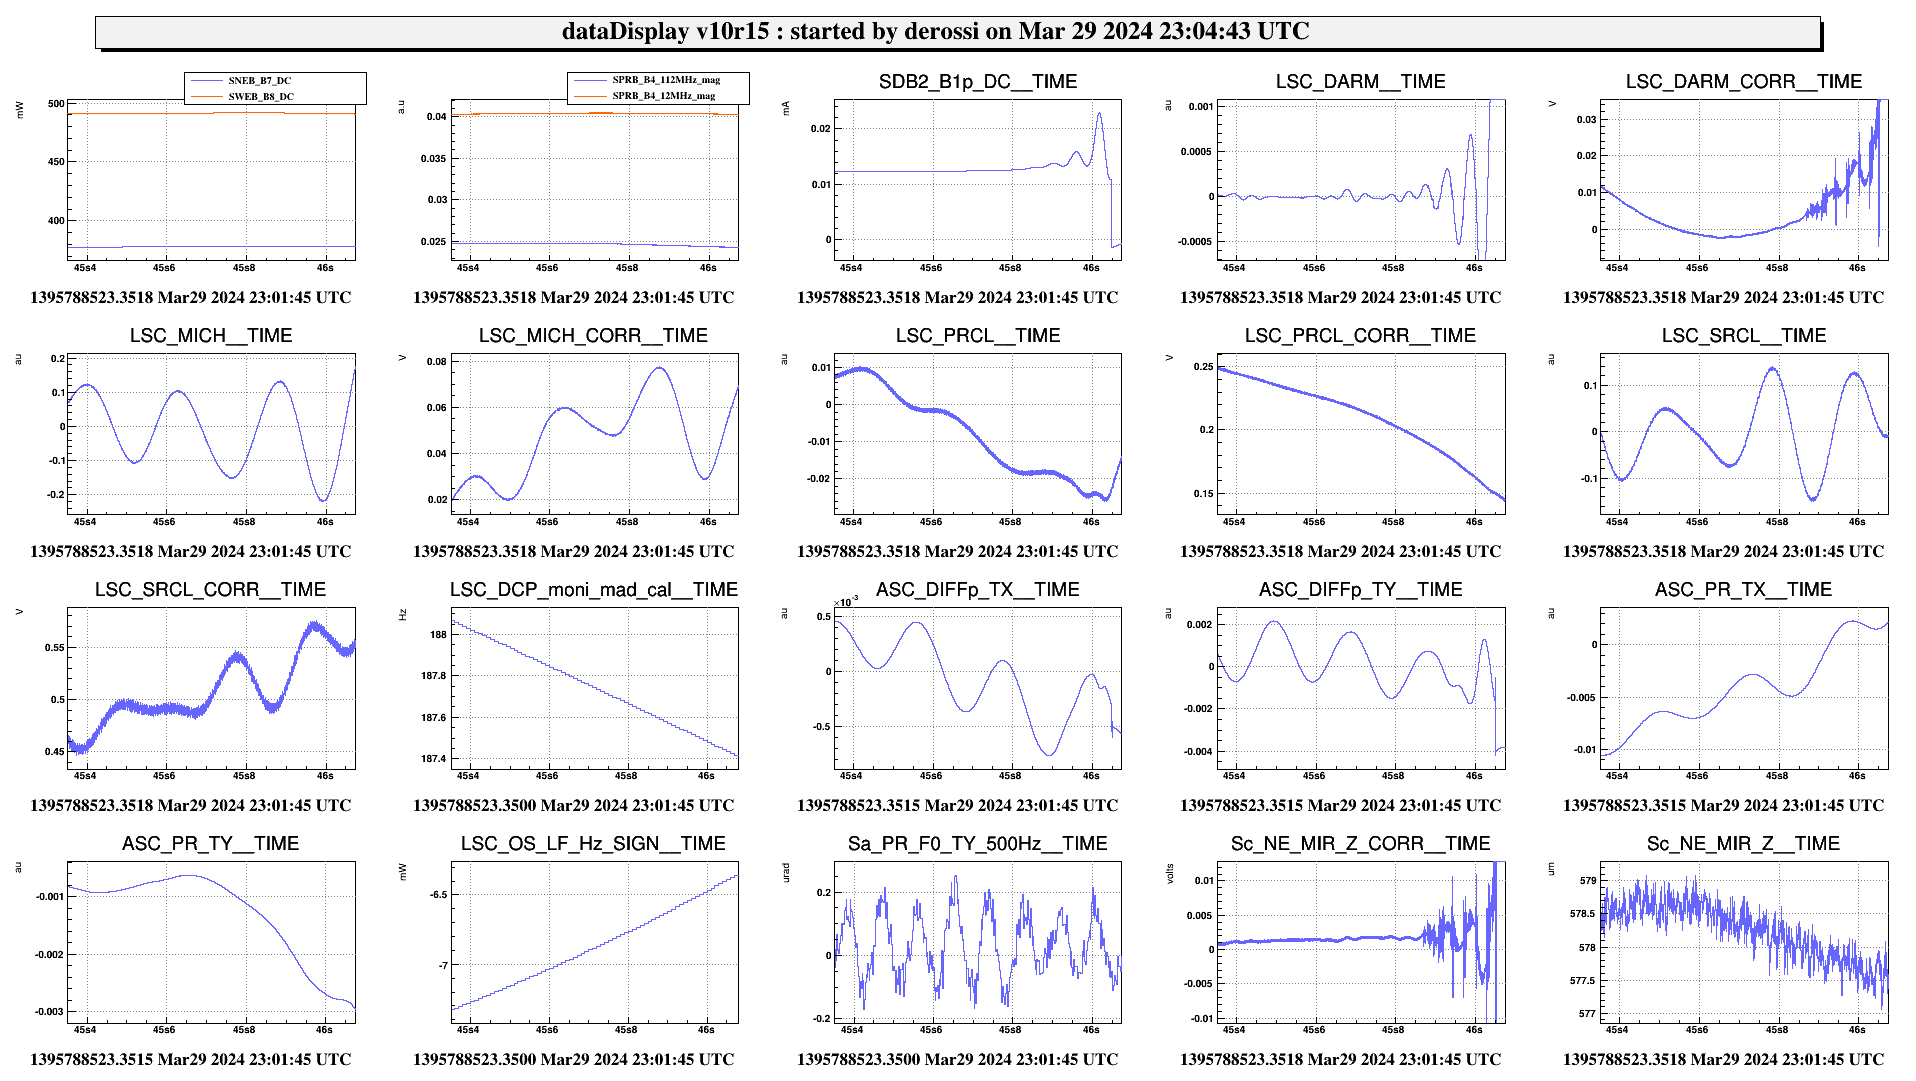
- Second unlock from CARM_NULL_1f due to DIFFp_TY oscillation at 4Hz (Fig3)
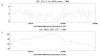
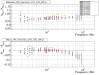
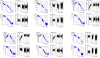
- The cause of the third unlock from LN3 is unclear but seems like there is a glitch in NE_MIR_zCorr (Fig4)
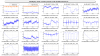
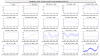
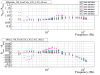
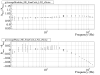
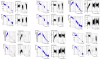
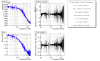
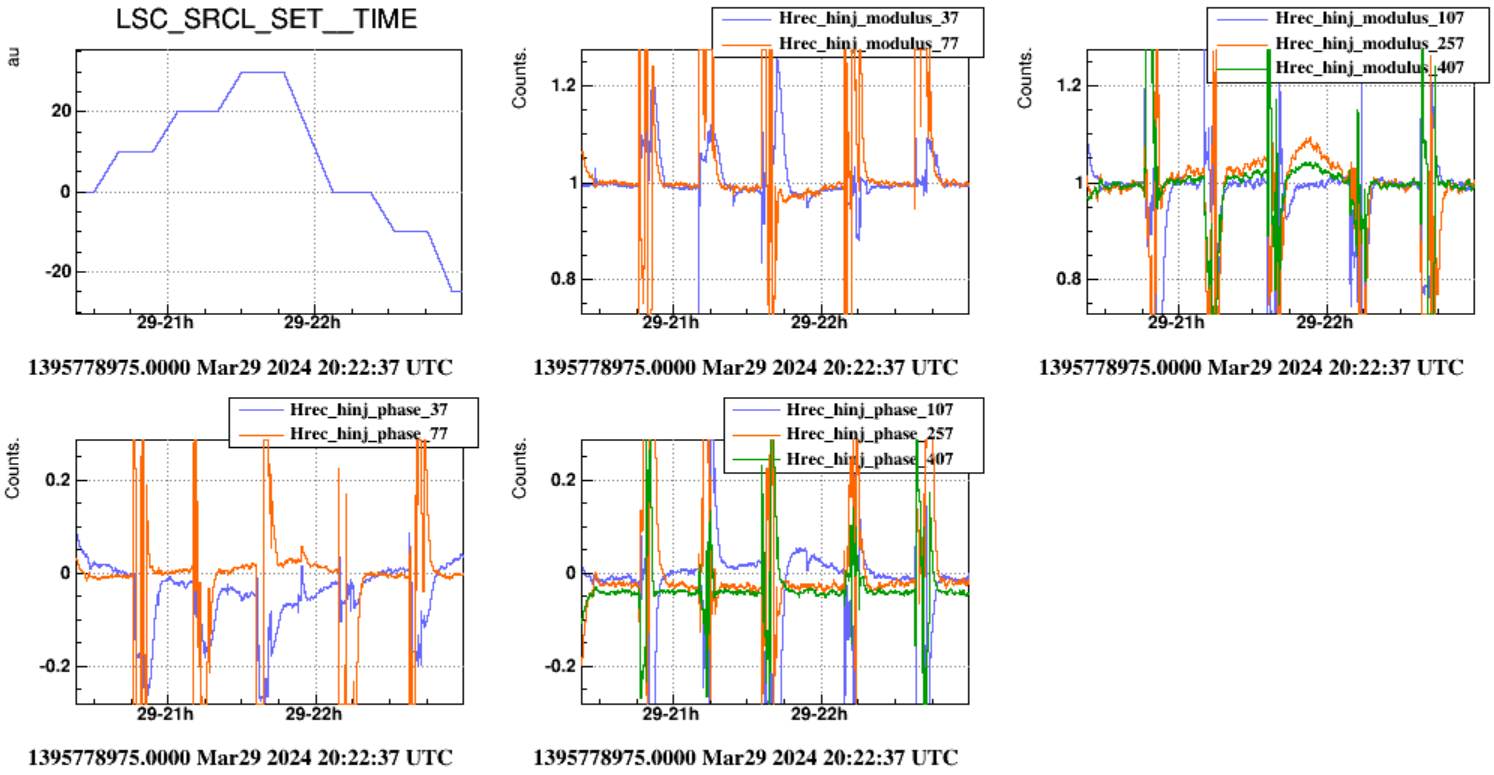
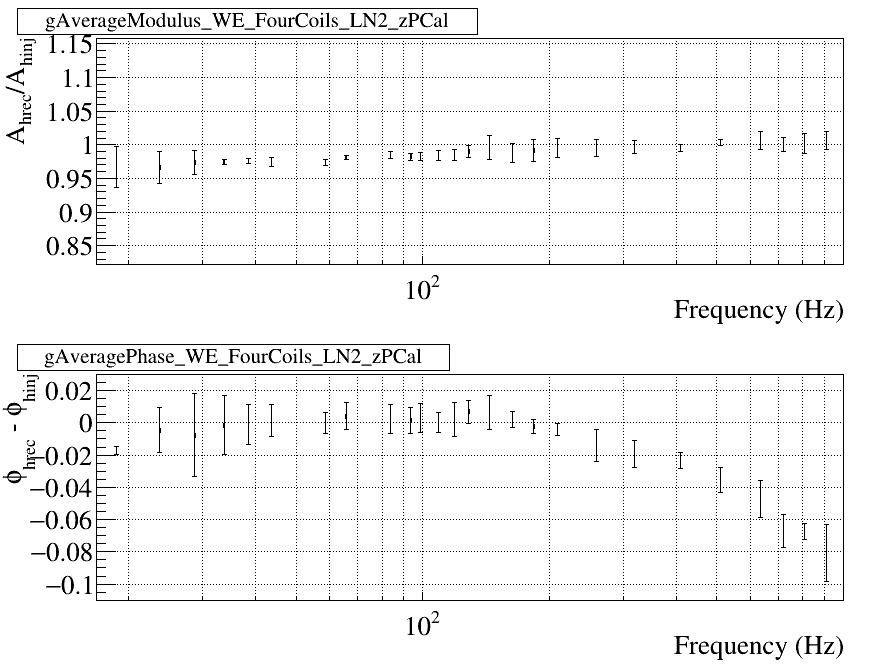
First plot shows the spectrogram of hoft_raw, where can be seen the checkhrec injections (lines injections during a few minutes) and optical response injections (broadband injections over about 10mn). Second plot shows the change of SRCL_SET value and the changes of the modulus and phase of hrec/hinj estimated by Hrec for a few permanent calibration lines. The large fluctuations of hrec/hinj modulus and phase are when the check or optical response injections have been done. In between, we can see that hrec/hinj modulus and phase are affected by the change of SRCL_SET (tuning of SR) mainly at low frequencies. This should be confirmed by the checkhrec injections results to come soon.
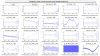
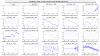
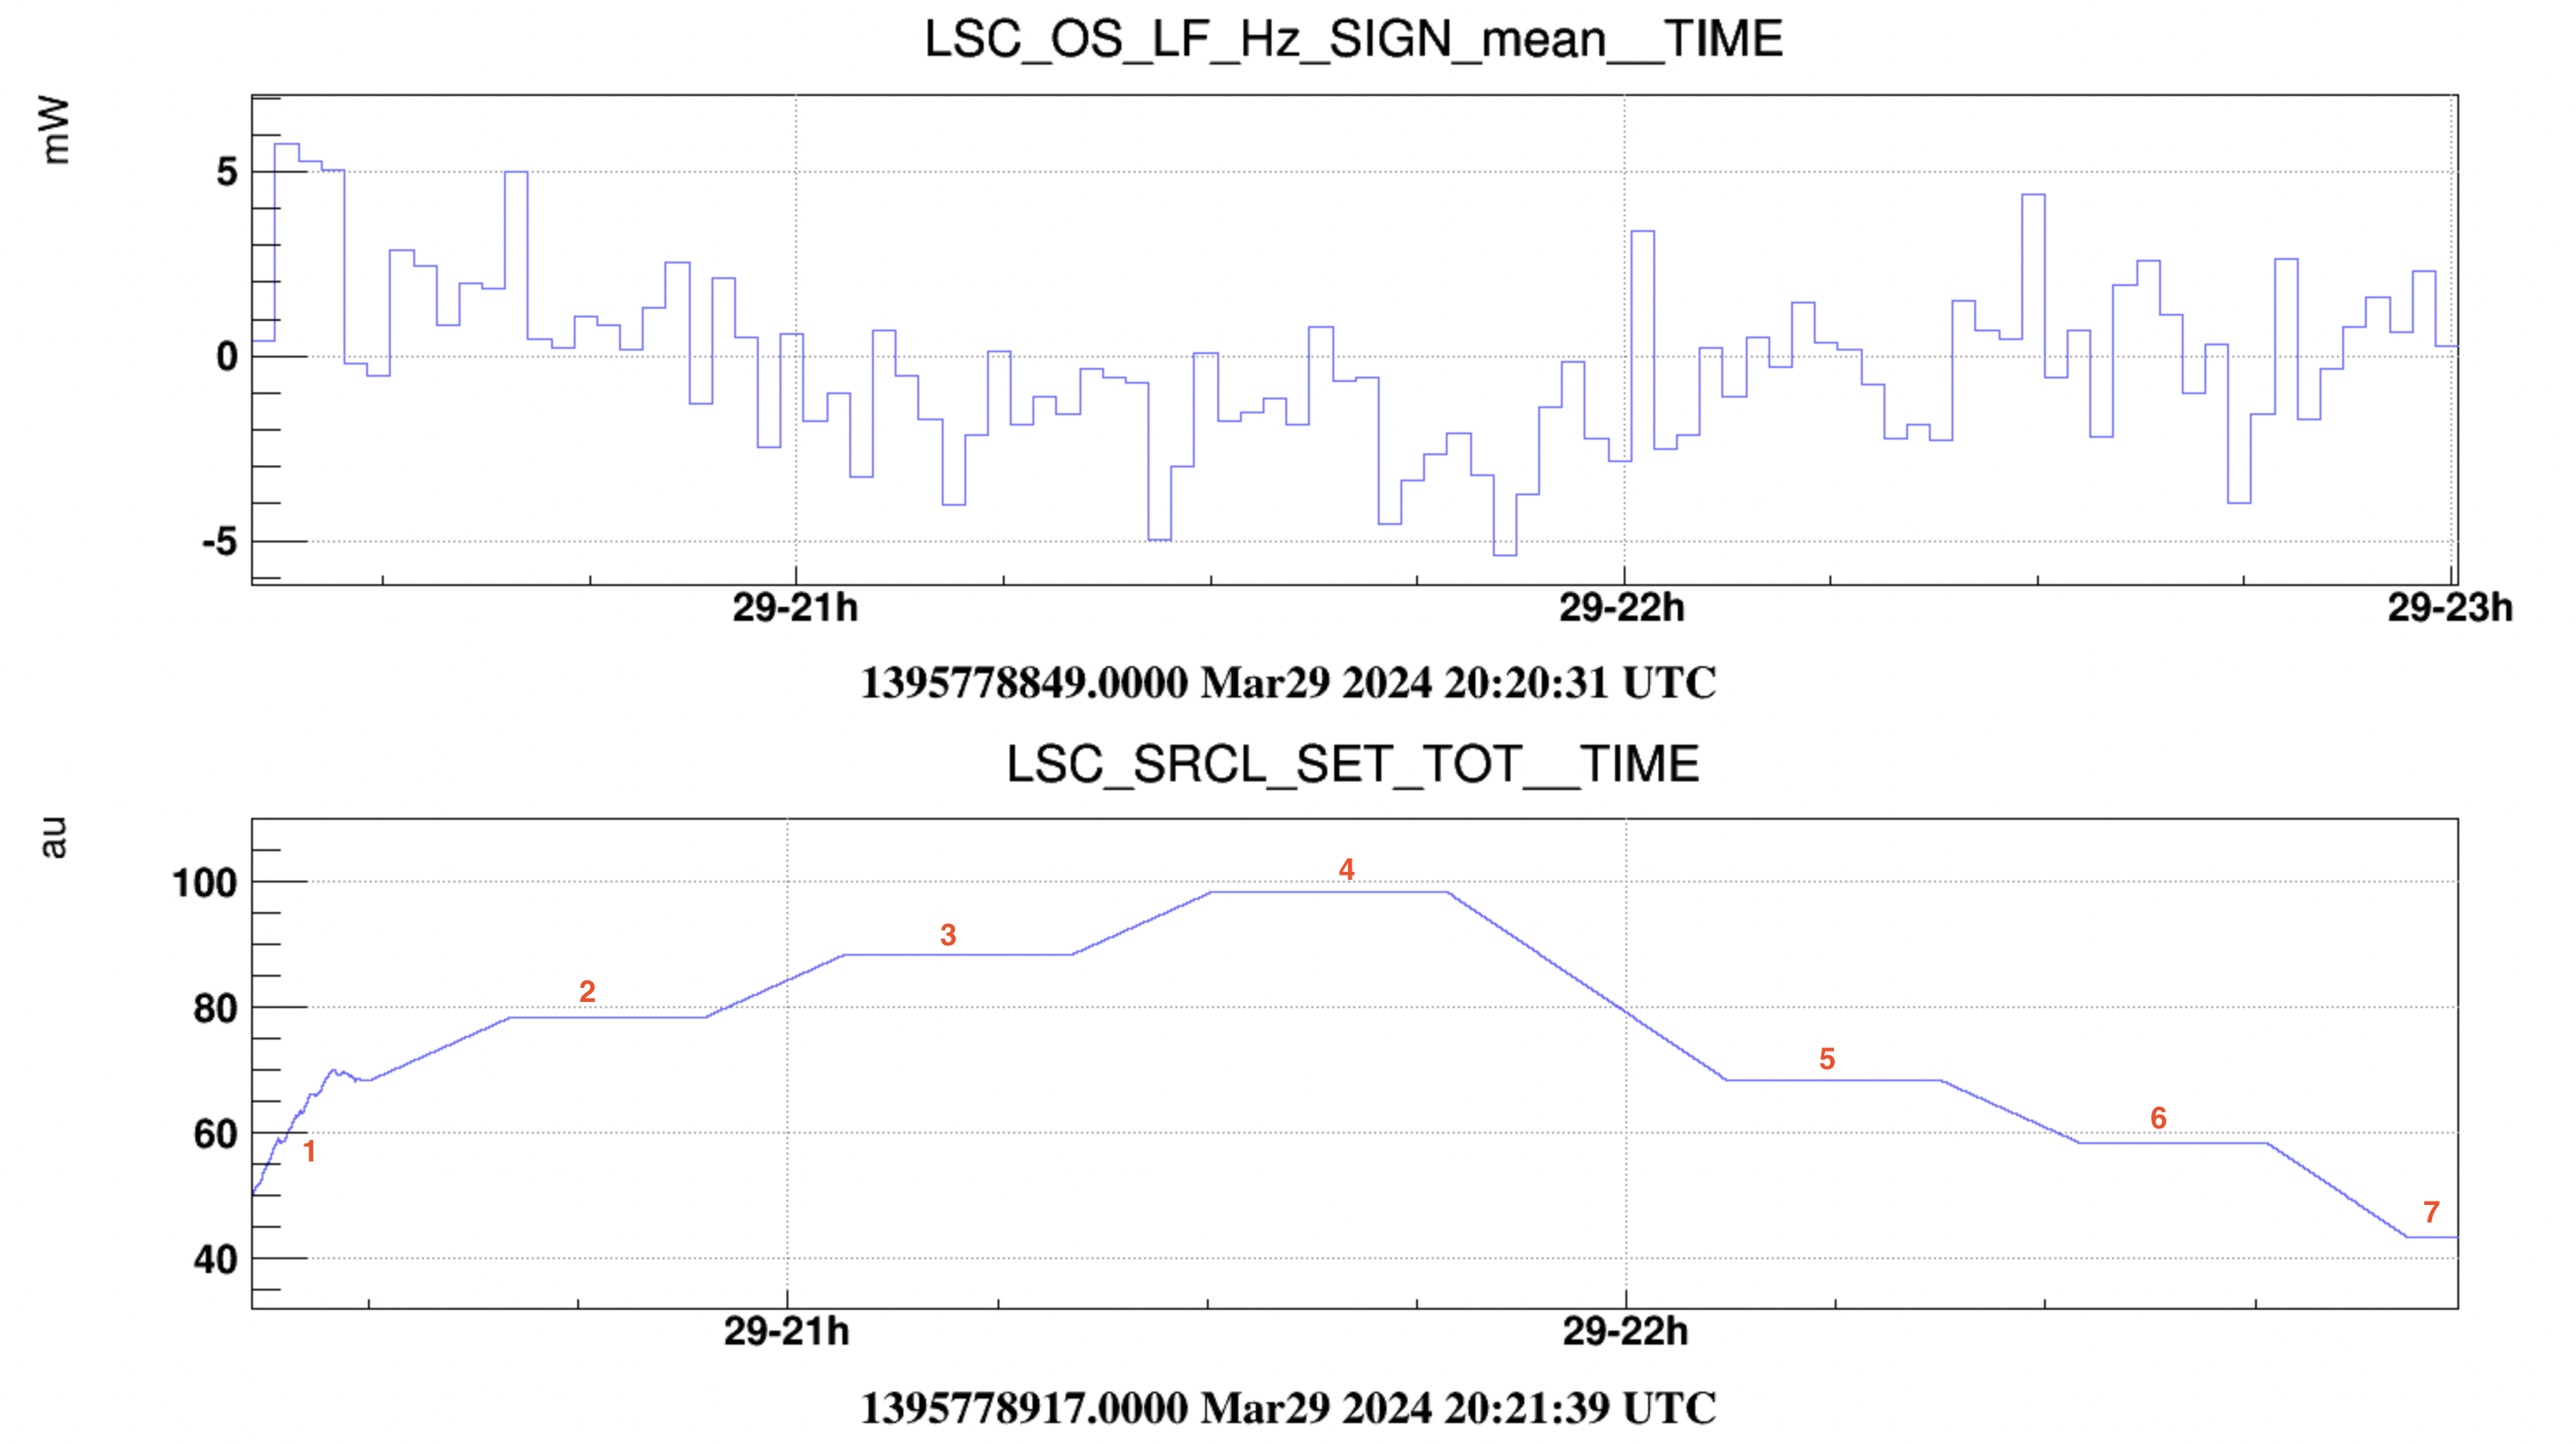
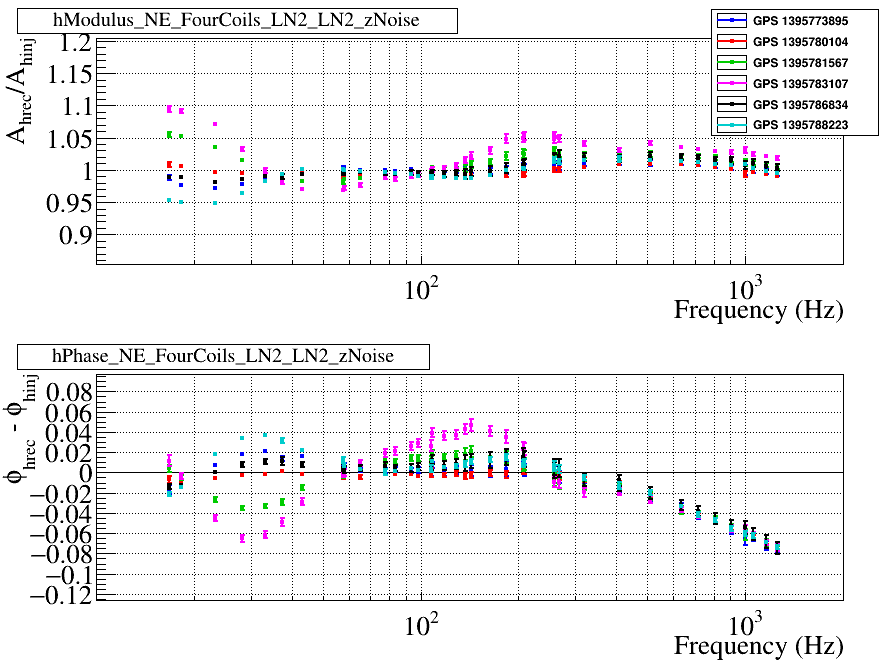
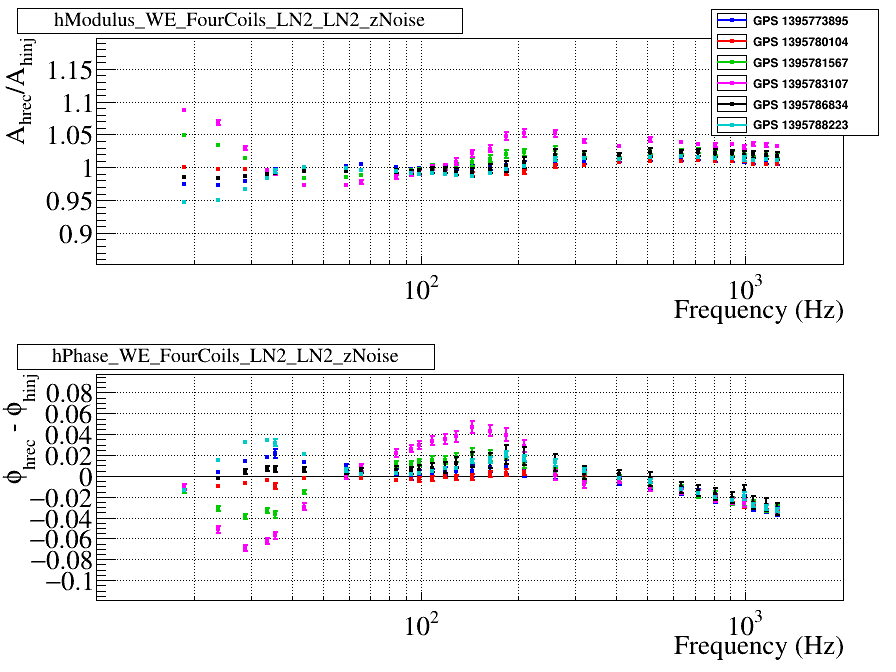
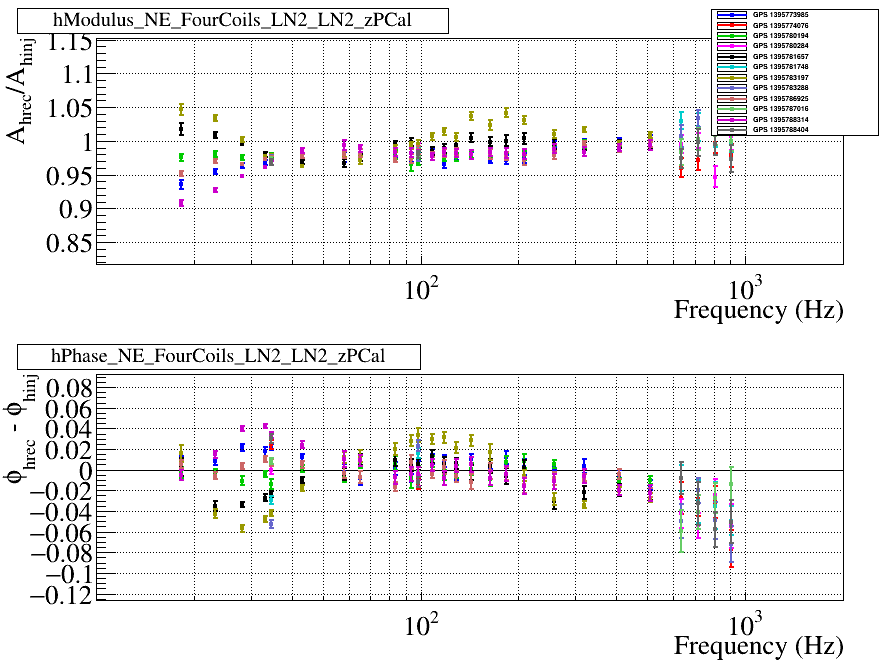
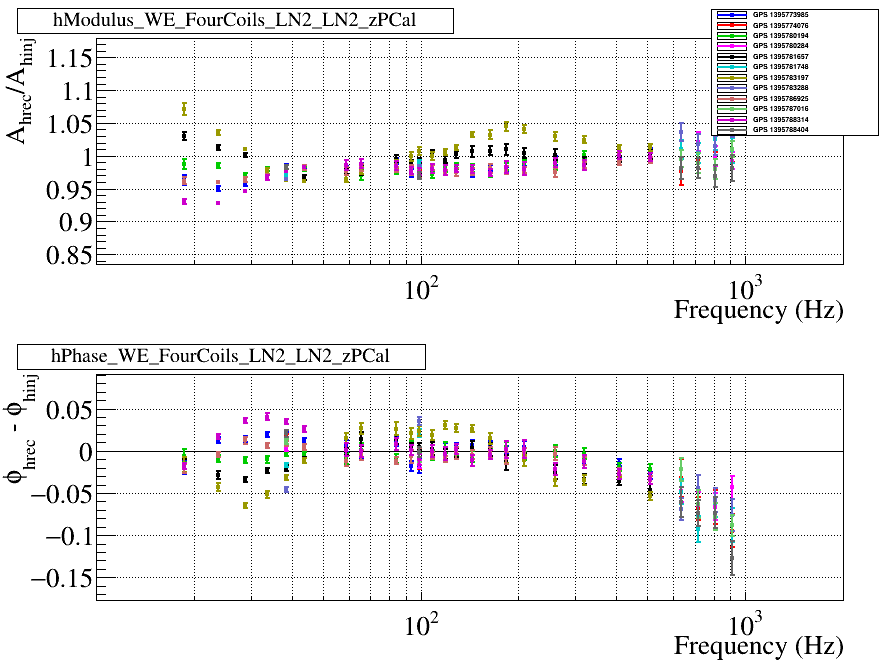
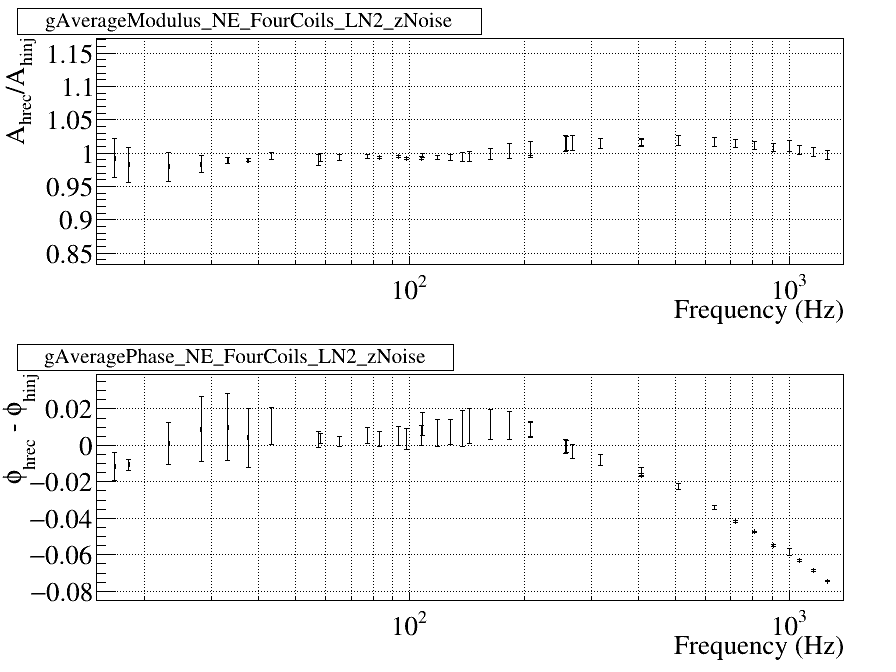
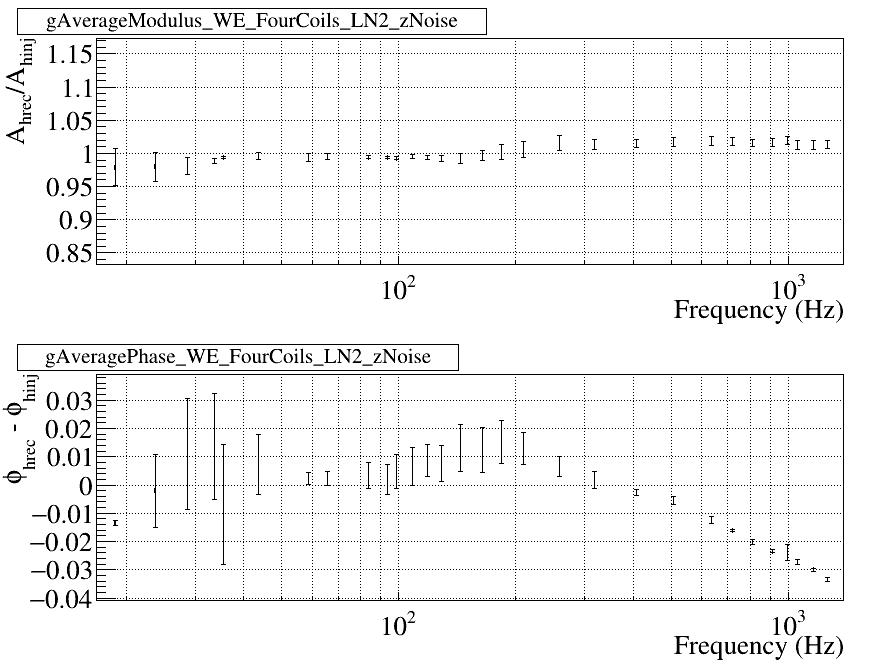
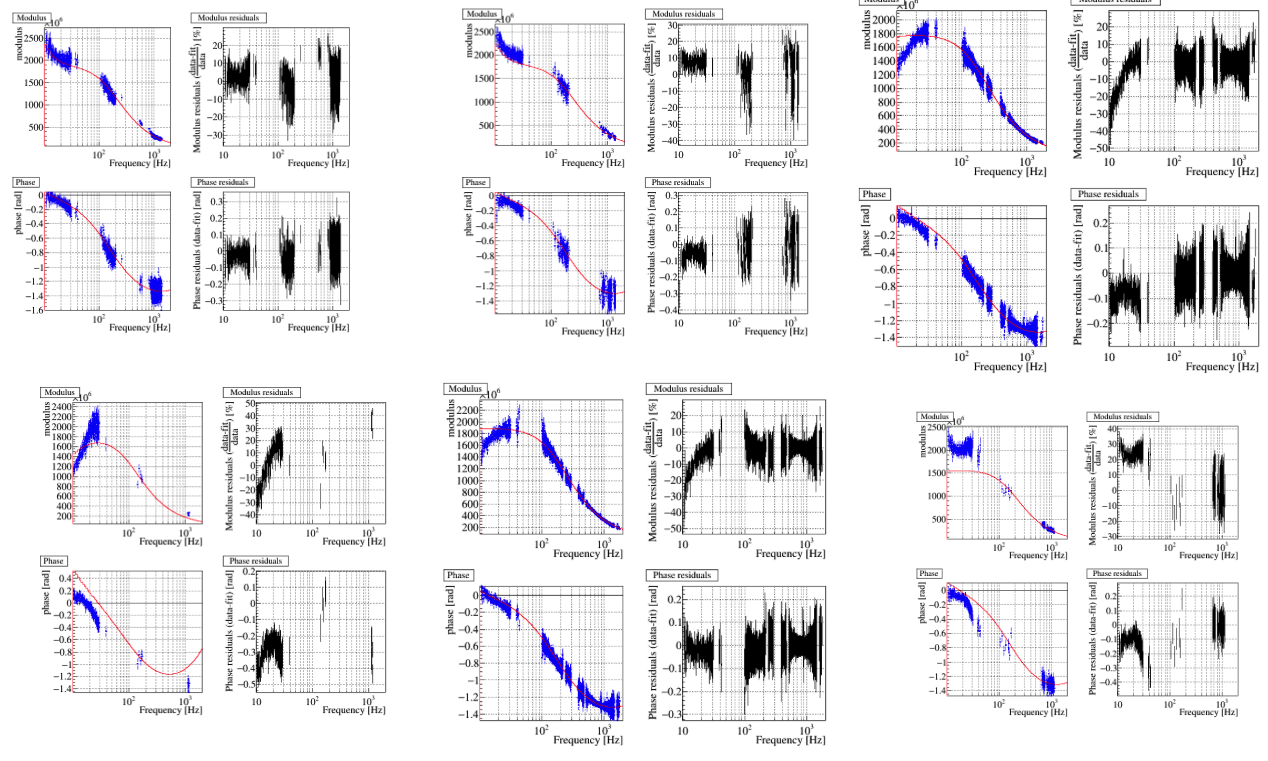
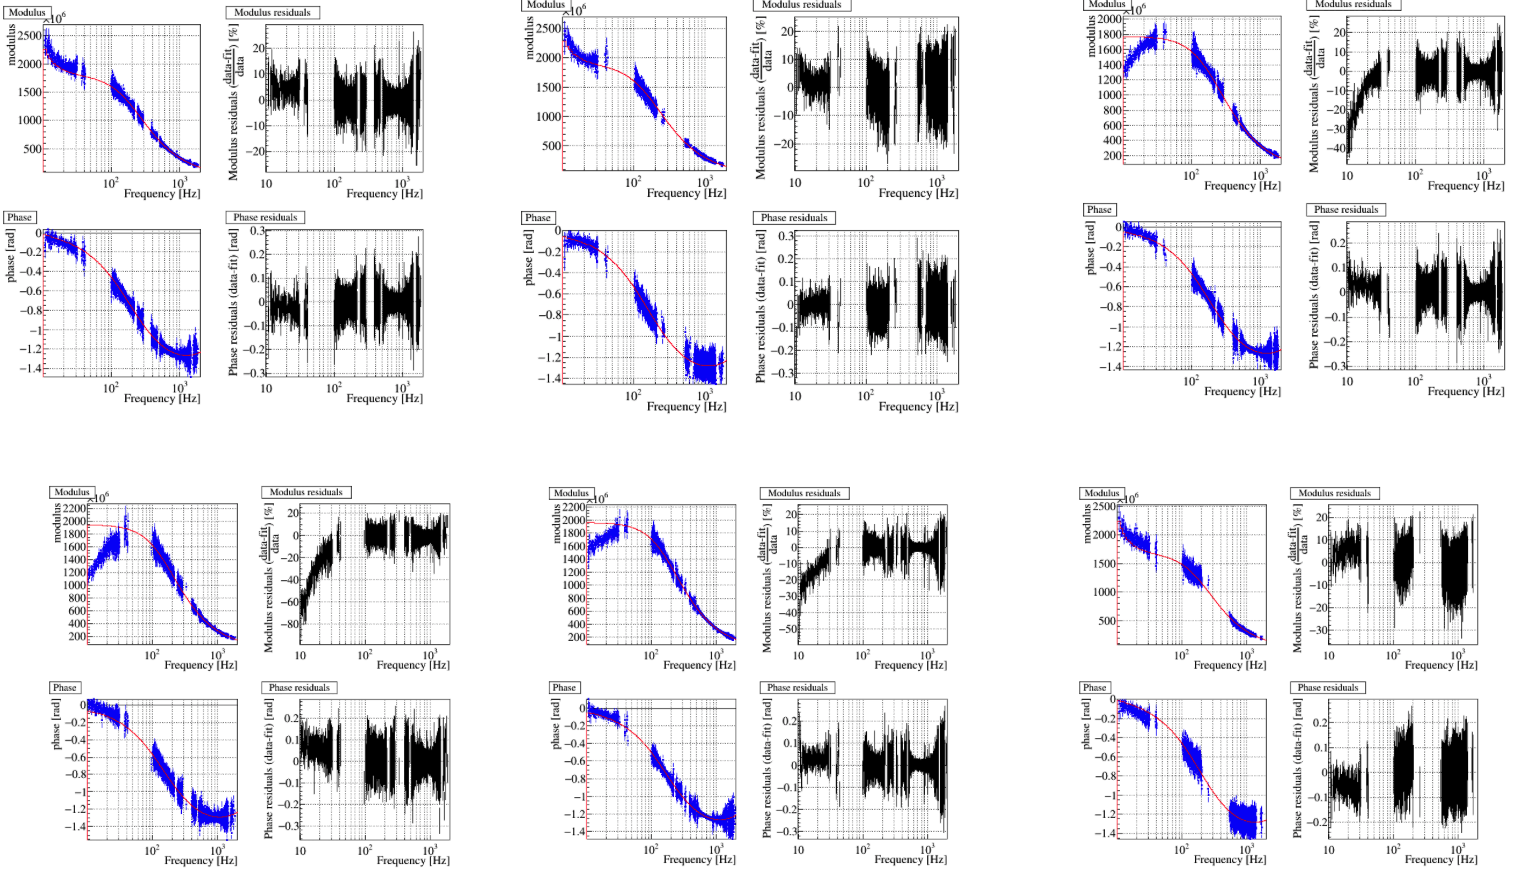
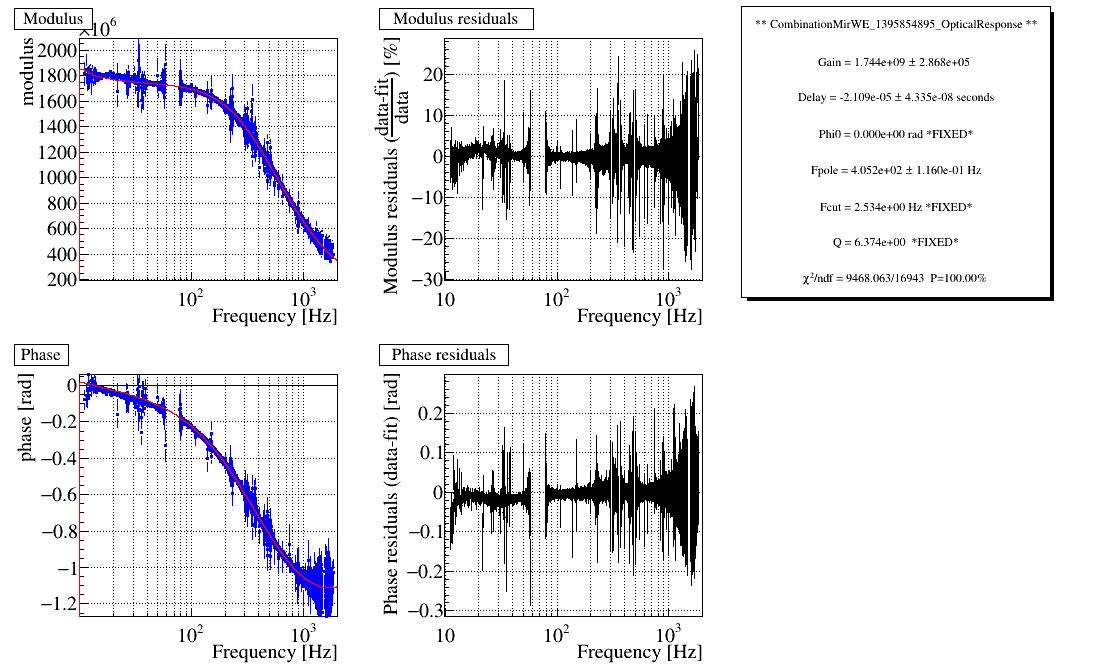
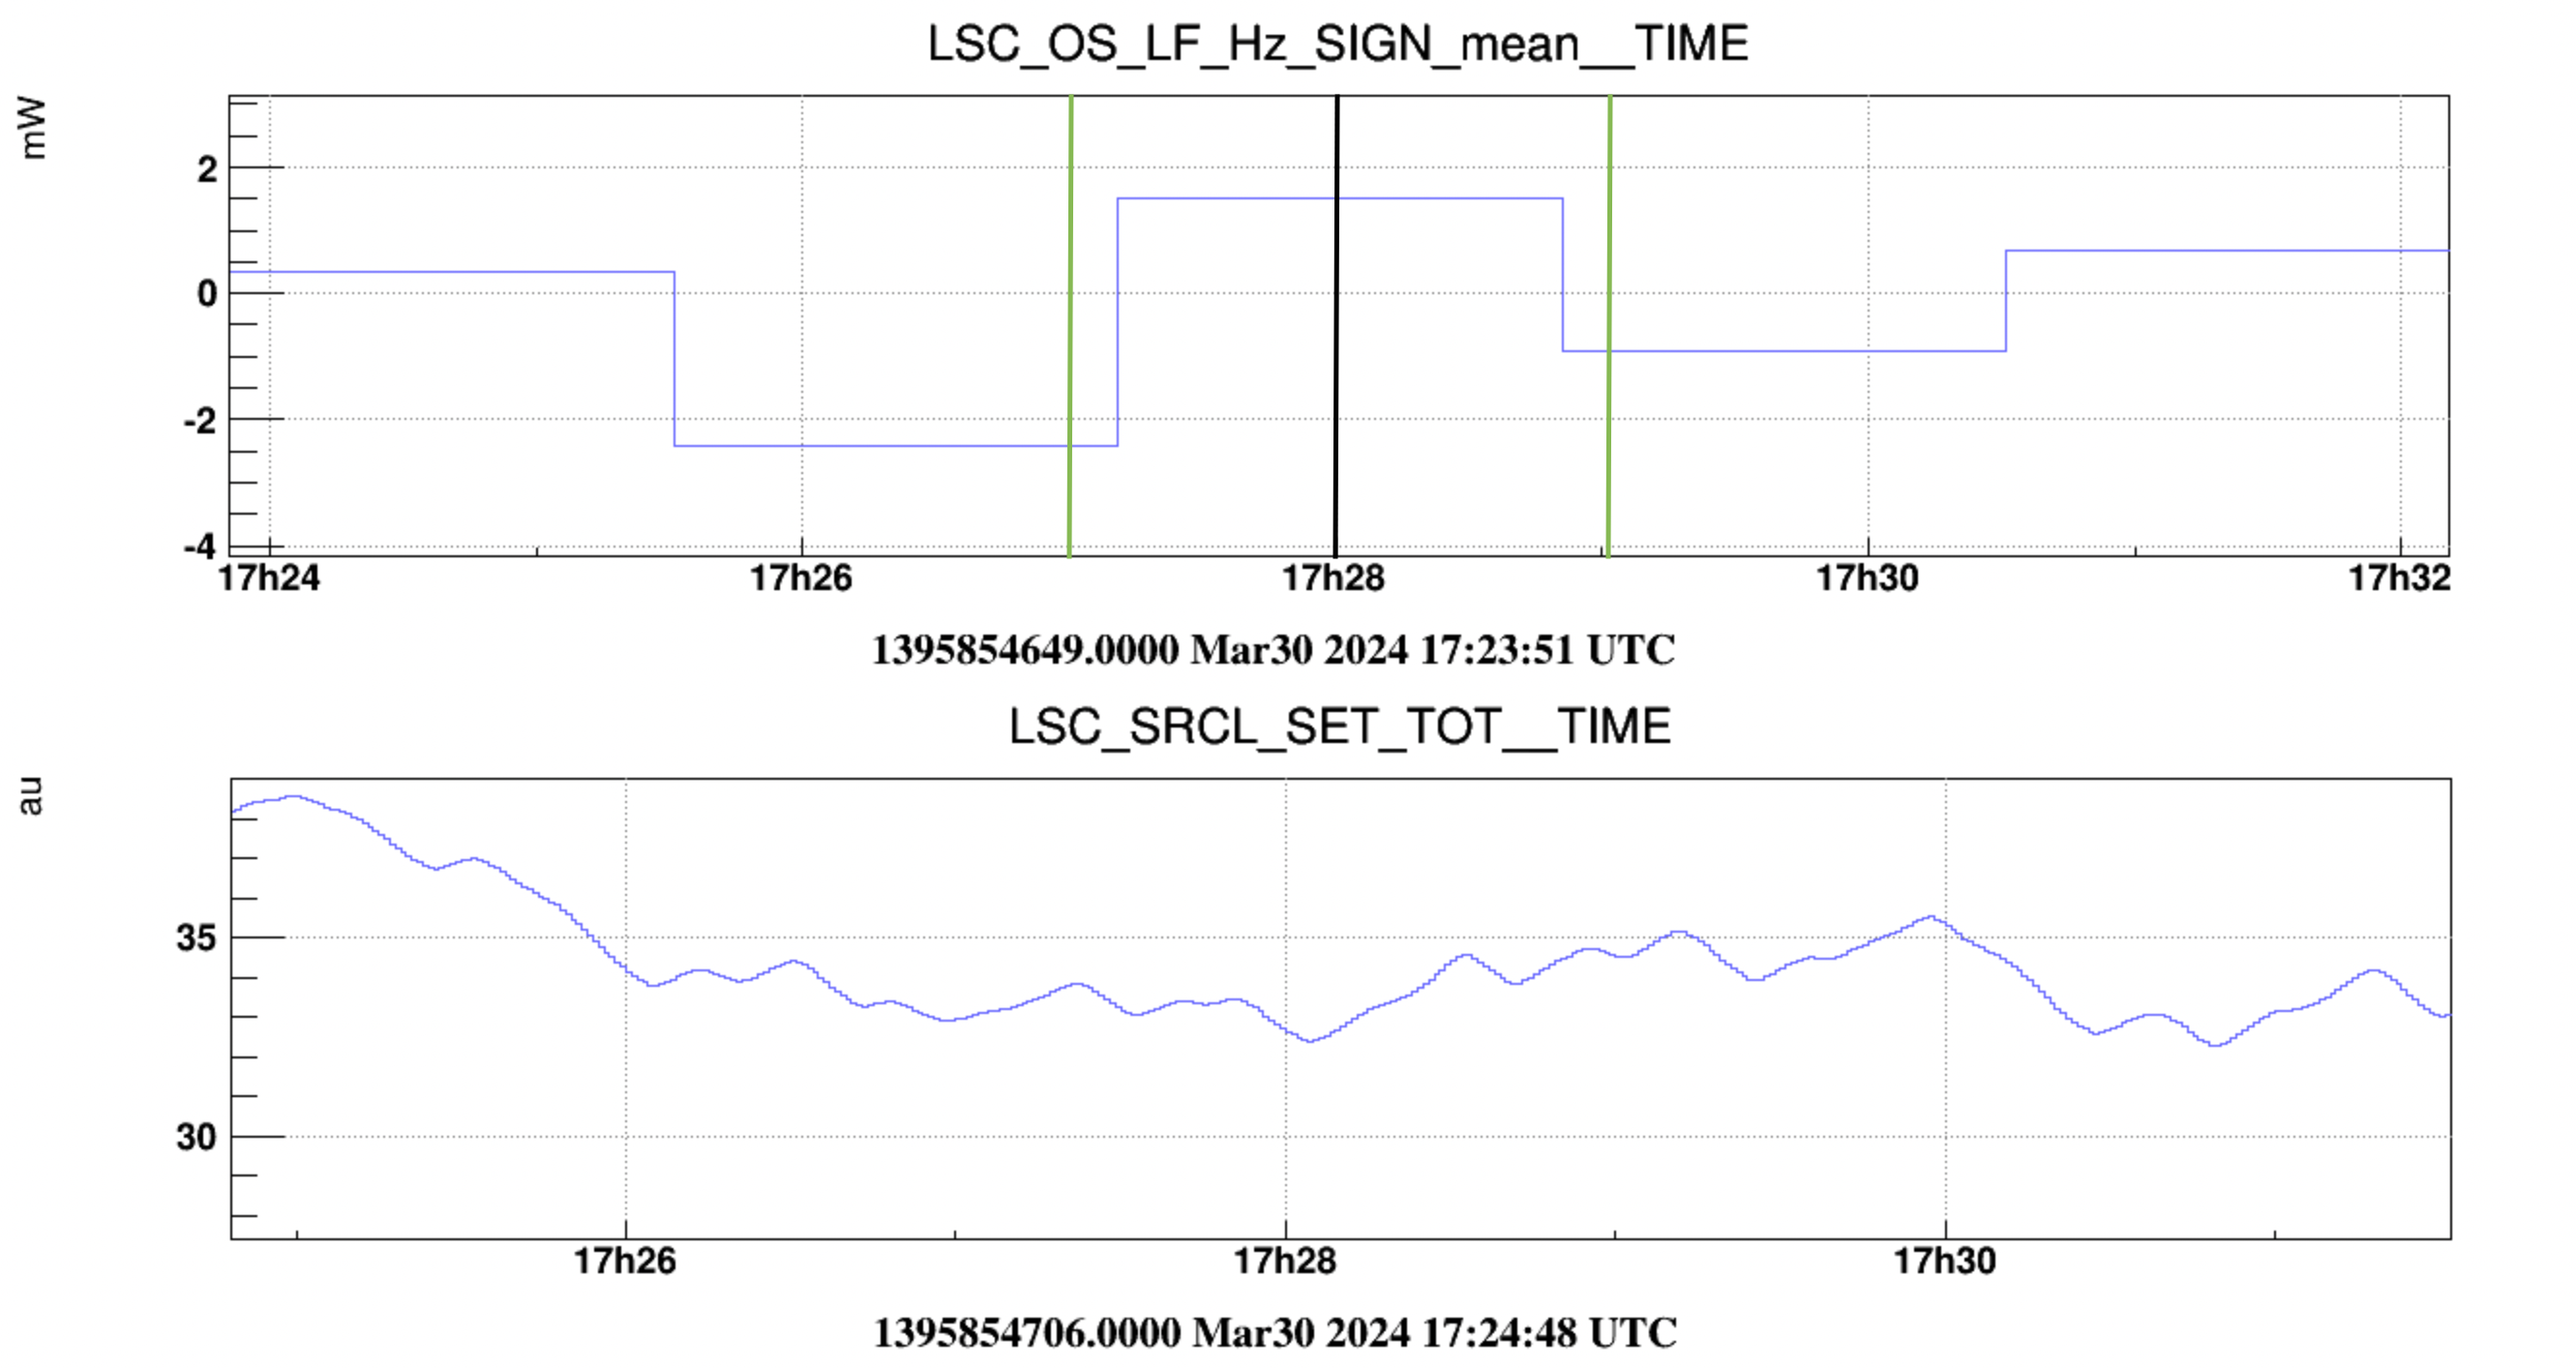
In these measurements, we did not find a flat response at low frequencies. Yet, the 30th (a day after), during daily calibration injections, we see a ~flat response for NE and WE (WE in Figure 12), for SRCL_SET_TOT~35 and OS_LF_HZ (first green line and black line used to computed the OR, Figure 13).
Note that these results use updated Pcal models, and EM actuators models not yet updated to the latest measurements (as these are currently under study).
