I've continued the analysis of the dataset of the omicron triggers for the annoying 25-minute glitches during the days of the mini-Engineering run. Differently to what I've done in logbook entry #62965, this time I've tried a brute force correlation of the glitches time series with all the "V1:*_mean", "V1:*_rms", "V1:*_TE*" channels in the trend frame (20,586 total). The glitches time series has been constructed as a " train of Dirac's delta," with a value of 1 at the GPS times corresponding to each glitch trigger, and zero otherwise. Regarding the the auxiliary channels, in addition to their time series, I've also considered the absolute value of their derivatives (one-point difference), and second derivatives. The latter transformations are meant to convert those channels that behave like square waves or sawtooth waves into trains of deltas.
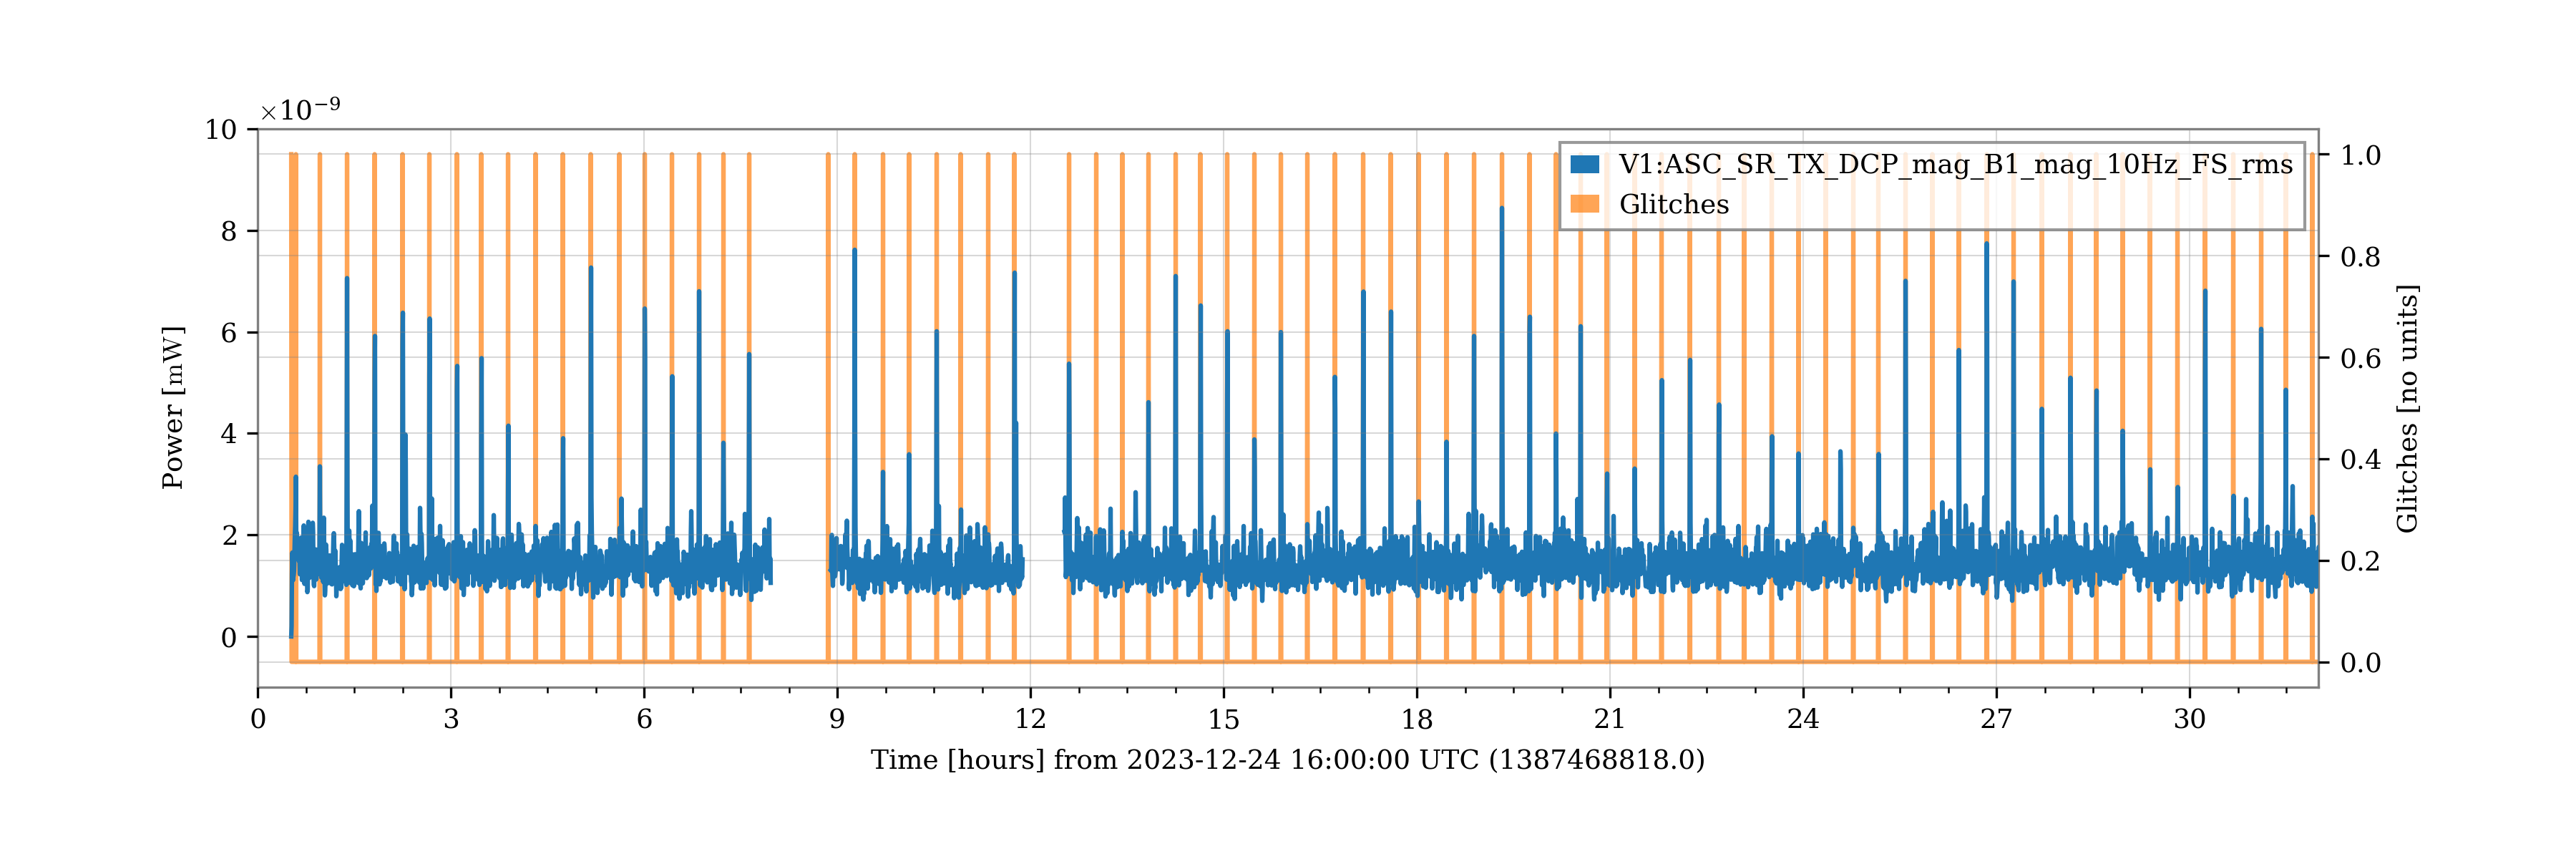
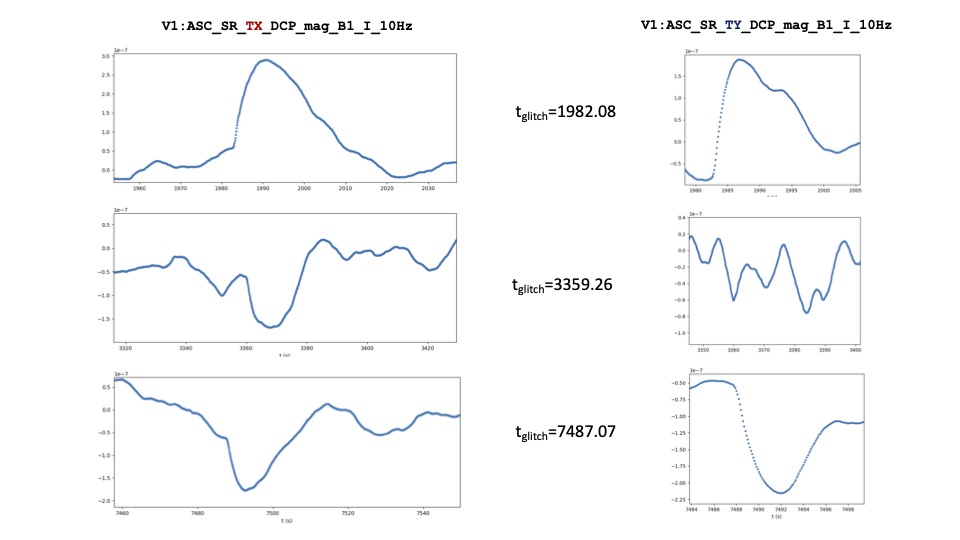
Among all the above, the only channels found correlated are those of the family: V1:ASC_SR_{TX,TY}_DCP_{phi,mag}_B1_*. The fact that they are correlated may mean that they are simply witnessing or reacting to the glitches, without telling anything new about their presence. However, they don't list among the BruCo excluded channels: /data/dev/detchar/online/bruco/share/virgo_excluded_channels_Hrec_hoft.txt.
I leave the floor to the expert to comment on this result.
Attached, the plots of some of these channels (blue) together with the glitches time series (orange). The time range is a zoom-in of the days of the 24 and 25 December just to better observe their correlations.


