This is building on top of the analytical calculation of the detuned SR DARM optical response. That shows that an analytical computation is able to explain the high frequency part of the DARM optical response in case of losses and SR detuning, but it is missing the optical spring effect due to radiation pressure. That analytical computation is 10 lines long and not realy usable as is for fitting for calibration. Fitting the result of that analytical computation with poles and zeros, one can notice that is composed of a single zero at ~400Hz, and complex pole. The zero depends on the losses, while the complex pole frequency and quality factor depends mostly on the SR detuning, with some dependence on losses.
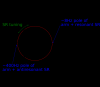
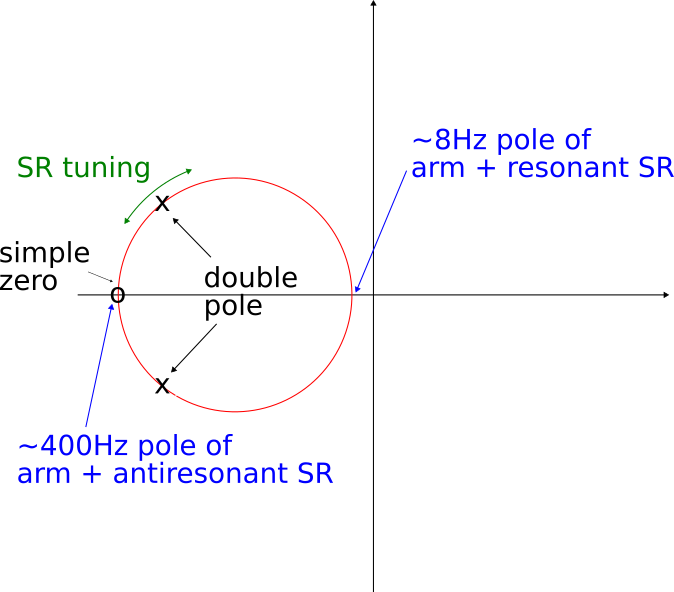
Figure 1 shows pictorialy the simplest parametric model I could come up with that makes some physical sense. The position of the single zero is fixed (on the real axis) and depends only on the SRC losses, it correspond also to the SR+arm cavity pole frequency when SR is tuned in the resonant sideband extraction configuration (carrier anti-resonant in the SR cavity which increases the arm cavity pole from ~50Hz to ~400Hz). The position of the complex pole travel along a circle (two complex points that need be complexe conjugate of each other). The left edge of the circle correspond to the SR+arm cavity pole in the resonant sideband extraction configuration (~400Hz), while the right edge of the circle correspond to the case where the carrier light is resonant in the SR cavity which would decrease the arm cavity pole to ~8Hz.
In this model SRC losses control the radius of the circle and the SR detuning the position of the poles along the circle. The zero is always located on the left most point on the circle along the real axis. To simplify things further, we can assume that the right point is fixed at 8Hz, and doesn't depend on the losses, as in any case we usually explore only the left side of the circle with SR close to being tuned for resonant sideband extraction.
The attached matlab code puts this into a very simple parametric expression depending on the frequency of the zero, and the phase along the circle. Two free parameters to be fitted by measurements in addition of an overall gain.
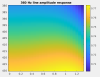
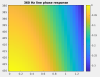
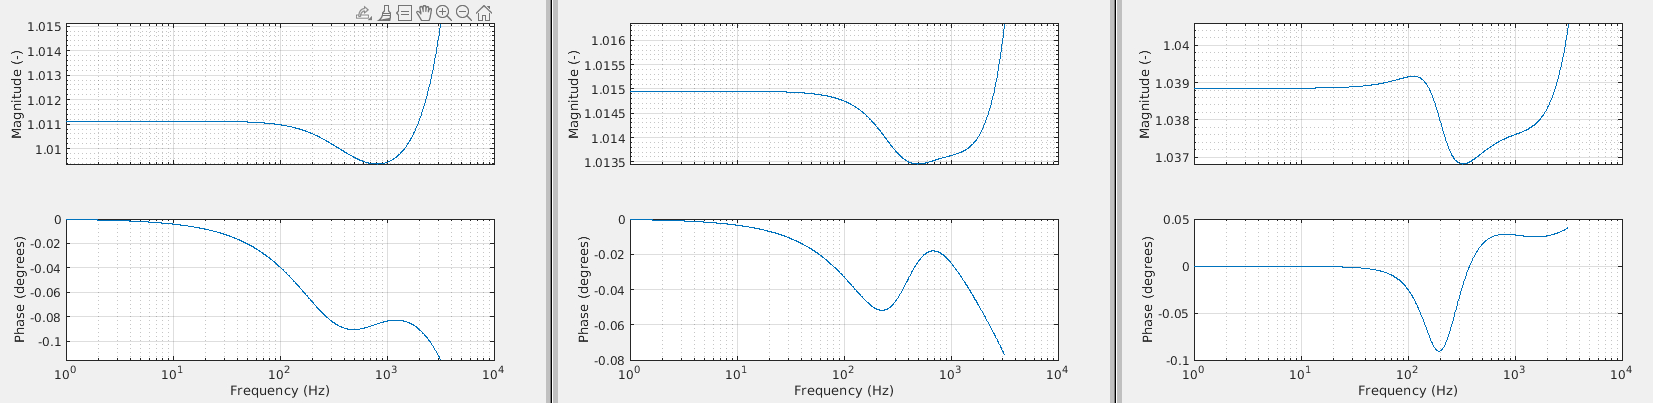
Figure 2 shows that this parametric model works quite well. It is the ratio between the analytical computation and a fitted by hand parametric model. The difference in amplitude is less than 0.5% and in phase less than 0.1 degree, even though the fitting was done by changing parameters by hand until the ratio is good.
The three cases shown in figure correspond to
- 0nm SR detuning, 3% SRC losses that was fitted with the left edge of the circle at 400.5Hz and the phase on the circle of 0 rad
- 15nm SR detuning, 3% SRC losses that was fitted with the left edge of the circle at 400.5Hz and the phase on the circle of pi*92.7/256 rad
- 40nm SR detuning, 3% SRC losses that was fitted with the left edge of the circle at 400.5Hz and the phase on the circle of pi*170.5/256 rad
So it covers all the detunings we could reasonably want to try out, and adding to it a resonant pole at low frequency for the optical spring would give a complete model of the DARM optical response when both SRC losses and SR detuning is present.
I expect I am reinventing the wheel here, and if someone would be able to point me to a reference where these relation are derived properly I would be grateful.

