Reports 1-1 of 1 Clear search Modify search
AdV-DAQ (Calibration)
grimaud, lagabbe, verkindt, rolland - 23:36 Thursday 01 June 2023 (60411) Print this report
Calibration shift 01/06/2023

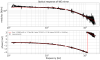
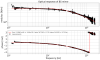
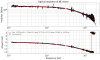
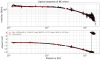
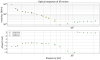
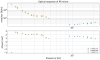
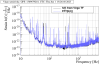
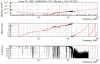
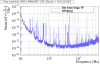
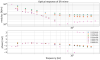
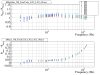
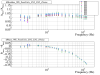
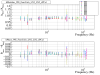
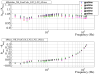
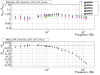
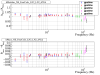
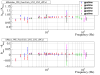
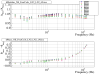
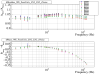
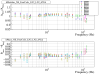
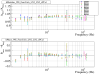
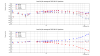
1) Measurement of the transfer fonction between CAL_*_Z_CORR and Sc_*_Z_CORR channels for all mirrors and all marionettes

  • While the ITF is in down state
  • 15h18 UTC :  asking metatron for CALIBRATED_DELAY state, to perform measurement of the transfer fonction between CAL_*_Z_CORR and Sc_*_Z_CORR channels for all mirrors and all marionettes

Looking at the measurements we still see an additionnal delay of 50 μs between CAL_{WE,PR}_MIR_Z_CORR and Sc_{WE,PR}_MIR_Z_CORR and 25 μs between CAL_NE_MIR_Z_CORR and Sc_NE_MIR_Z_CORR

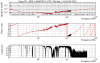
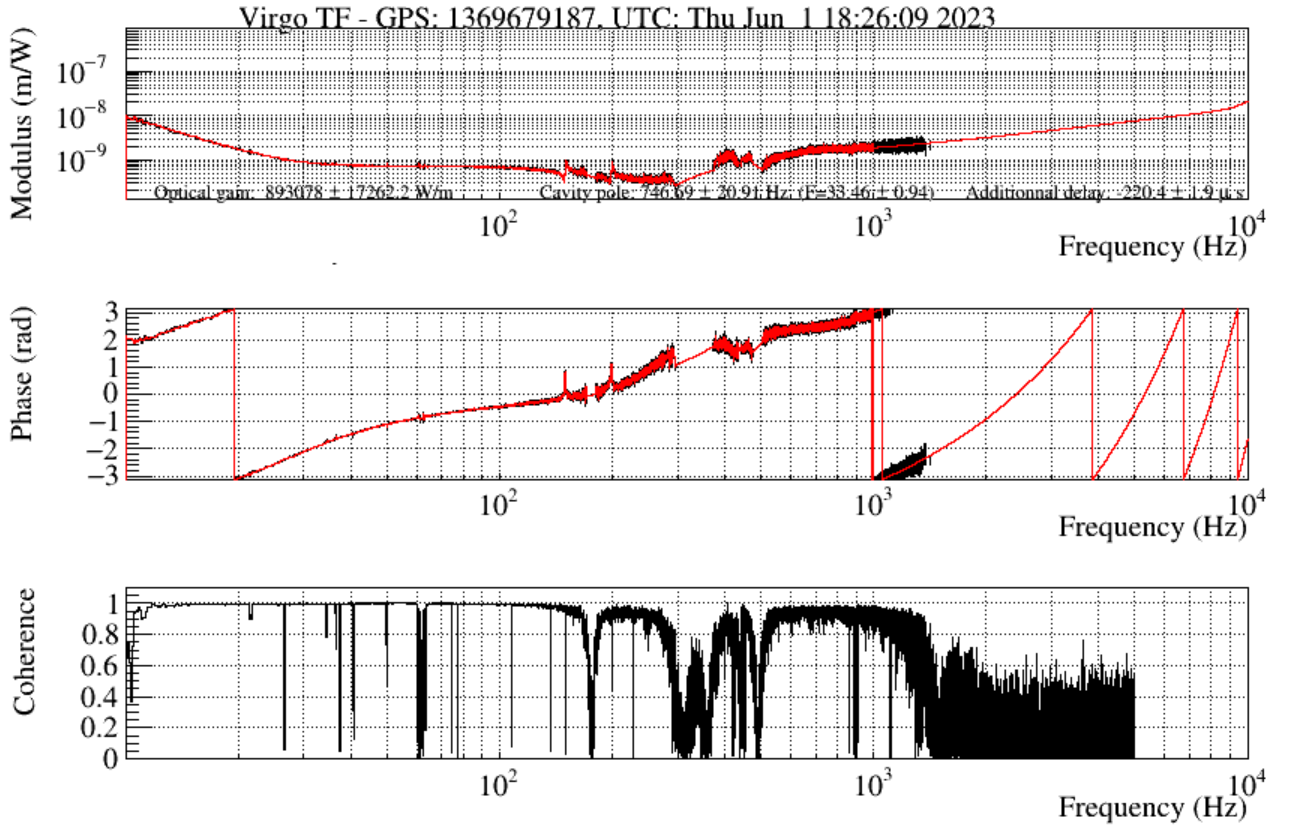
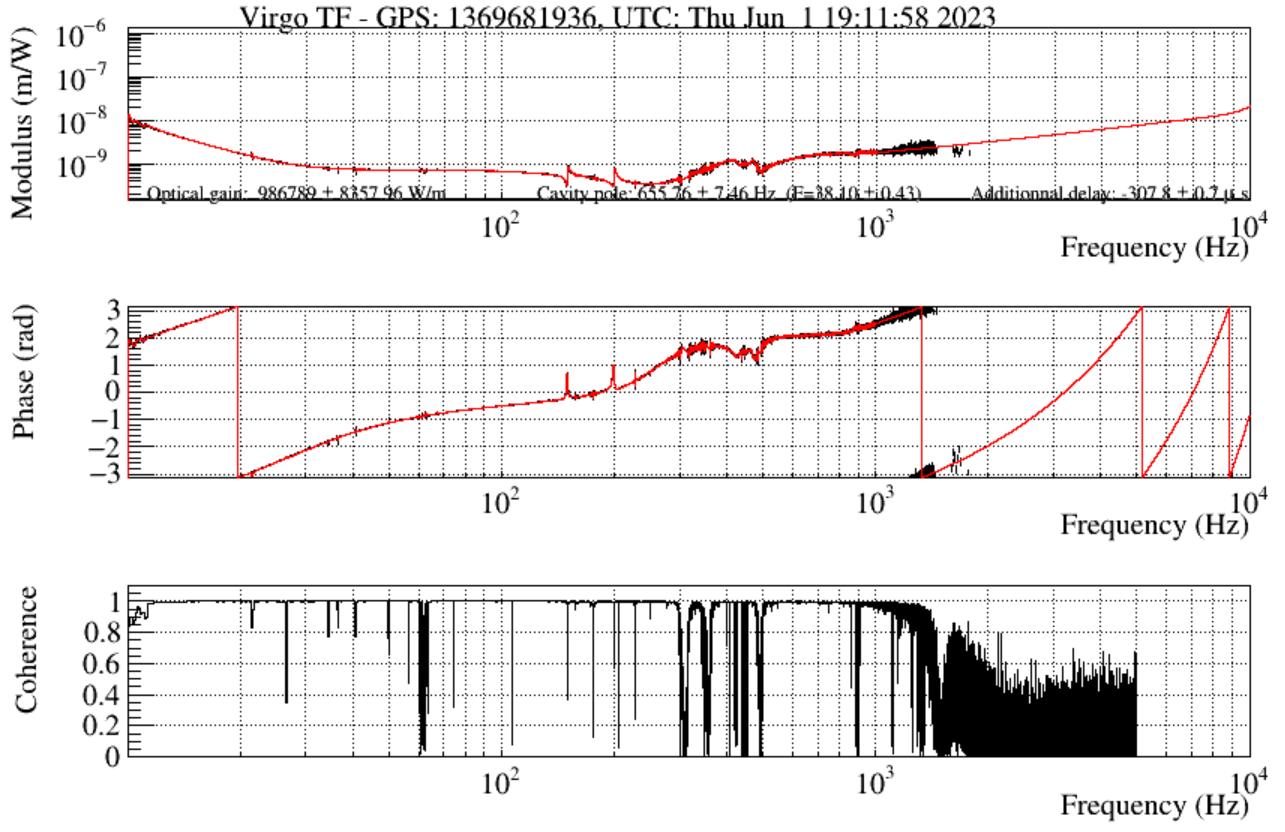
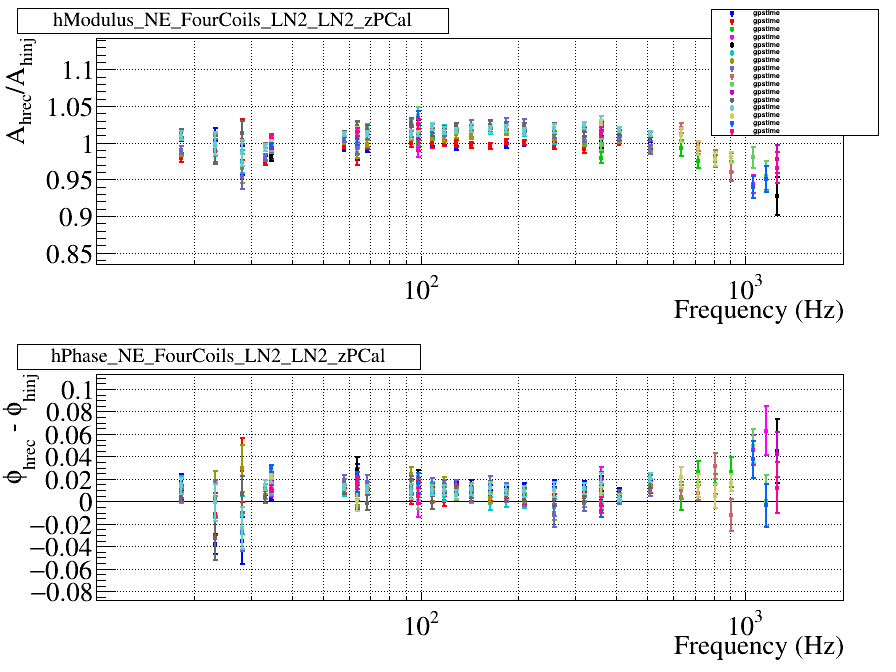
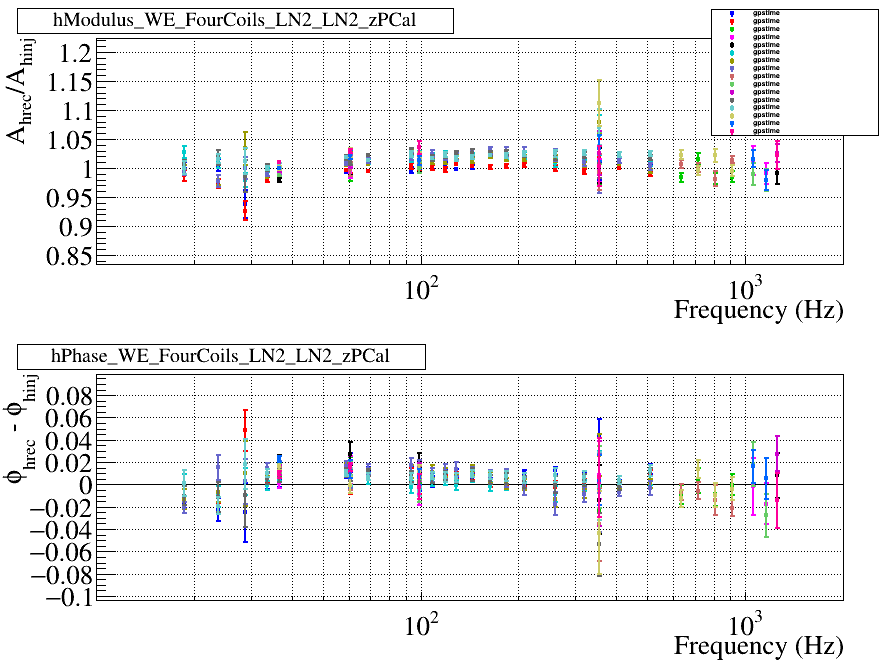
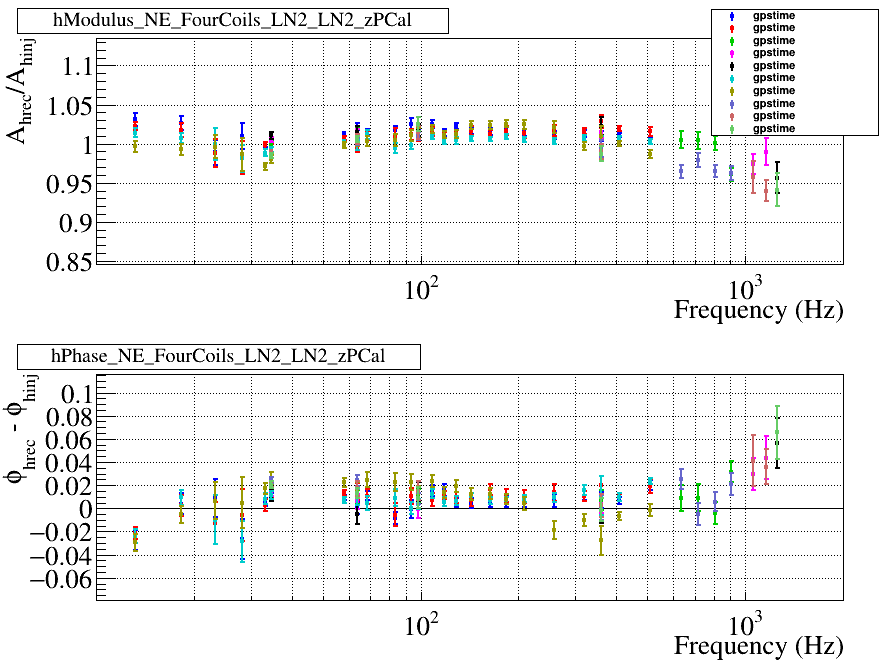
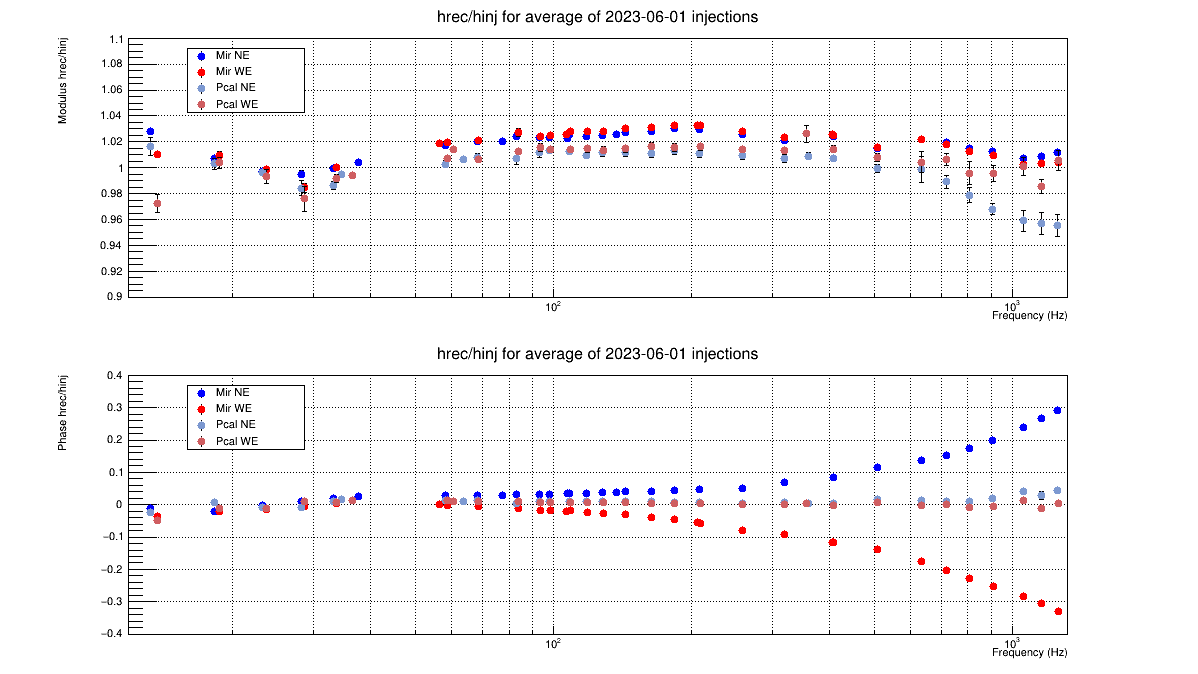
2) CheckHrec measurements

  • 16h40 : ITF in LN2

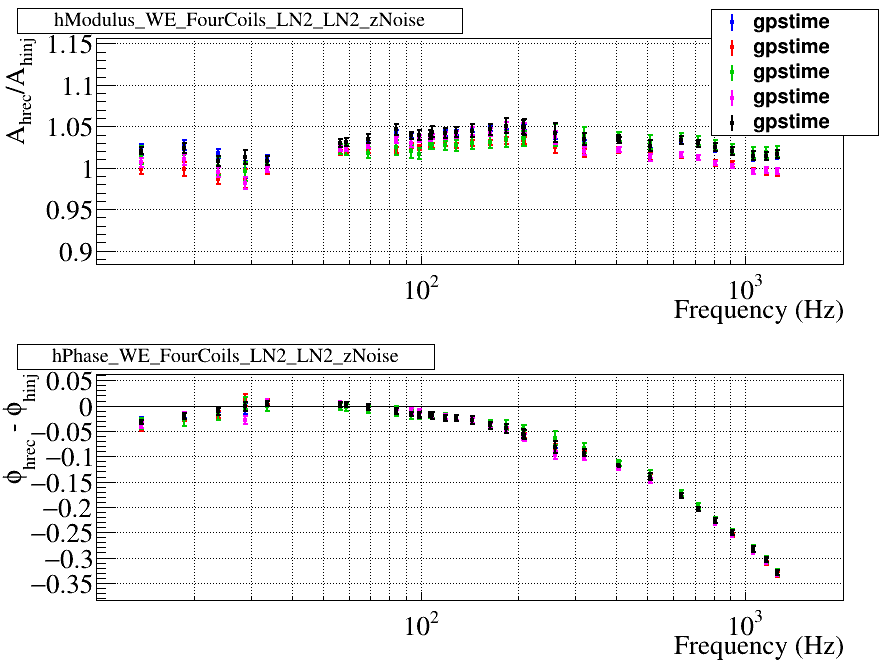
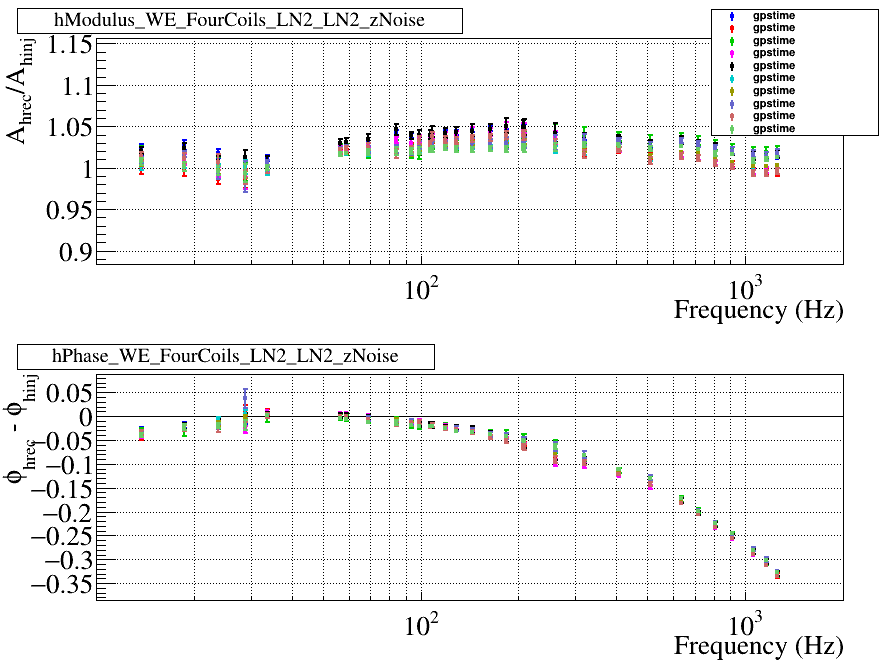
CheckHrec injection without the 80 Hz line

  • 16h53 : 5 CheckHrec injections on WE and NE MIR from 10Hz to 1300 Hz
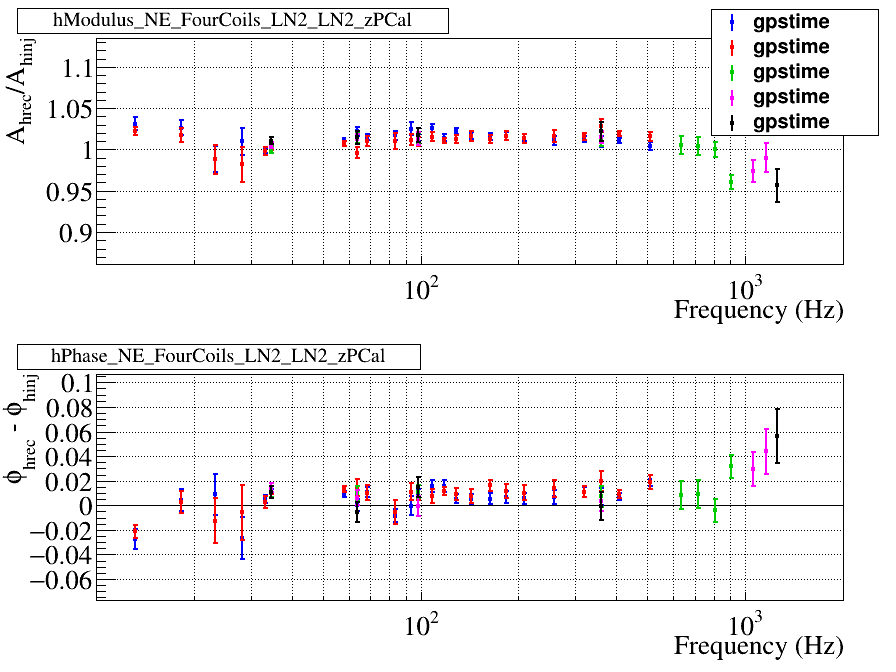
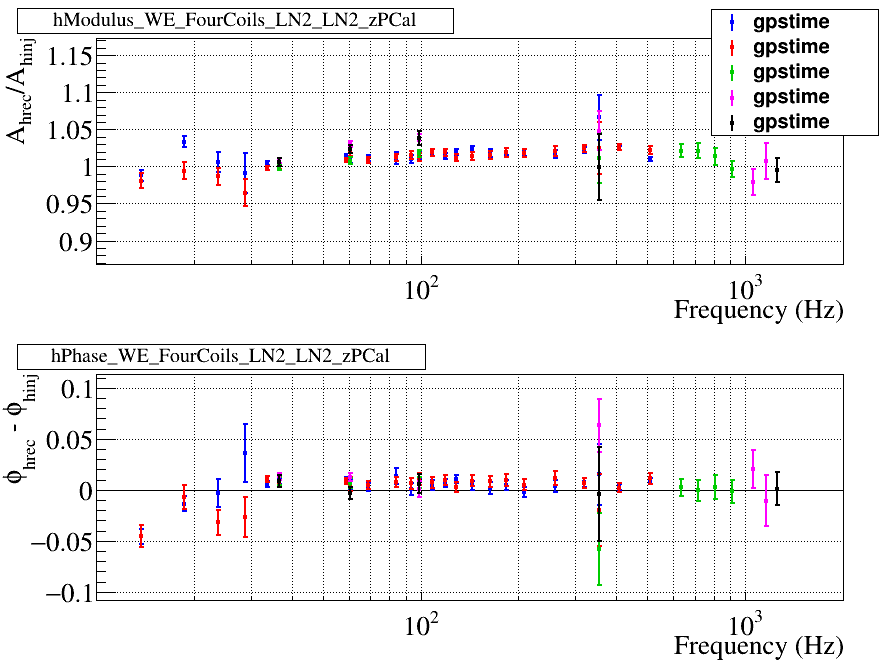
  • 17h03 : 5 CheckHrec injections on WE and NE PCAL from10Hz to 1300 Hz  with 2 from 10Hz to 600 Hz, 1 from 600Hz to 1000Hz and 1 from 1000Hz to 1300Hz
  • 17h15 : 1 CheckHrec injection on WE and NE PCAL to check if the injection are done correctly 

Note : the sensitivity seemed a bit high during the first CheckHrec set of injections, maybe because we didn't wait enough after acquiring LN2 to start injecting lines.

  • 17h17 : 5 CheckHrec injections on WE and NE MIR from 10Hz to 1300 Hz
  • 17h27  : 5 CheckHrec injections on WE and NE PCAL from10Hz to 1300 Hz  : 2 from 10Hz to 600 Hz, 1 from 600Hz to 1000Hz, 1 from 1000Hz to 1200Hz and 1 from 1200Hz to 1300Hz
  • 17h38 : 5 CheckHrec injections on WE and NE MIR from 10Hz to 1300 Hz
  • 17h48  : 5 CheckHrec injections on WE and NE PCAL from10Hz to 1300 Hz  : 2 from 10Hz to 600 Hz, 1 from 600Hz to 1000Hz, 1 from 1000Hz to 1200Hz and 1 from 1200Hz to 1300Hz

CheckHrec injection with the 80 Hz line and with the 10 Hz line

  • 18h02 : 5 CheckHrec injections on WE and NE MIR from 10Hz to 1300 Hz
  • 18h12  : 5 CheckHrec injections on WE and NE PCAL from10Hz to 1300 Hz  with 2 from 10Hz to 600 Hz, 1 from 600Hz to 1000Hz, 1 from 1000Hz to 1200Hz and from 1200Hz to 1300Hz

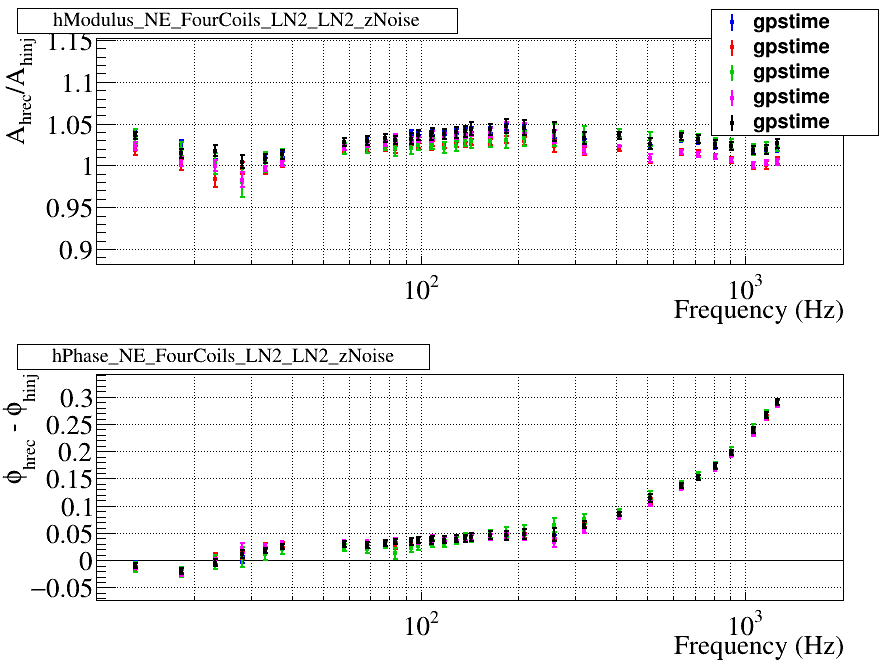
Trying CheckHrec injection after sensitivity injection

CheckHrec injection are still with additionnal lines at 10Hz and 80 Hz

  • 18h24 : Noise injection with inject_sensitivity
  • 18h32 :  5 CheckHrec injections on WE and NE MIR from 10Hz to 1300 Hz
  • 18h42  : 5 CheckHrec injections on WE and NE PCAL from10Hz to 1300 Hz  with 2 from 10Hz to 600 Hz, 1 from 600Hz to 1000Hz, 1 from 1000Hz to 1200Hz and from 1200Hz to 1300Hz


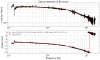
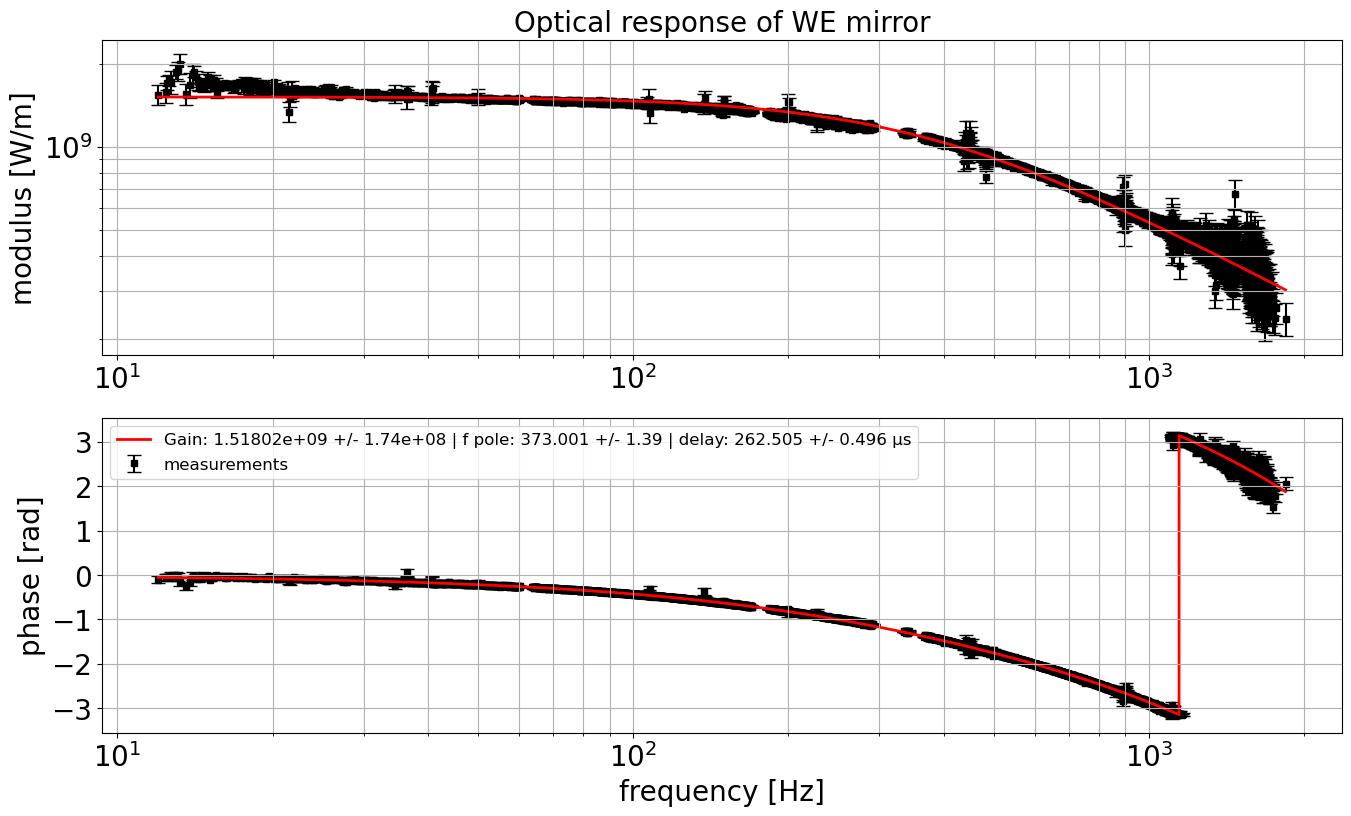
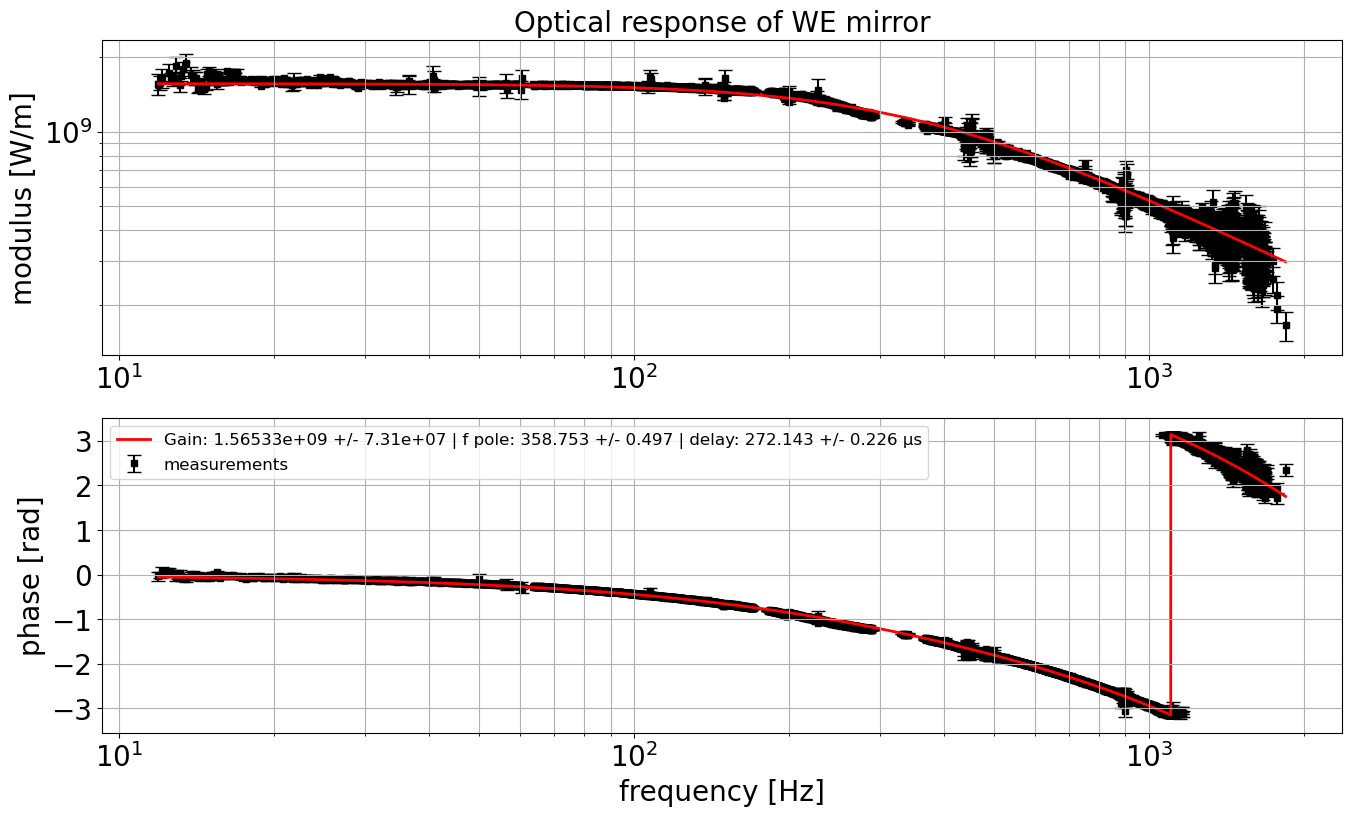
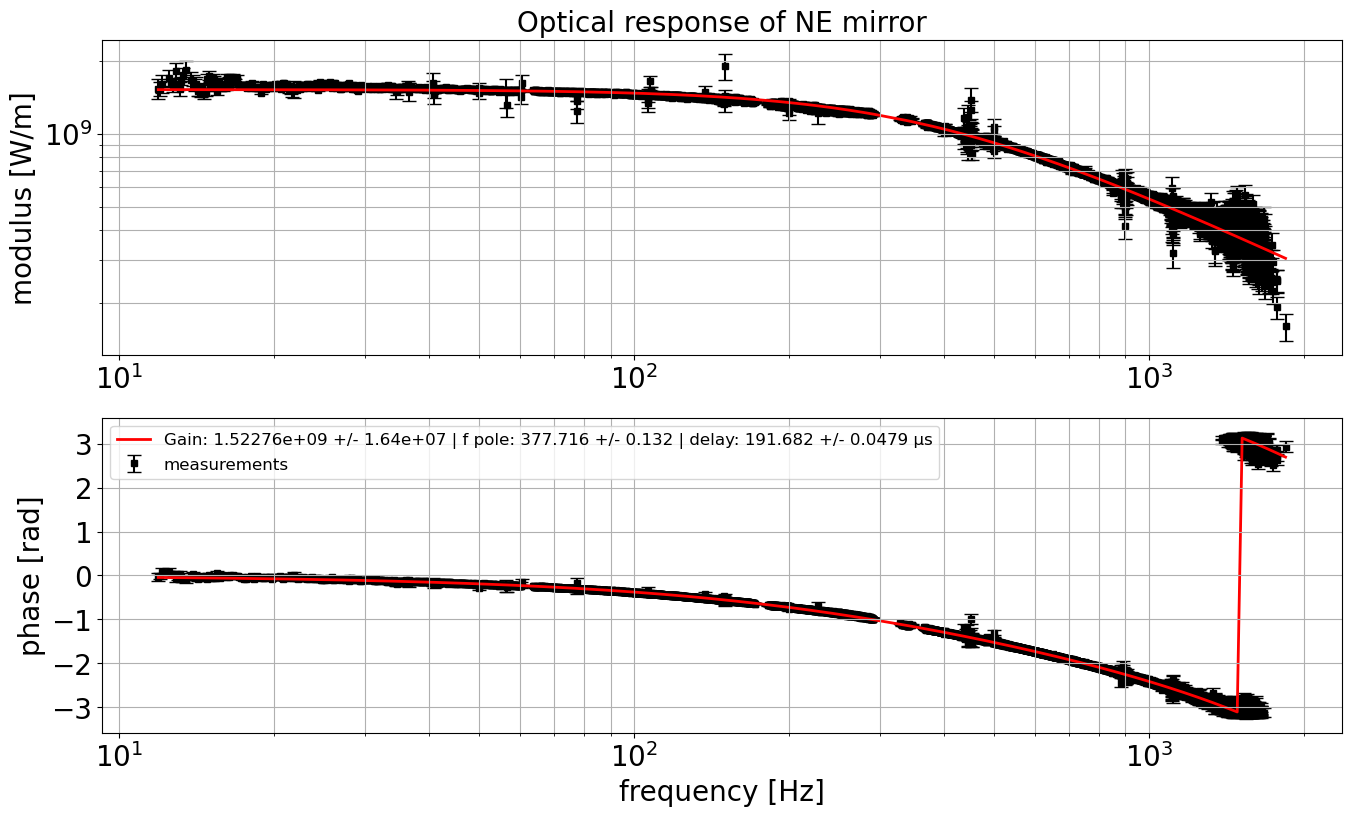
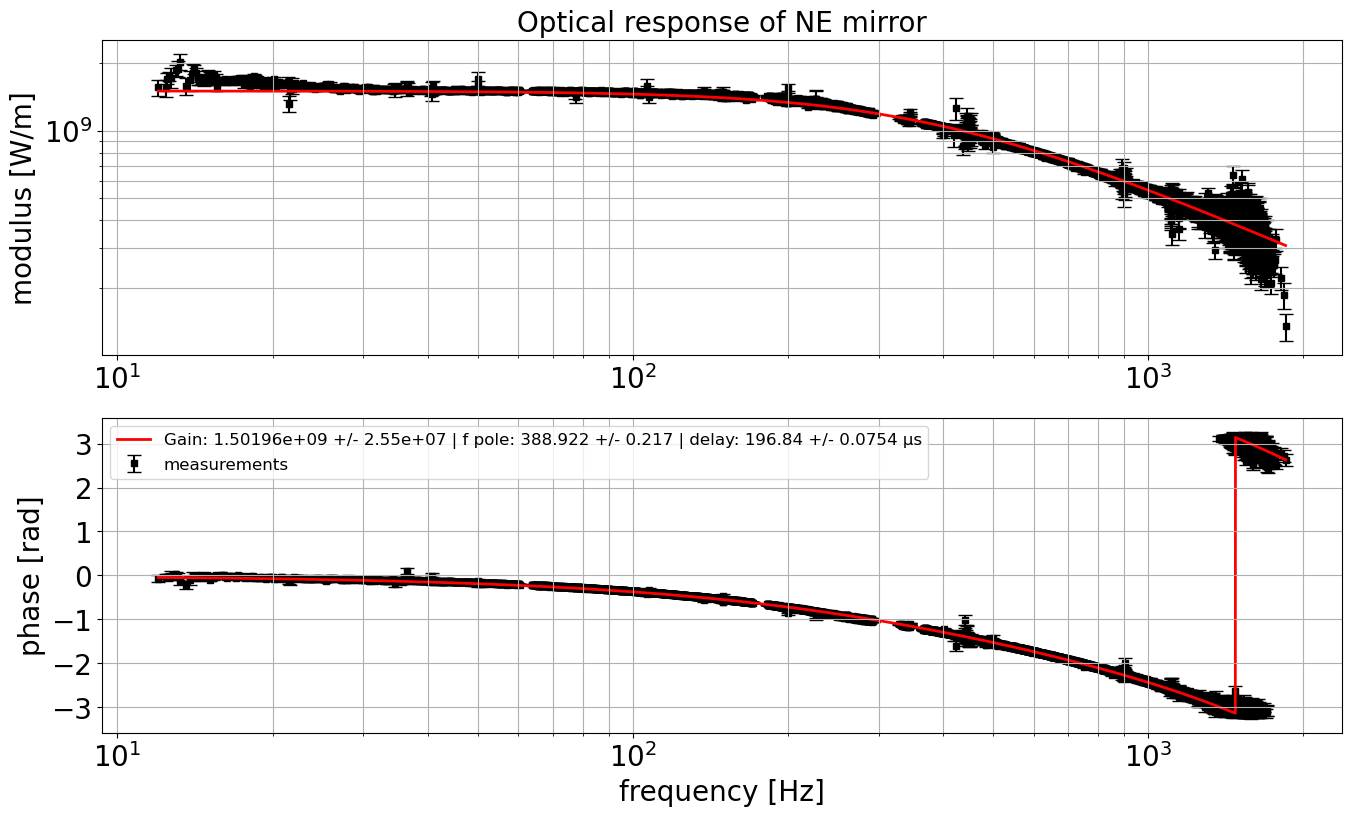
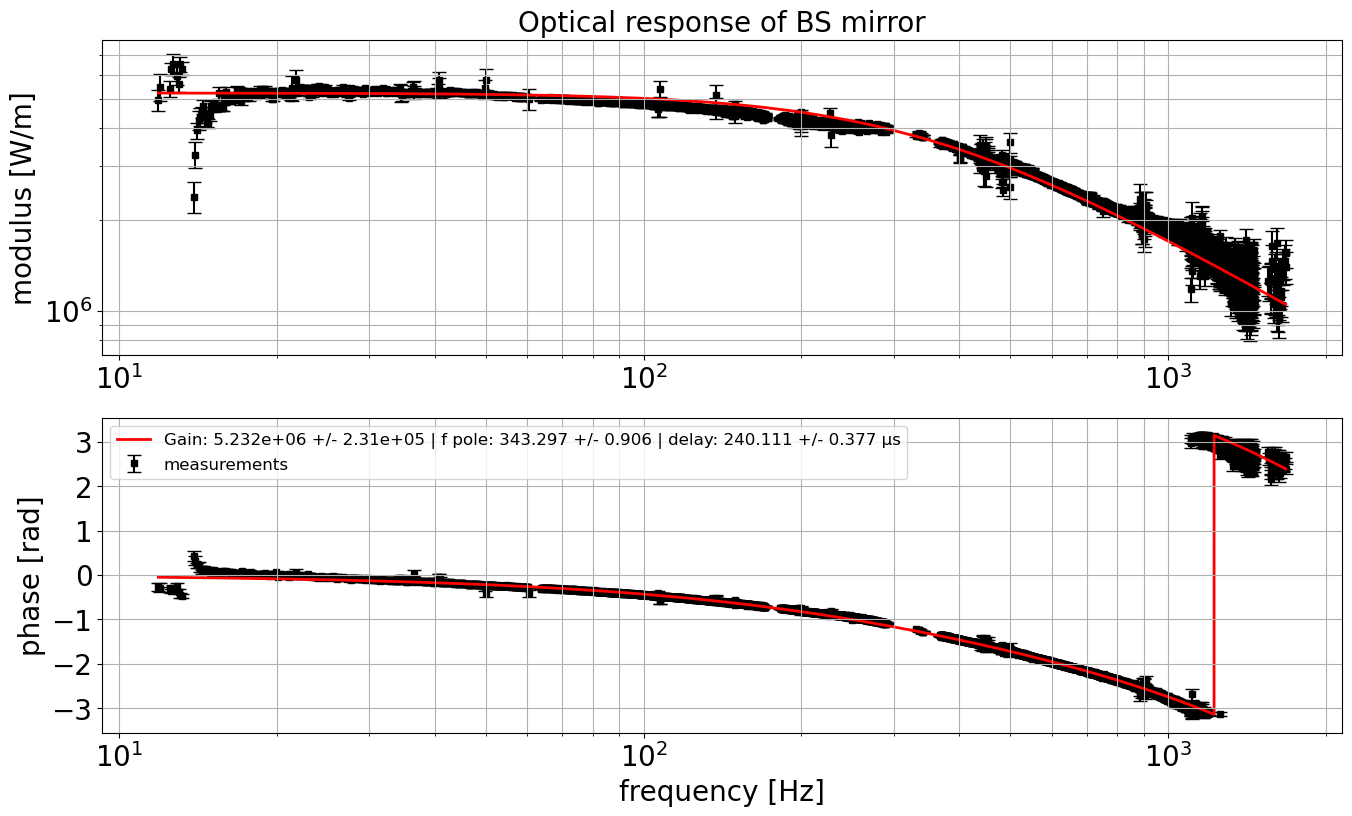
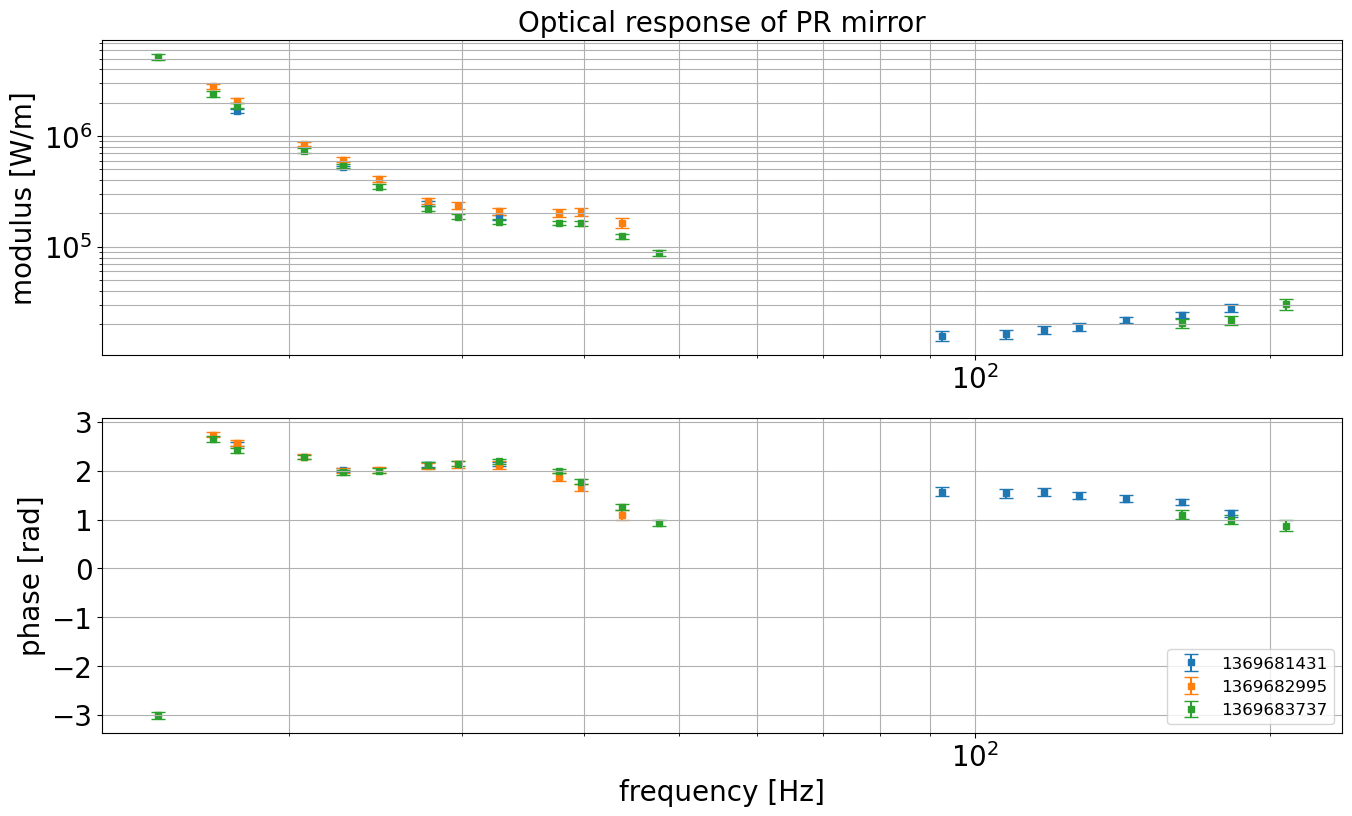
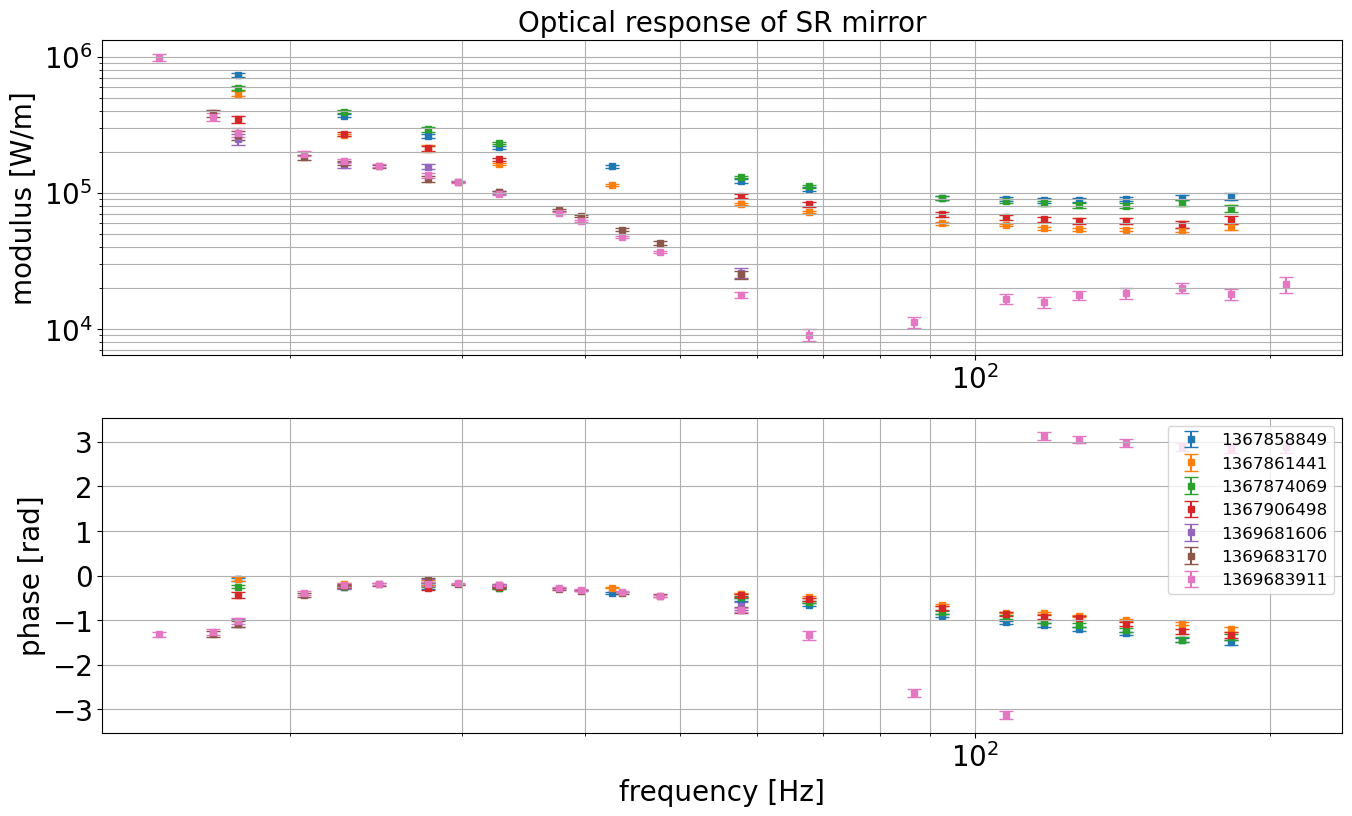
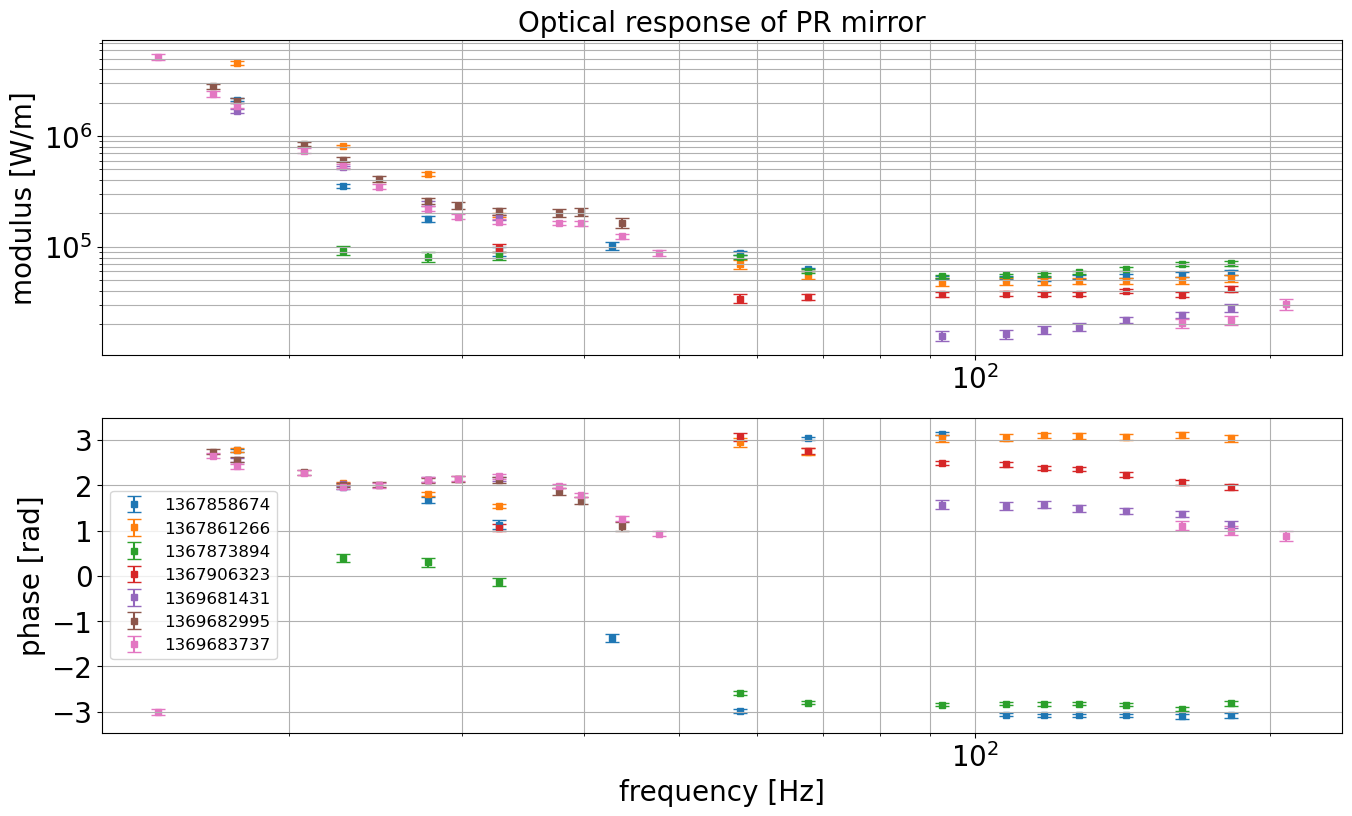
3) Optical response for PR and SR

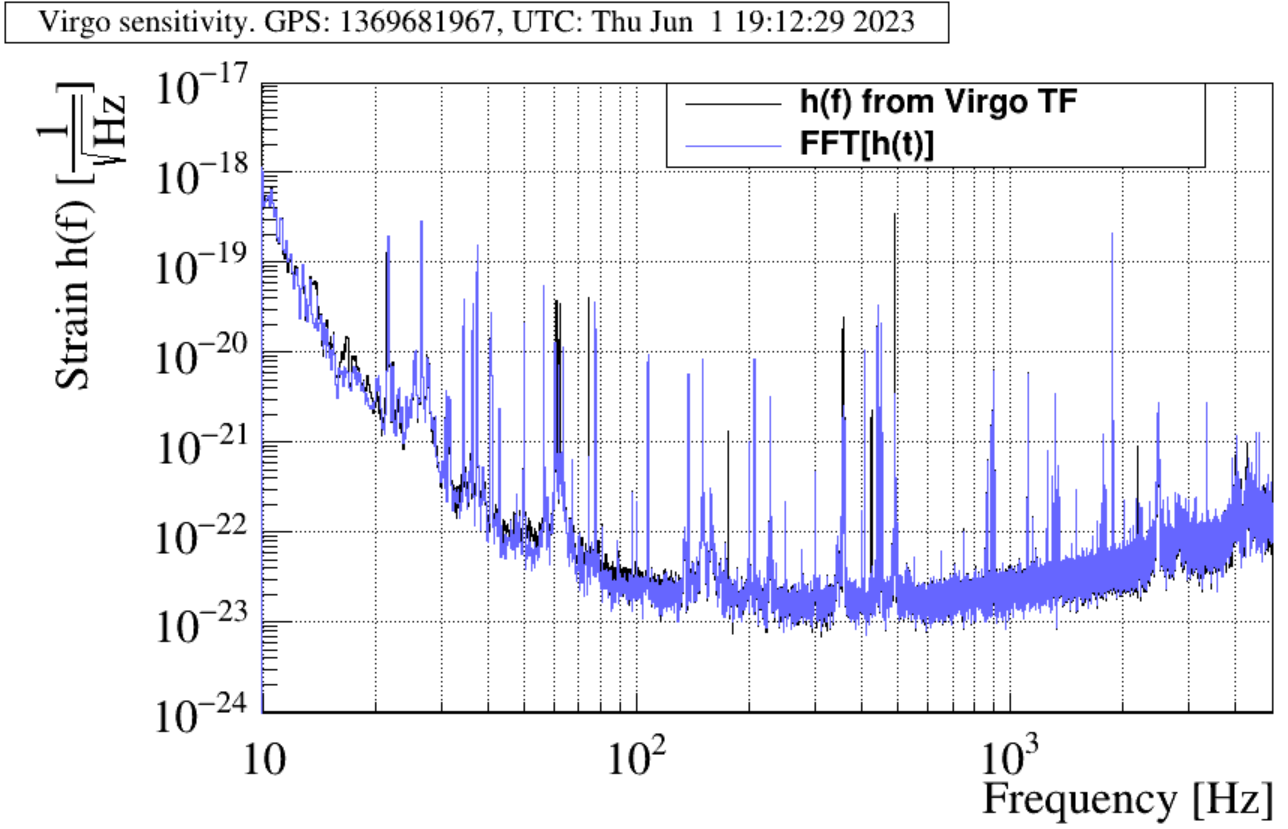
  • 18h55 : lines injection for NE, WE and SR and PR optical response, then noise injection for the sensitivity
  • 19h21 : lines injection for NE, WE and SR and PR optical response, then noise injection for the sensitivity adding low frequency lines from 13Hz to 400 Hz
  • 19h41 : lines injection only for SR and PR optical response adding low frequency lines from 7Hz to 400 Hz


4) CheckHrec injection only with High frequency line

  • 19h51 : Check Hrec injection with only the 808 Hz line
  • 19h54 : Check Hrec injection with only the 1258 Hz  line
  • 19h58 : Check Hrec injection with only the 2308 Hz  line
  • 20h01 : Check Hrec injection with only the 1258 Hz  line


5) Going to LN1 to measure WI optical response

going to down then going to LN1 from the CALI node
locking in LN1 with NI and WI mirror in HP

  • 20h44 : In to End line injection to calibrate WI and NI in regard to WE and NE


Comments to this report:
lagabbe - 14:15 Friday 02 June 2023 (60420) Print this report

Analysis of the optical responses of NE WE and BS

Two sets of measurements have ben done: first from gps time 1369680954 to 1369681320, second from gps time 1369682520 to 1369682886:

The two measurements are distant by 20 min, the gain of the optical responses has not change sinicatively from one measurement to another. However the pole frequency  change by ~10 Hz, probably due to fluctuations in the SR position.

The values of the parameters are on the plots


Images attached to this comment
lagabbe - 15:58 Friday 02 June 2023 (60422) Print this report

The optical response of PR and SR has been measured 3 times during the shift of the 1st of June. The 3 measurements agree with each other, however, no fit function has been found yet.

Images attached to this comment
verkindt, rolland, grimaud, lagabbe - 16:28 Friday 02 June 2023 (60423) Print this report

Sensitivity measurement

During the calibration shift, we did several injections on NE and WE to estimate the sensitivity h(f) directly with the measured TF between CAL{NE,WE}_MIR_Z_NOISE and DARM.
And we compared h(f) with the FFT of the hoft_raw signal provided by Hrec. Above 1000 Hz a fit of the TF is used. The fit is not accurate and shows a cavity pole frequency too high.
Anyway, at least below 1000 Hz, the comparison between h(f) and FFT(hoft_raw) is quite good. The main discrepancy is around 300 Hz
and is due to a notch around 309 Hz and a notch around 355 Hz that we used during our noise injection.
Plots 1 and 2 show the TF and h(f) for WE, plots 3 and 4 shows the TF and h(f) for NE.

Images attached to this comment
lagabbe - 17:20 Friday 02 June 2023 (60425) Print this report

I superpose the optical responses measured the 11th May with the optical response of the 1st of June. The optical response has changed a lot between these two dates

Images attached to this comment
grimaud, verkindt, , rolland, lagabbe - 18:43 Friday 02 June 2023 (60426) Print this report

Check Hrec measurements

During the calibration shift we did several Check Hrec injections in different configuration to test if we saw the same kind of variation as with the CheckHrec measurement of the 11/05/2023 (see this logbook entry)
For the first 3 sets injections (one set being 5 Mir injection and 5 Pcal injection) the line at 80 Hz (see this) was not injected.
Then we did 1 set of injection with the 80Hz present as well as an additional 10Hz line
plot 1,2,3 and 4 show the result for MirNE and WE and Pcal NE and WE without the 80Hz line and plot 5,6,7 and 8 the result for the injection with 80Hz and 10Hz line.

Then we did a check Hrec injection set right after doing a sensitivity measurement by injecting noise in the ITF.
Result are shown in plot 9,10,11 and 12 with the first 5 injections being before the sensitivity injections and the other 5 being right after.
No significant discrepancies are seen contrary to precedent measurements made during the 11/05/2023 calibration shift.

The plot 13 shows the supperpose averages for all the Check Hrec injections done during the 01/06/2023 shift.
The modulus values follow the same shape between all actuators, however there is a difference in phase MirNE and MIrWE value with a delay of 30 μs for NE and 45 μs for WE that is probably linked to additionnal delays found during the measurement of the transfer fonction between CAL_{WE,PR,NE}_Z_CORR and Sc_{WE,PR,NE}_Z_CORR channels,  with an additional delay of 50 μs for WE and PR and 25 μs for NE.
The Pcals don't have the same phase behavior and are quite constant over the frequency range.

In conclusion we can see with this measurements that Hrec is correct at a 5% precision in modulus.


Images attached to this comment
lagabbe - 15:13 Tuesday 06 June 2023 (60461) Print this report

In figure CheckHrec_online_MirNEWE_PcalNEWE_1369673656_1369680782_Average.png, the modulus hrec/hpcal differs from WE to NE. More particularly, the modulus of hrac/hpcal NE drop to 0.96 at 1 kHz. The models of the PCal mechanical response differ between the two PCal. On WE, a more accurate model modeling 3 drum modes is used, whereas on NE, only 1 drum mode is modeled.

Figure mech_response_O4_vs_O3.png, shows the model of the mechanical response of used WE (in red) and an approximation using only one drum mode (in purple). The residual (figure mech_response_O4_vs_O3_residual.png) up to 2% at 1 kHz and 6% at 2 kHz in modulus. The phases of two model agree within 1 mrad, which agree with the phase of hrec/hpcal.

The blue curve shows a new model using 1 drum mode and a frequency independant gain added to the frequency response. This new model differs from the 3 drum modes model by 0.2% on the modulus and less than 1 mrad on the phase below 5 kHz.

Images attached to this comment
Search Help
×

Warning

×