Some considerations about the installation of a new fan-motor system for the terminal building AHUs (#57814). We performed a slow-down test of AHU systems using the inverter from 50 Hz to 35 Hz with a frequency step of 5 Hz.
Below, are the frequency values of motor, fan and belt during the test.
| Inverter frequency | NEB/WEB motor frequency | NEB/WEB fan frequency | NEB/WEB belt frequency |
| 50 Hz (nominal) | 24.9503Hz / 24.9491Hz | 11.7047Hz / 11.7949Hz | 6.1852Hz / 6.2437Hz |
| 45 Hz | 22.2687Hz / 22.4601Hz | 10.5346Hz / 10.6155Hz | 5.5652Hz / 5.6196Hz |
| 40 Hz | 19.9591Hz / 19.9646Hz | 9.3633Hz / 9.4358Hz | 4.9499Hz / 4.9953Hz |
| 35 Hz | 17.4665Hz / 17.4697Hz | 8.1949Hz / 8.2602Hz | 4.3298Hz / 4.3745Hz |
Acoustic noise
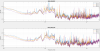
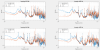
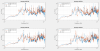
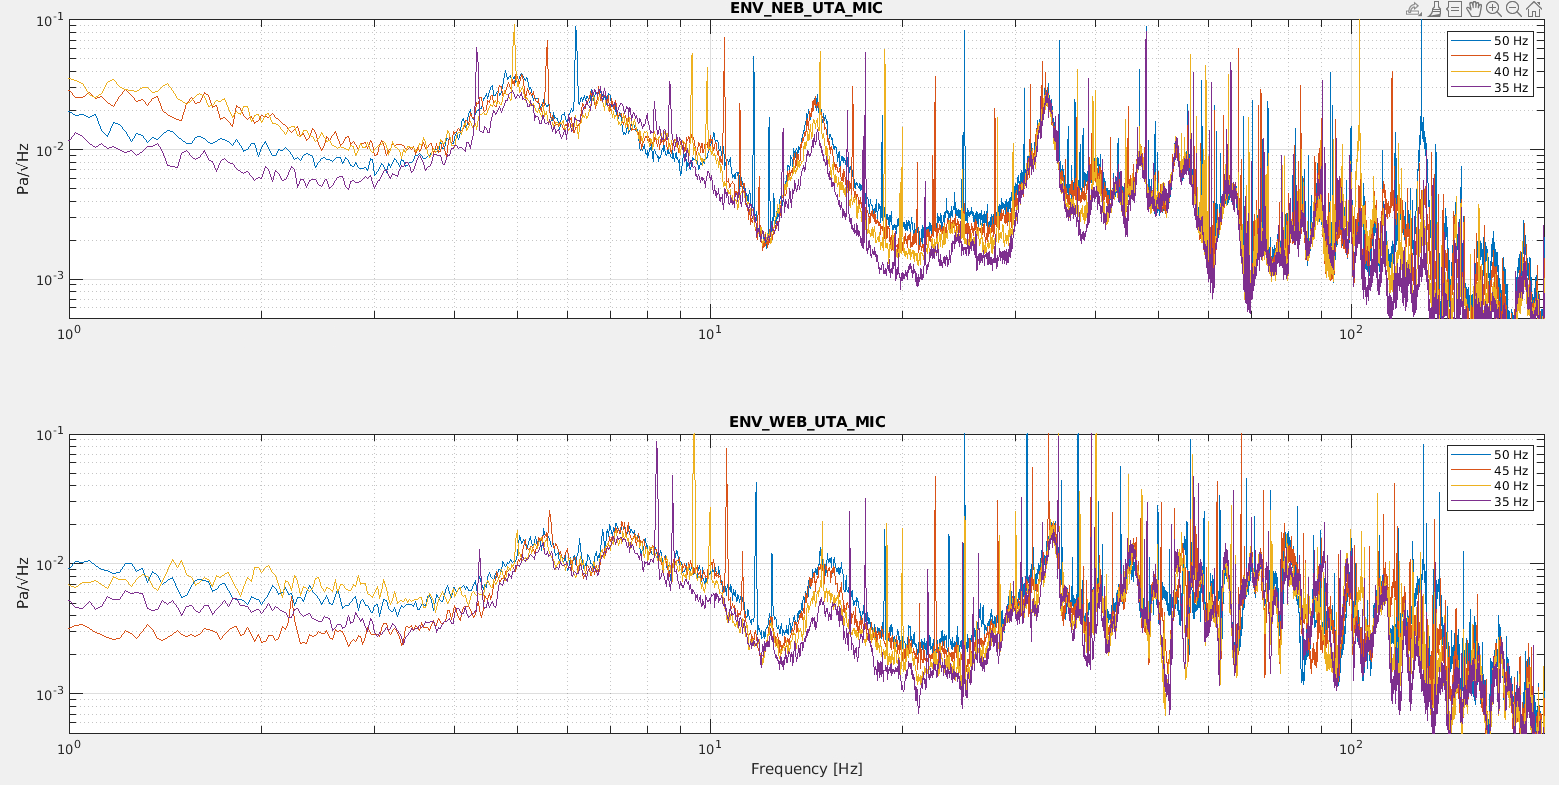
The evolution of acoustic noise in NEB and WEB experimental rooms is shown in Fig.1. A broadband noise reduction is observed for both buildings during the test in the frequency range (1-100) Hz.
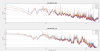
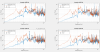
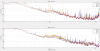
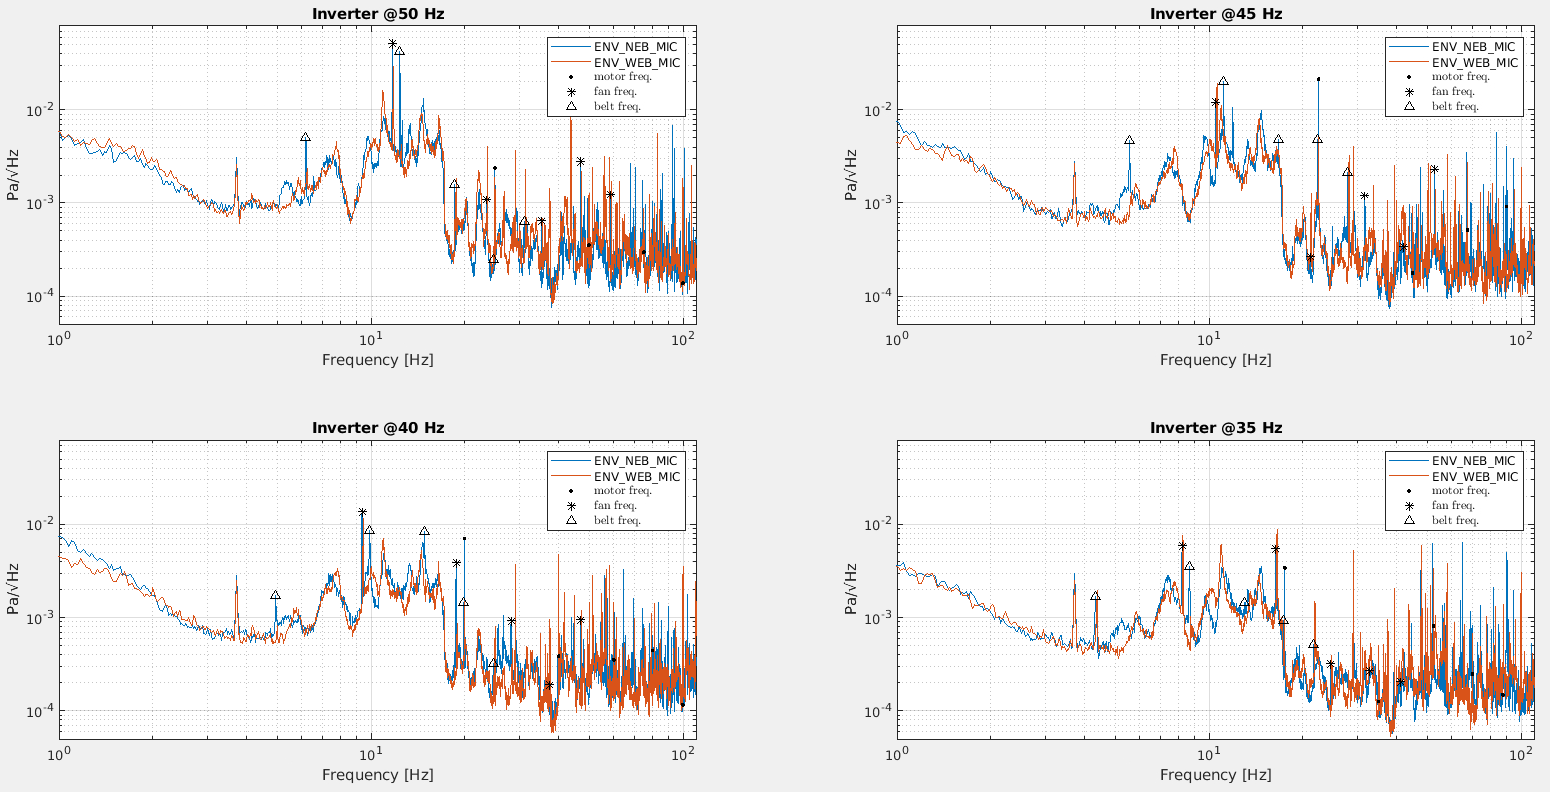
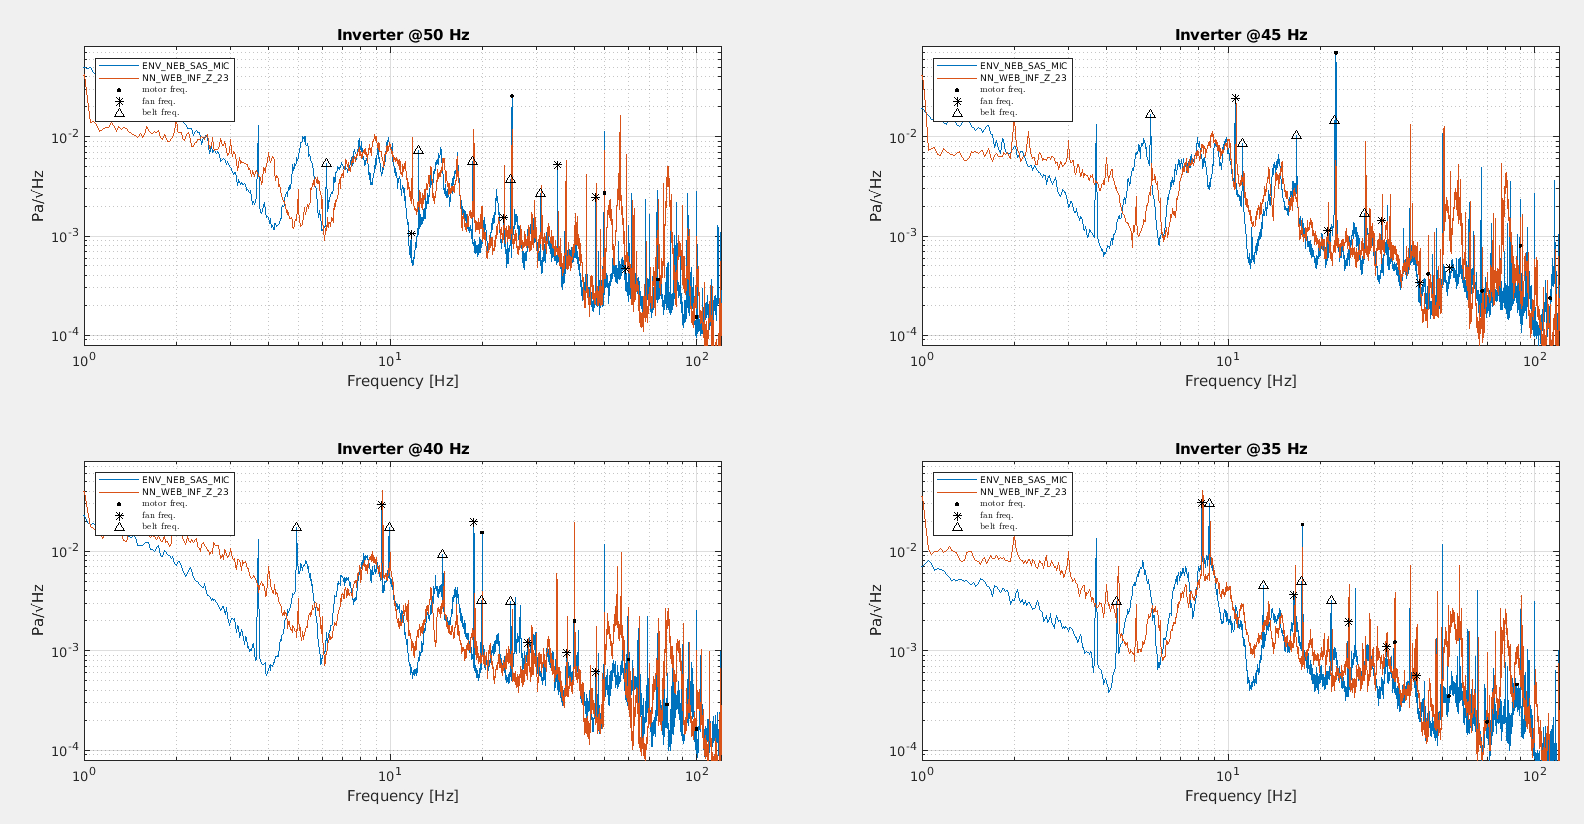
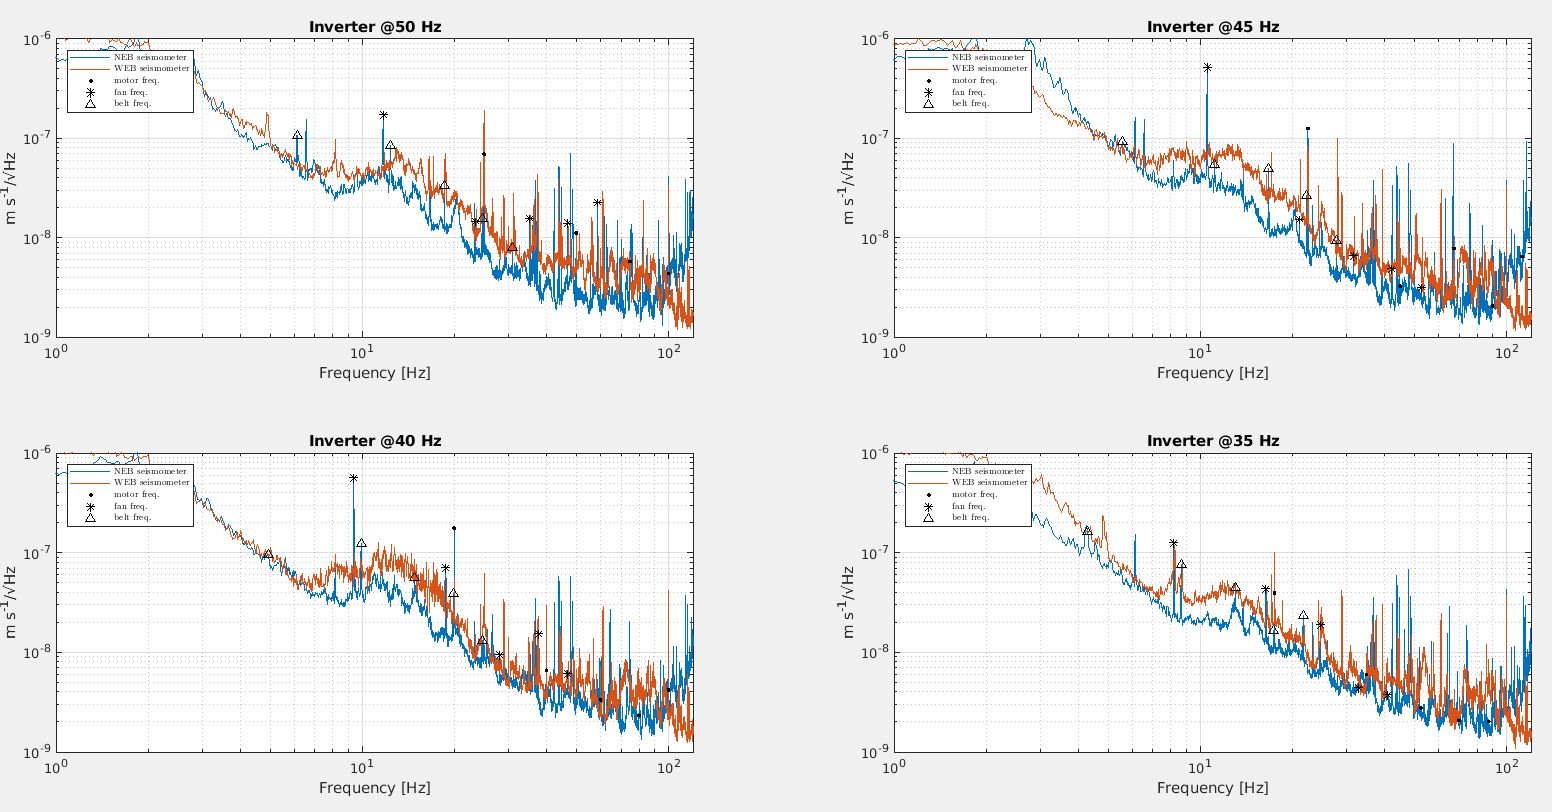
Looking at Fig.2, it is reported the comparison of the acoustic noise in the two buildings for each inverter frequency step. The acoustic noise is almost the same for the two experimental buildings. Moreover, the motor (dot), fan (asterisk) and belt (triangle) frequencies and their harmonics (up to 5th) are well visible in both spectra. Only the NEB frequencies are indicated in the plot because, as reported in the table, they are slightly different from WEB AHU. Furthermore, it seems that the amplitude of these frequency lines is slightly higher for the NEB AHU up to ~20 Hz.
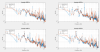
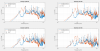
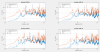
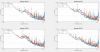
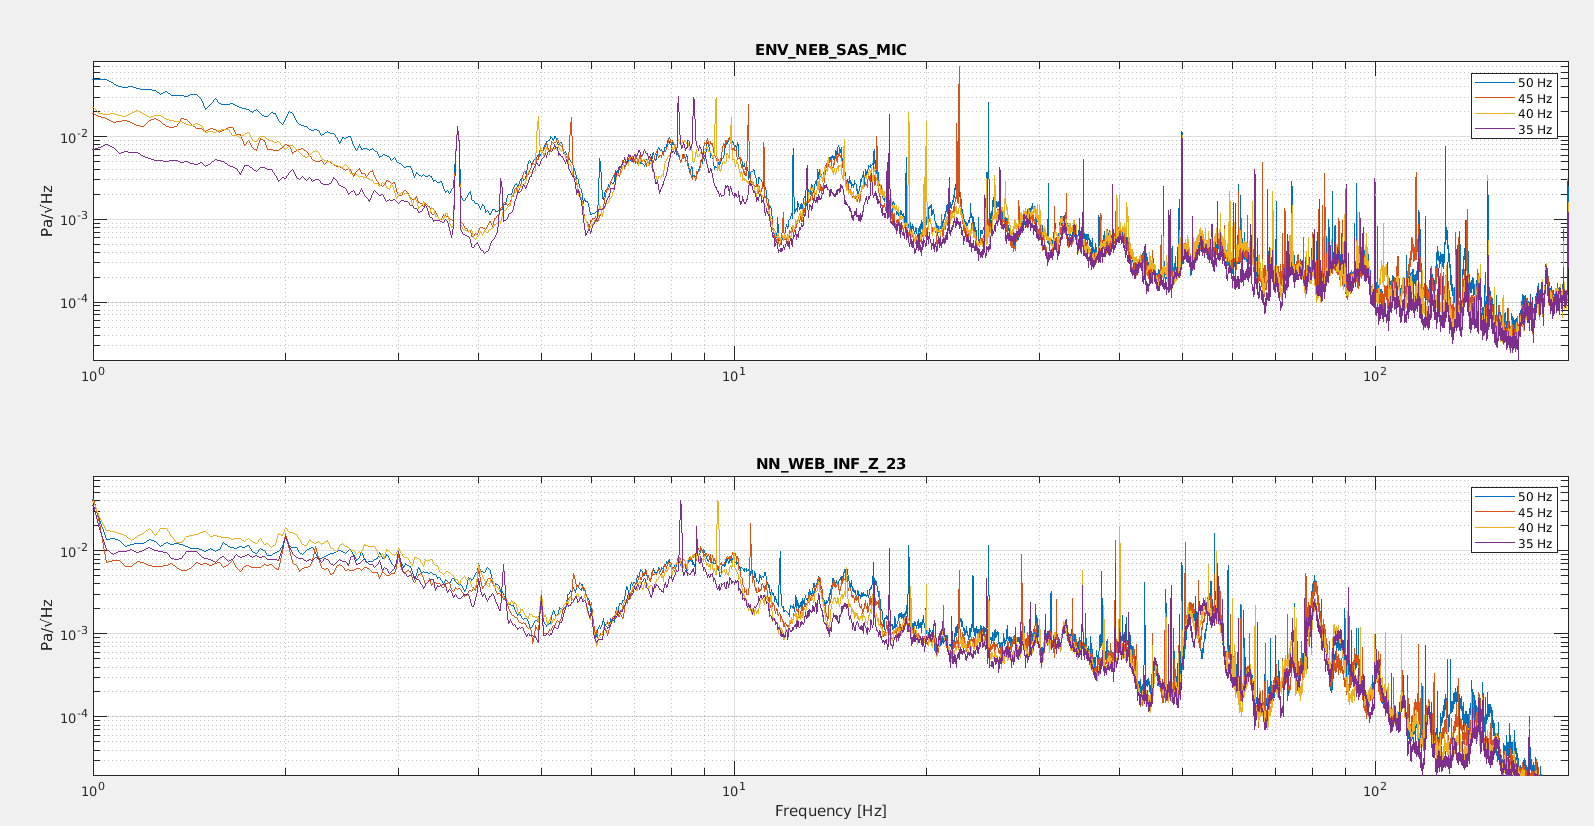
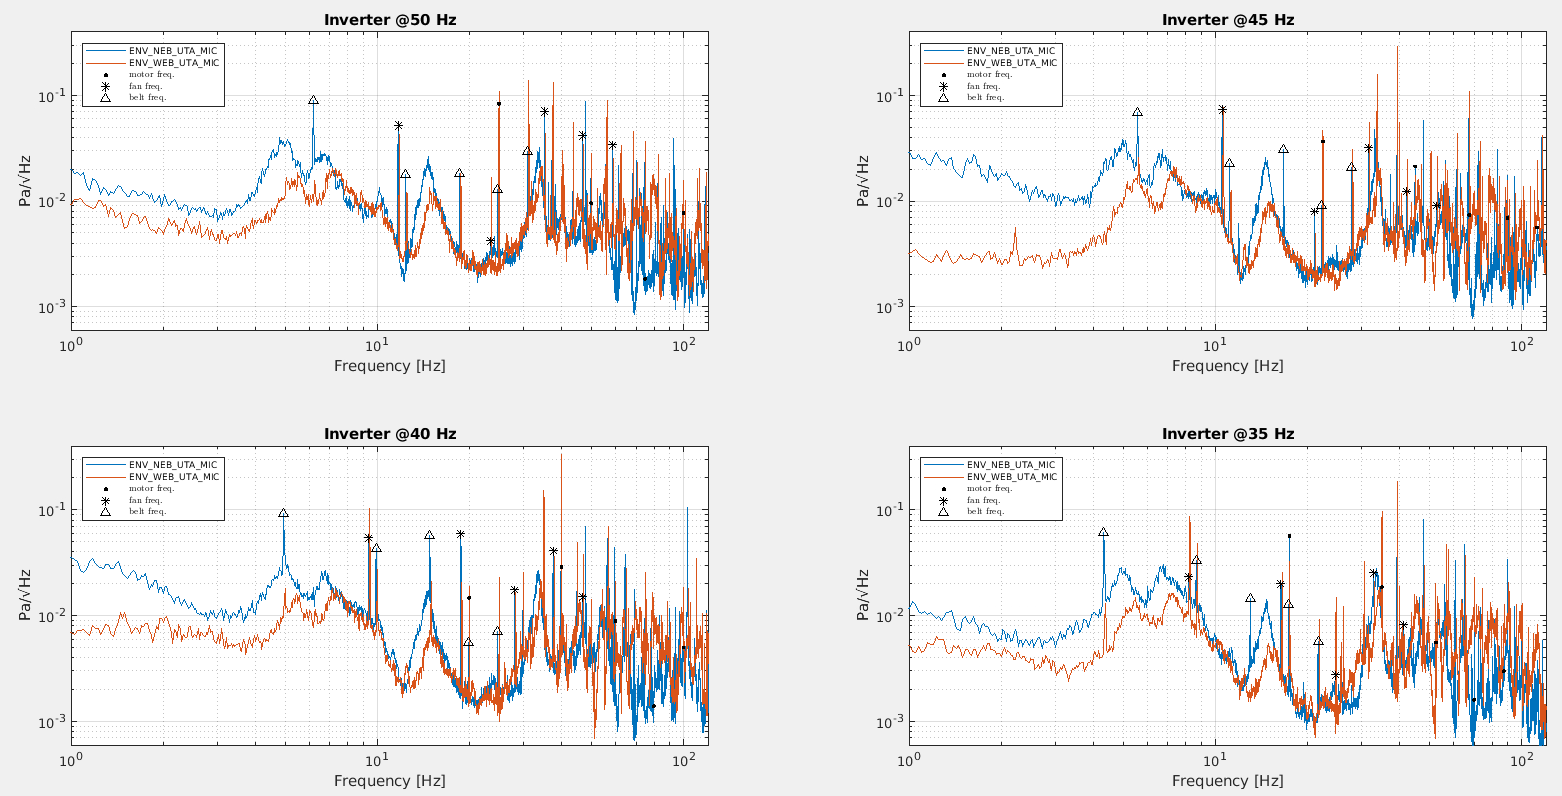
Fig.3-Fig.4 and Fig.5-Fig.6 are the same plots as before but for the SAS room and AHU room, respectively. Comparing the two buildings, we notice: i) the frequencies of the fan, motor, belt and their harmonics arise in the acoustic spectra of the SAS and AHU rooms; ii) the acoustic noise of the NEB SAS is slightly lower than WEB; iii) in the technical area where the AHU systems are installed, the NEB microphone measures an acoustic noise higher up to ~20 Hz.
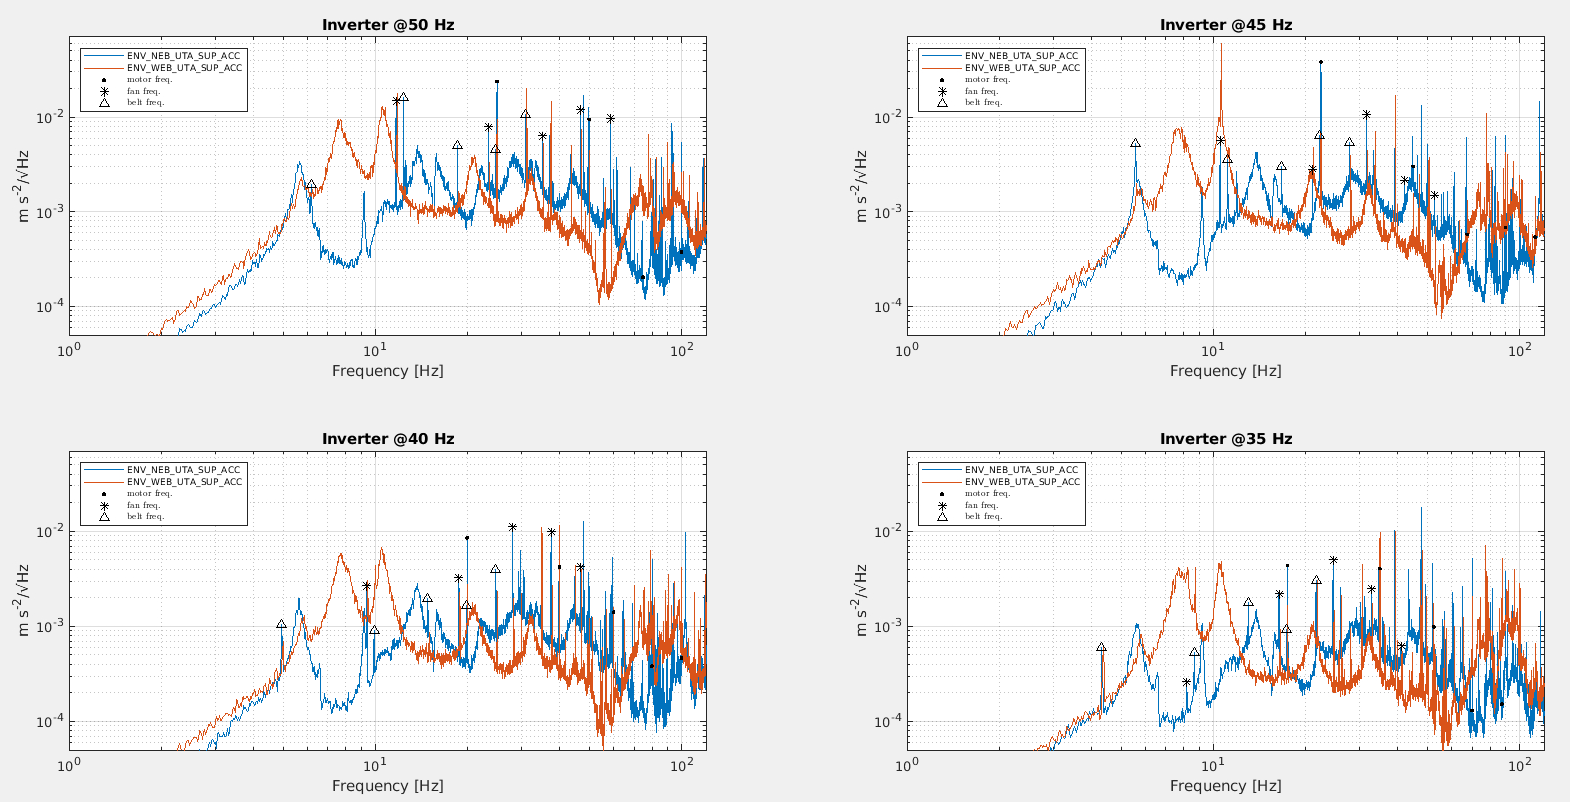
Air ducts vibration noise
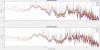
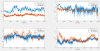
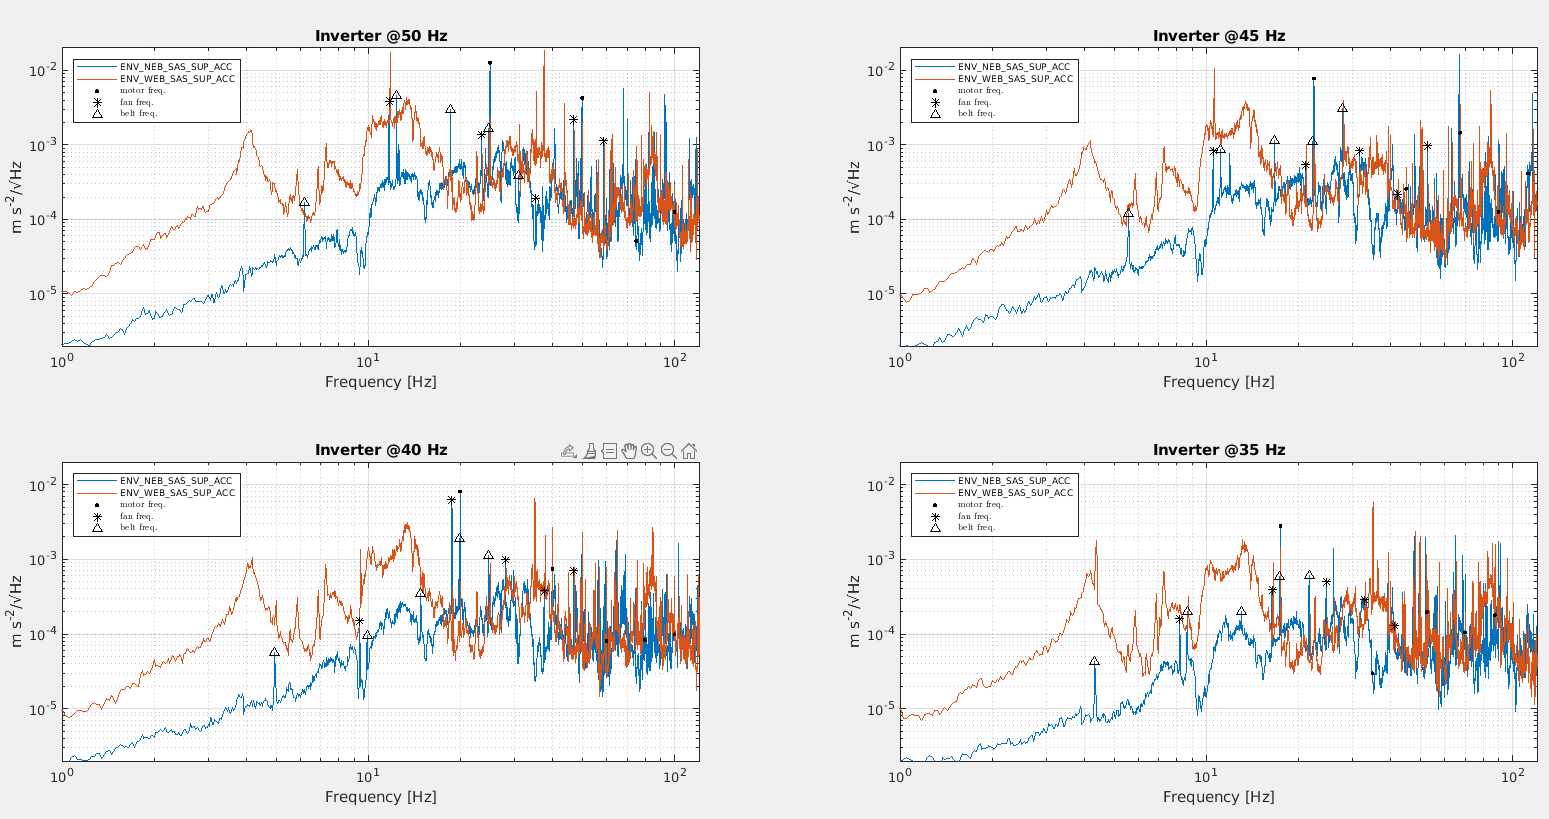
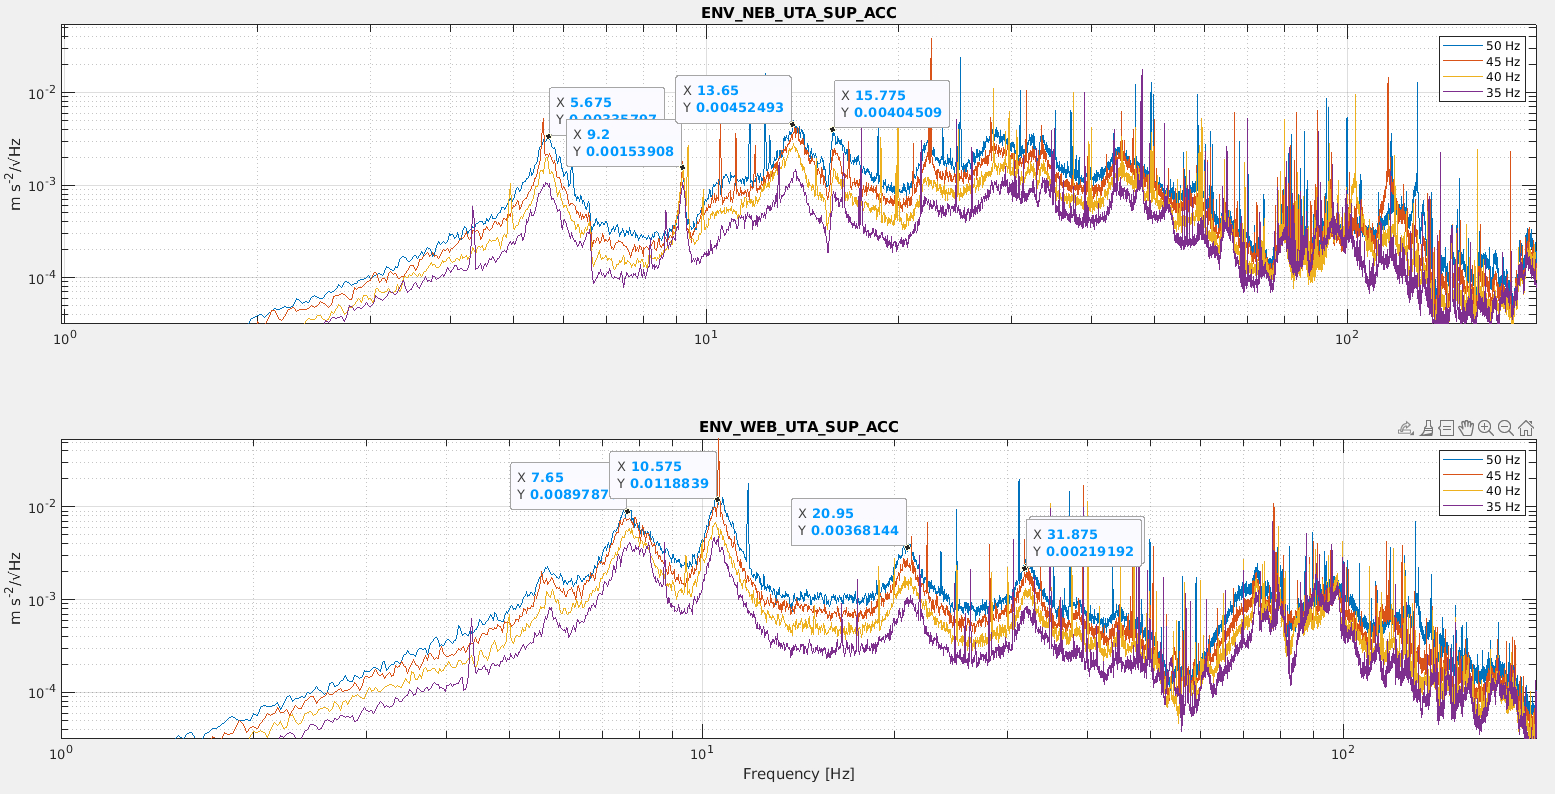
The vibration noise of the supply air duct in the SAS and AHU rooms are reported in Fig.7 and Fig.8, respectively. For frequency values below 20 Hz and in narrow frequency regions, the supply air duct of the NEB SAS room vibrates less because it has been weighted with soundproofing panels. Instead, in the AHU room, we have the opposite case in the frequency range ~(12-65) Hz. In Fig.9, some resonances of the supply ducts are reported.
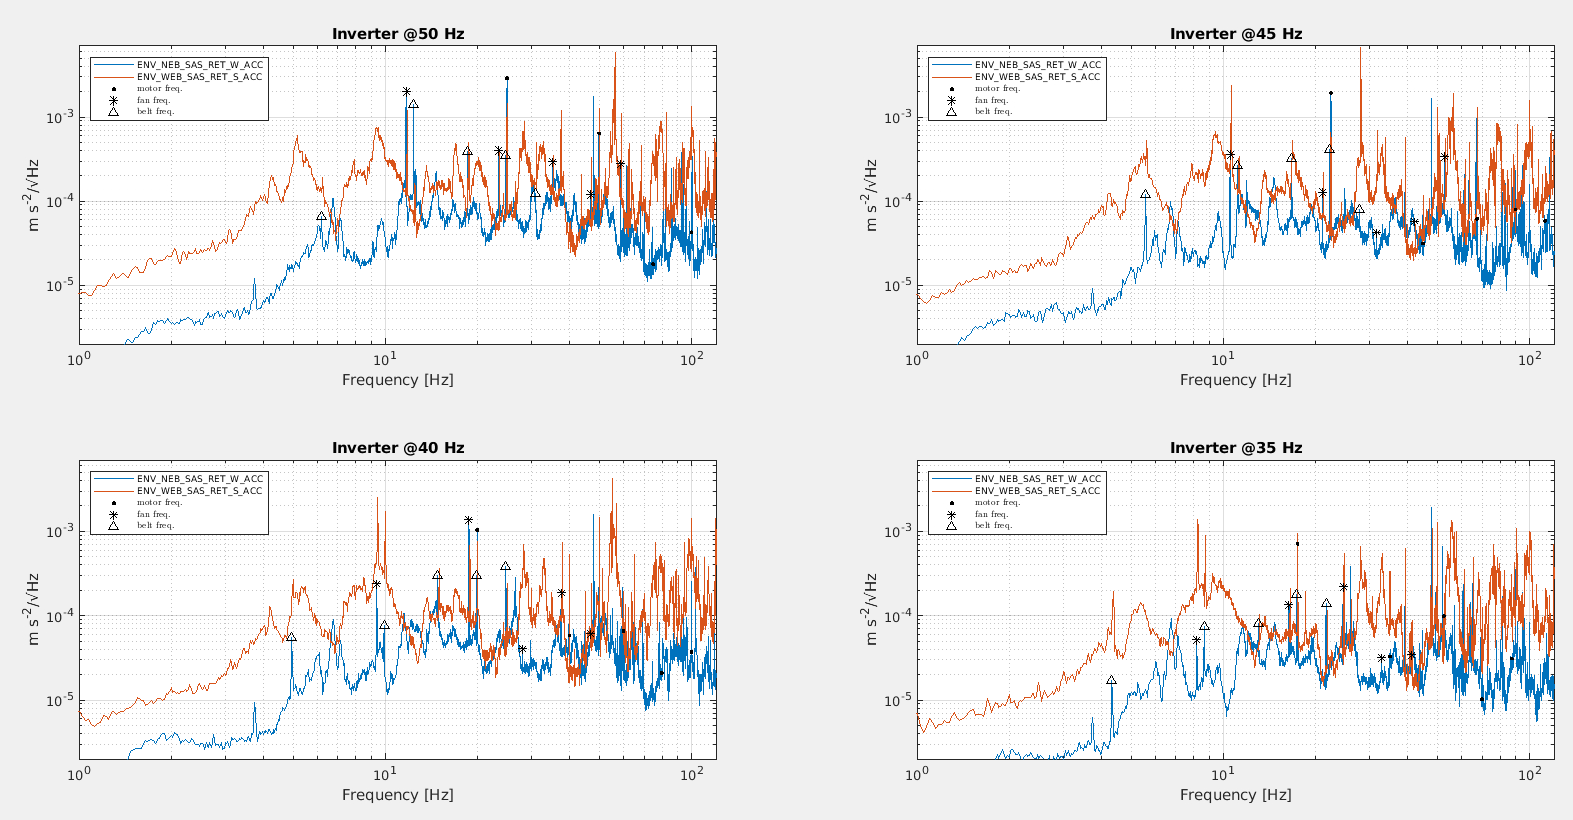
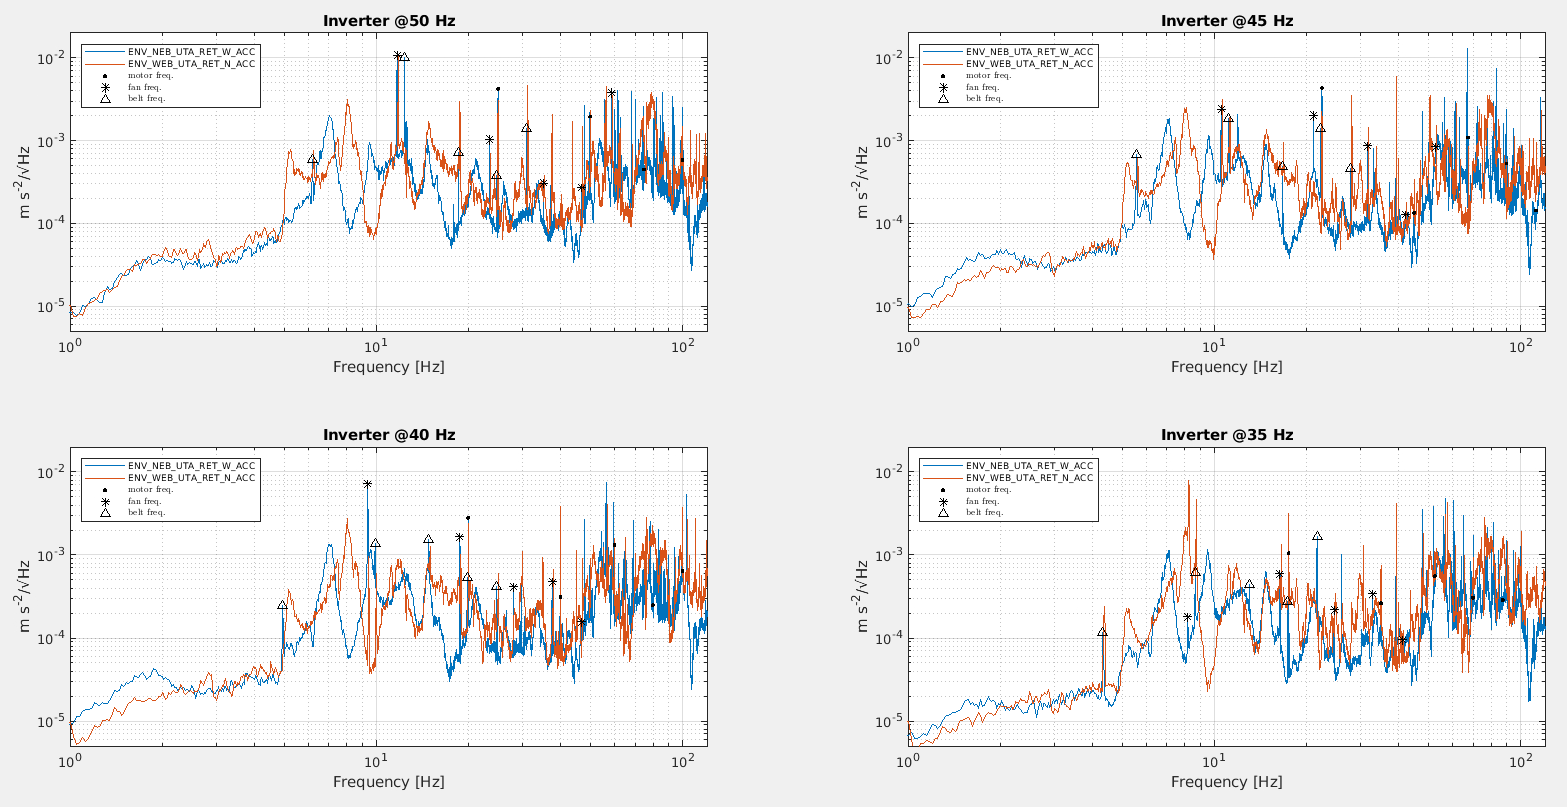
Fig.10 and Fig.11 show the vibration spectra of return air ducts in the SAS and AHU rooms, respectively. The sound-proofing panels are installed on the return air ducts in the NEB SAS area, as well. For this reason, we observe a higher vibration of the WEB SAS return air duct.
The frequency lines (and harmonics) associated with the motor, fan, and belt are clearly visible in the spectrum of the NEB and WEB supply and return air ducts. However, it seems that for the North building, their amplitudes are more significant than the West building.
One comment about the vibro-acoustic noise: although the supply and return air ducts vibrate more at WEB SAS, the acoustic noise in these two areas is comparable. This could mean that the dominant noise source may be another or that the noise coupling at NEB is stronger. In fact, acoustic insulation came together with the stiffening of the clamps to the wall.
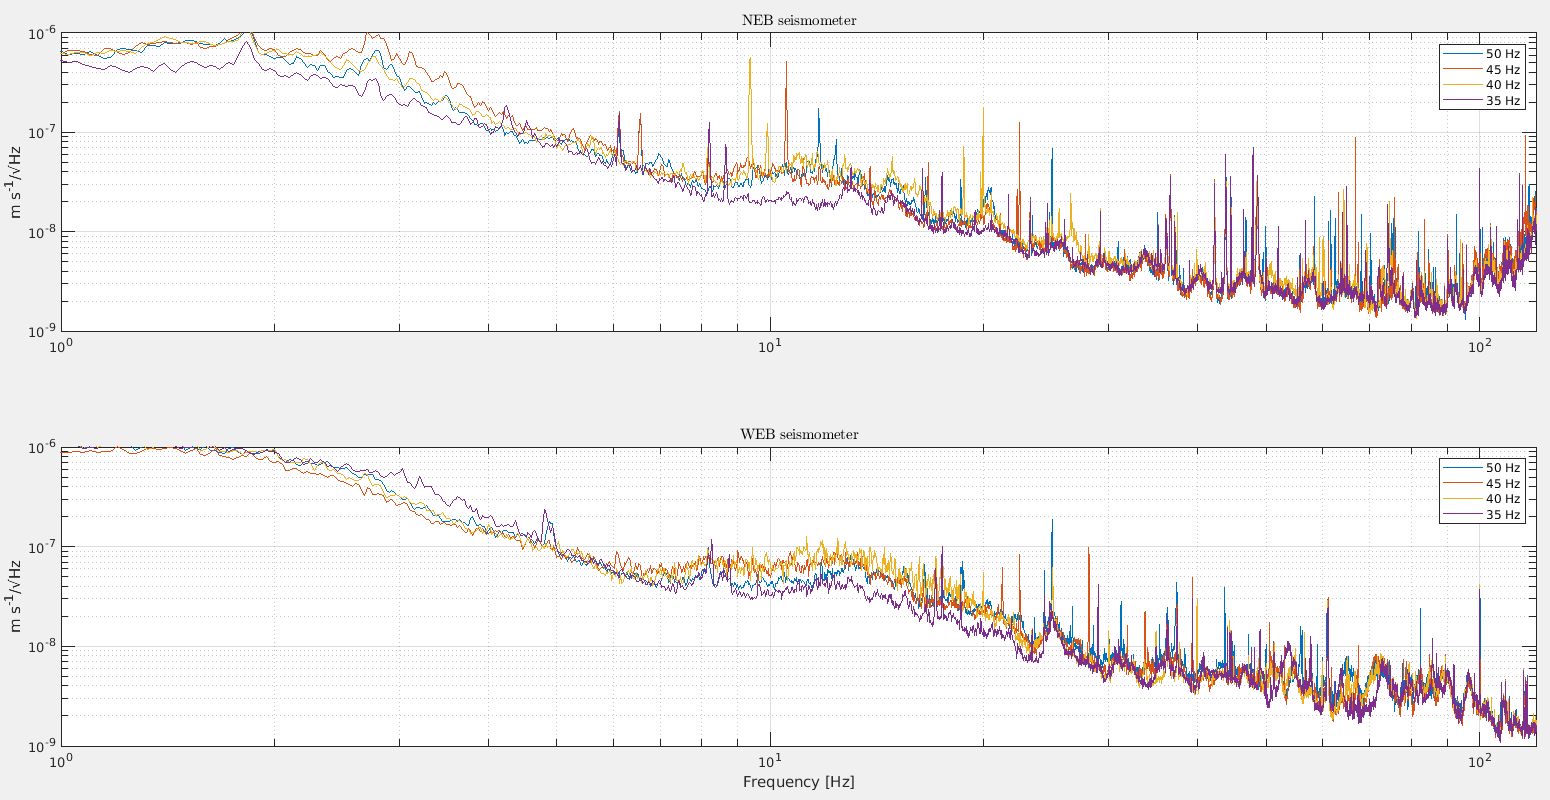
Seismic noise
During the slow-down, the seismic noise in the WEB hall (red curve) seems higher (~factor 2.5) in the frequency range ~(10-30)Hz and the frequency lines of the motor, fan, and belt are well visible in the spectra of both seismometers, Fig.12-Fig.13
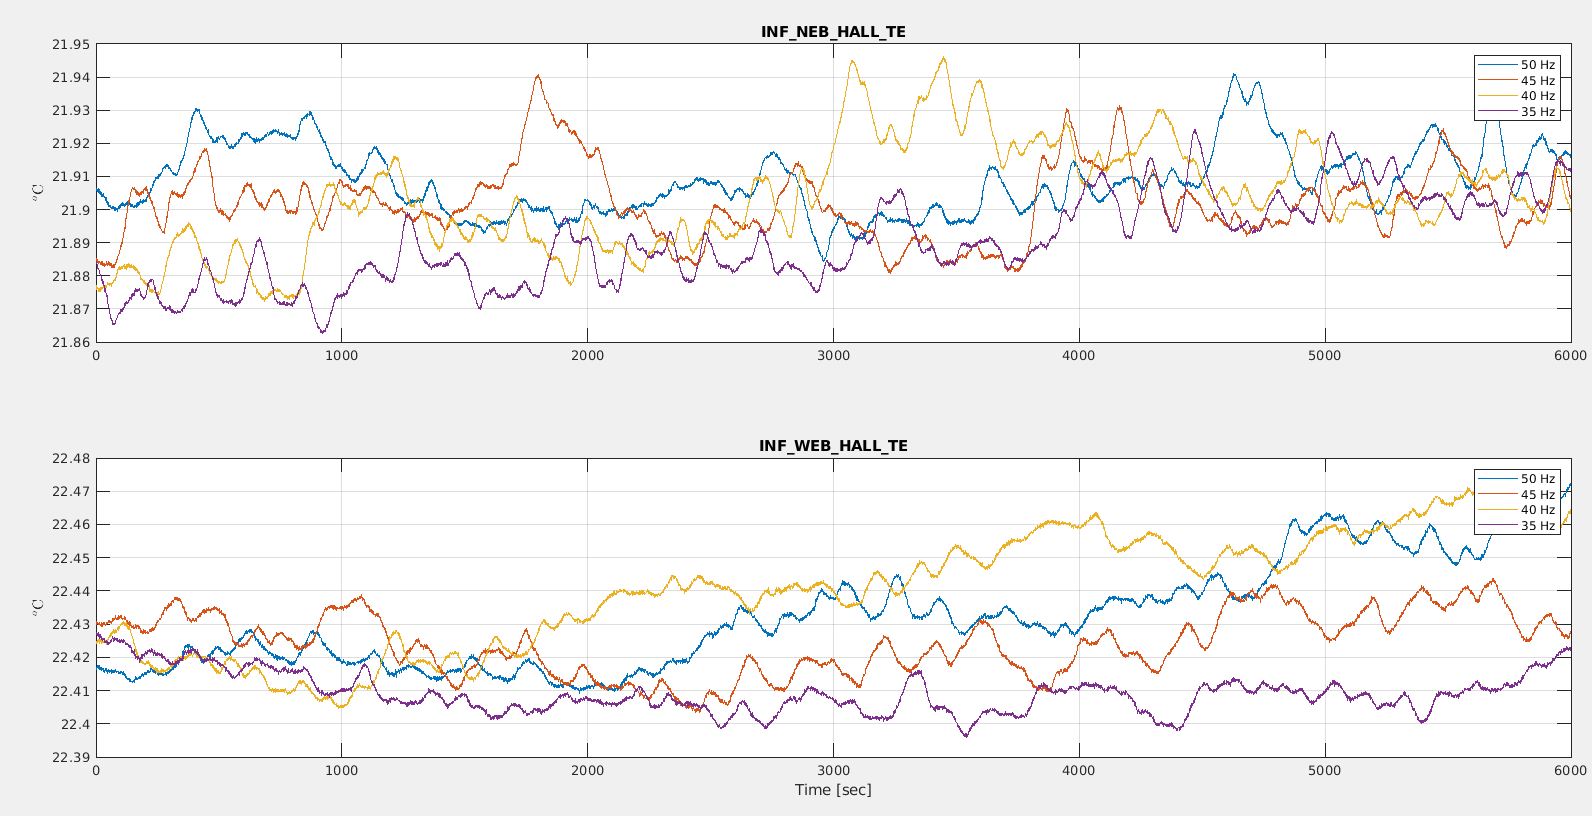
Environmental and AHU parameters
Looking at the overpressure in the experimental hall, the NEB signal looks noisier, Fig.14. Still to be understood whether the sensor noise is due to electronics or physics. Fig.15 shows the temperature in the two experimental halls. The variations are within 0.1 degC.
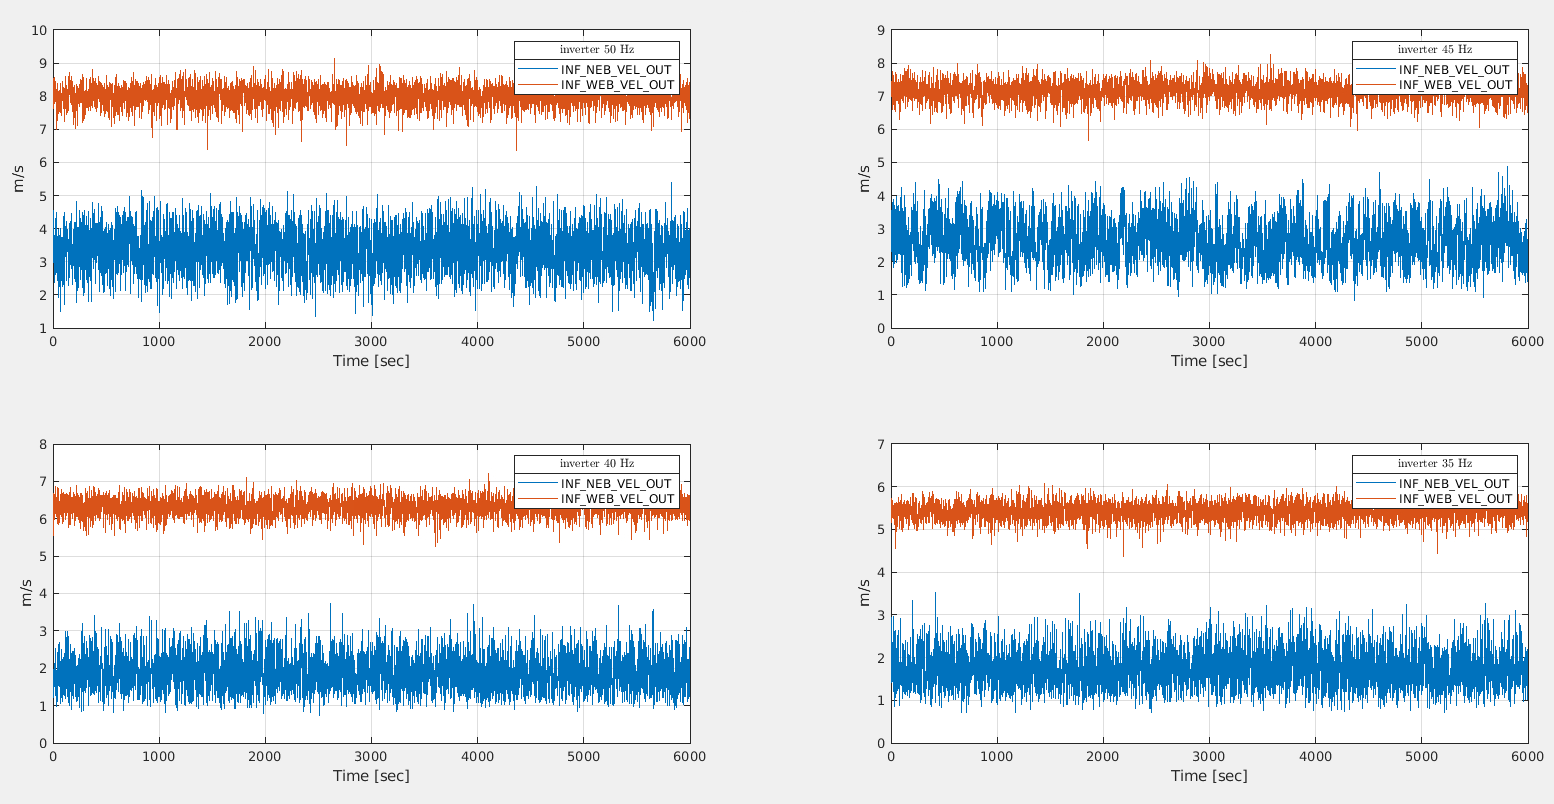
The velocity of the air flux along the supply duct in the NEB AHU room looks half with respect to WEB, Fig.16. This looks quite strange since the acoustic noise in both halls is comparable. We have to check both sensor's inter-calibration and the origin of excess noise in the NEB sensor, if it is from the electronics or physics.

