After the first look given to the March 16th data (/data/tcs/buffer/test/HWS-RC/DET/20230316T0008) this morning (59334), I started analyzing also the acquisition performed yesterday night (/data/tcs/buffer/test/HWS-RC/DET/20230319T2318).
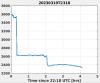
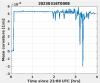
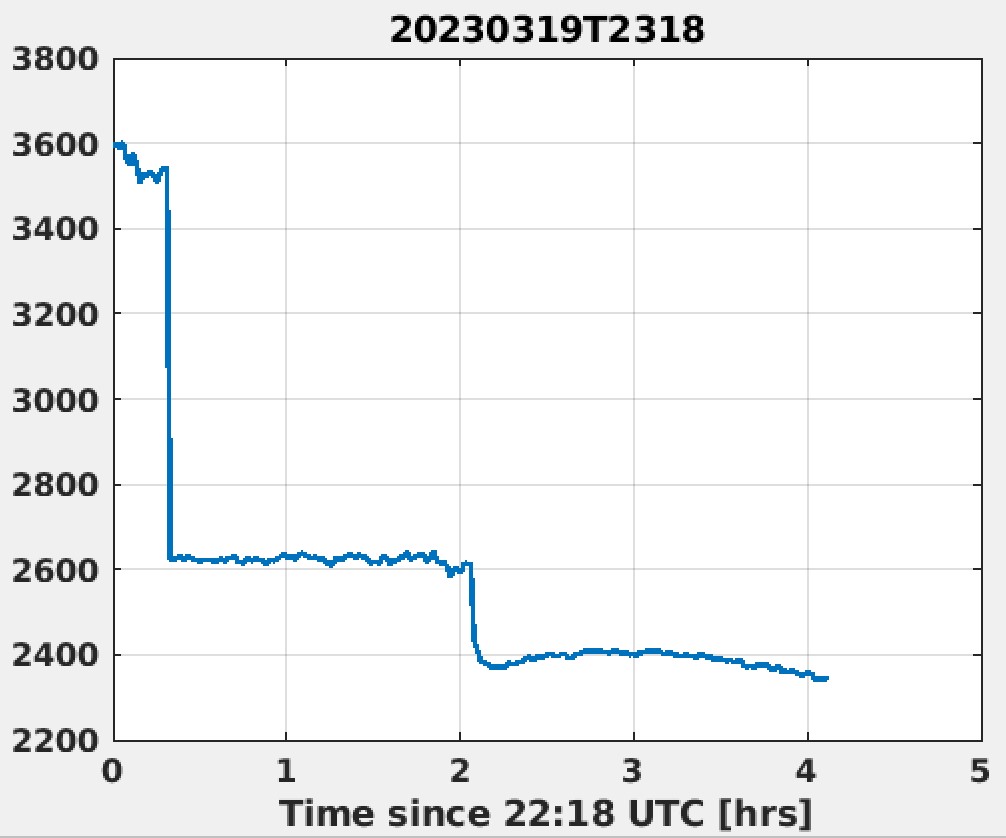
Also in this case I computed the maximum intensity on the CCD as a function of time (from 22:18 UTC). The result is in fig. 1 and shows, again, two drops correlated respectively to the unlock and to a large glitch in the SDB2 TX LC signal (see figure 2).
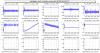
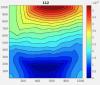
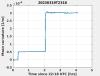
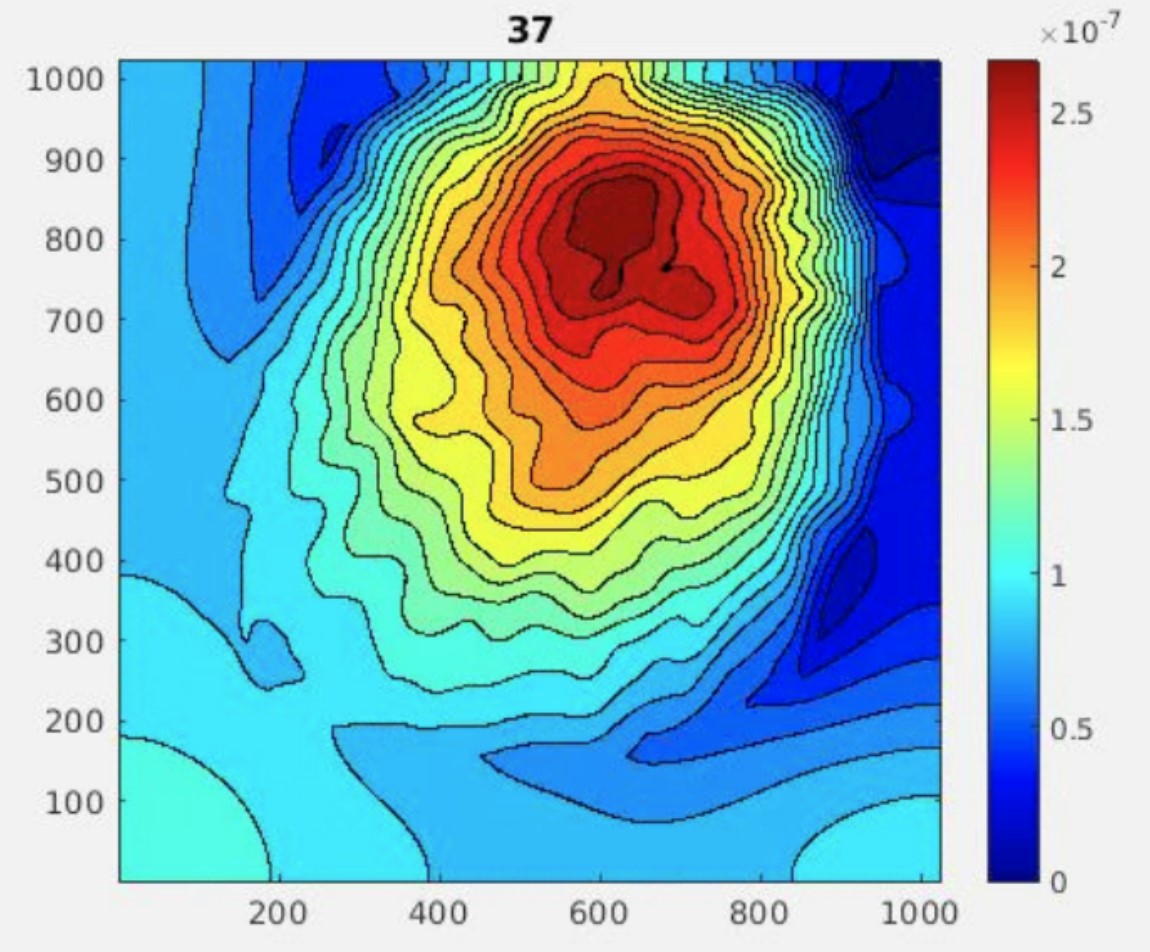
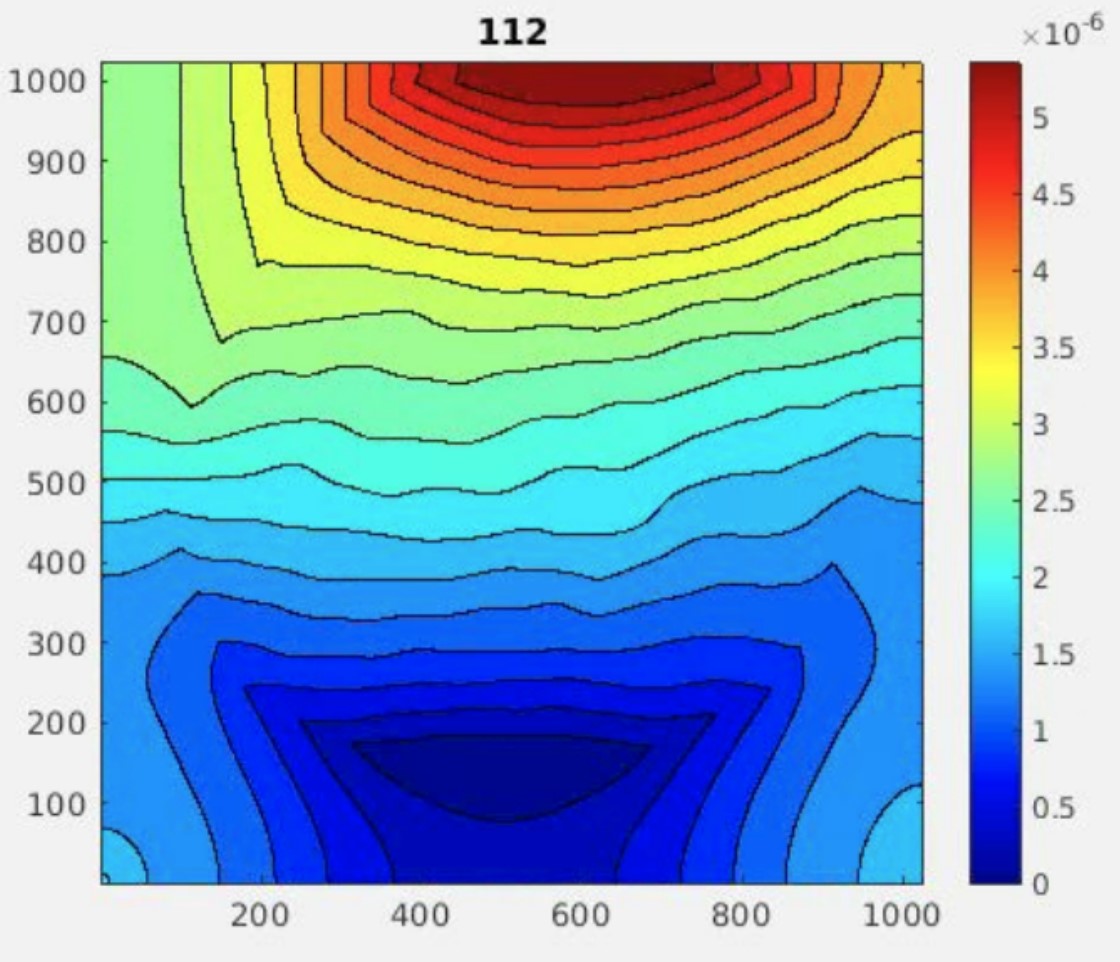
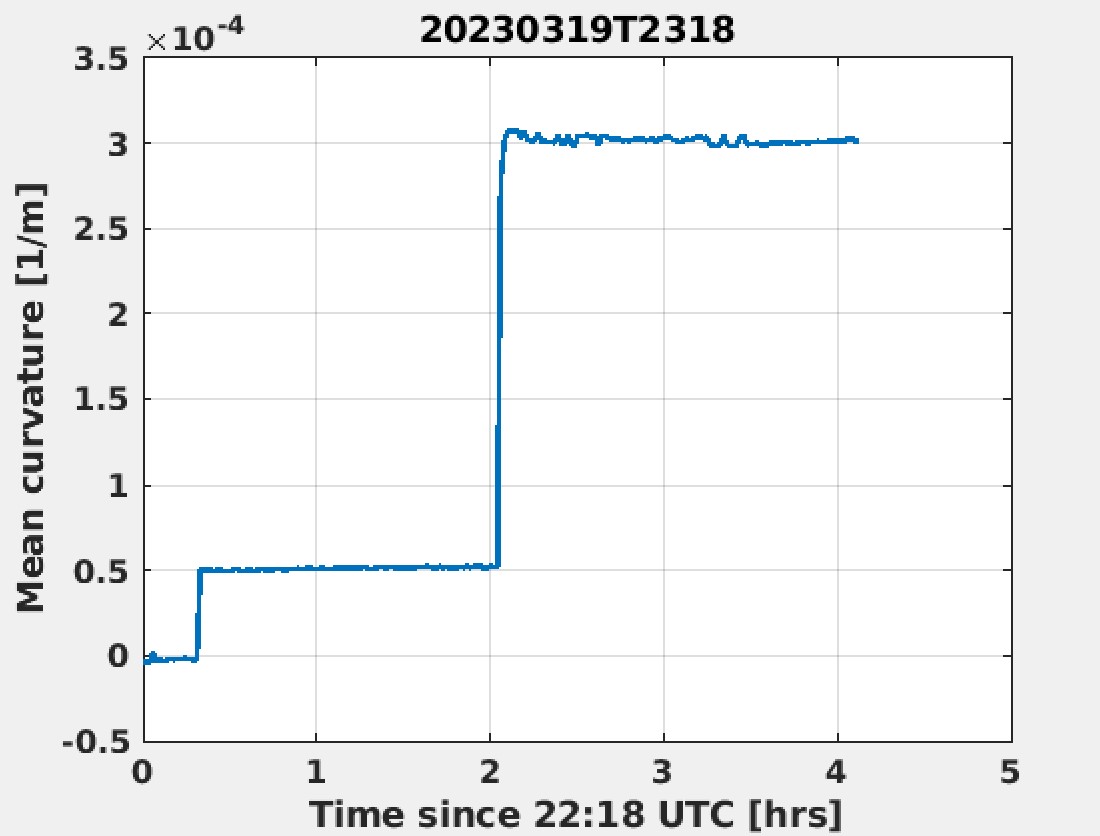
Despite these intensity drops, the WFs look "normal": fig.3 is a FW after the first drop and fig.4 shows a WF acquired after the second drop. In particular, fig.3 shows an optical path length increase that really looks like that due to the YAG absorption, without point absorbers... Moreover, the optical path length due to the CH is not visible at any time. Nevertheless, I computed the curvature with the usual algorithm. The result is shown in fig 5: such a peculiar behavior, like a step function, very difficult to attribute to a physical phenomenon.
Since the intensity drops are shared between the two data sets, I evaluated the curvature also for the March 16th WFs. The result is in fig. 6, and again the step-like behavior is present.
From these investigations, we can conclude that the "signals" in the HWS-DET acquisitions performed on March 16th and 19th are fake, i.e. due to the drops of the intensity of the spots on the CCD.
