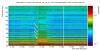
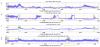
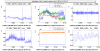
Looking at the acoustic spectrogram of the North end building, we noticed, during windy days, an increase of the acoustic noise in the experimental hall, Figure 1. Looking in detail, this seems to occur coincident with the growth of the pressure (*PRES*OUT*) measured along the supply air duct in the AHU room when the velocity (METEO_WIND_SPD) of the wind is greater than ~10 km/h and its direction (METEO_WIND_DIR) is less than ~100 deg clockwise with respect to the geographic North, Figure 2. It is worth mentioning that the values of wind speed and direction are measured by the meteorological station located on the roof of technical building 2.
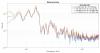
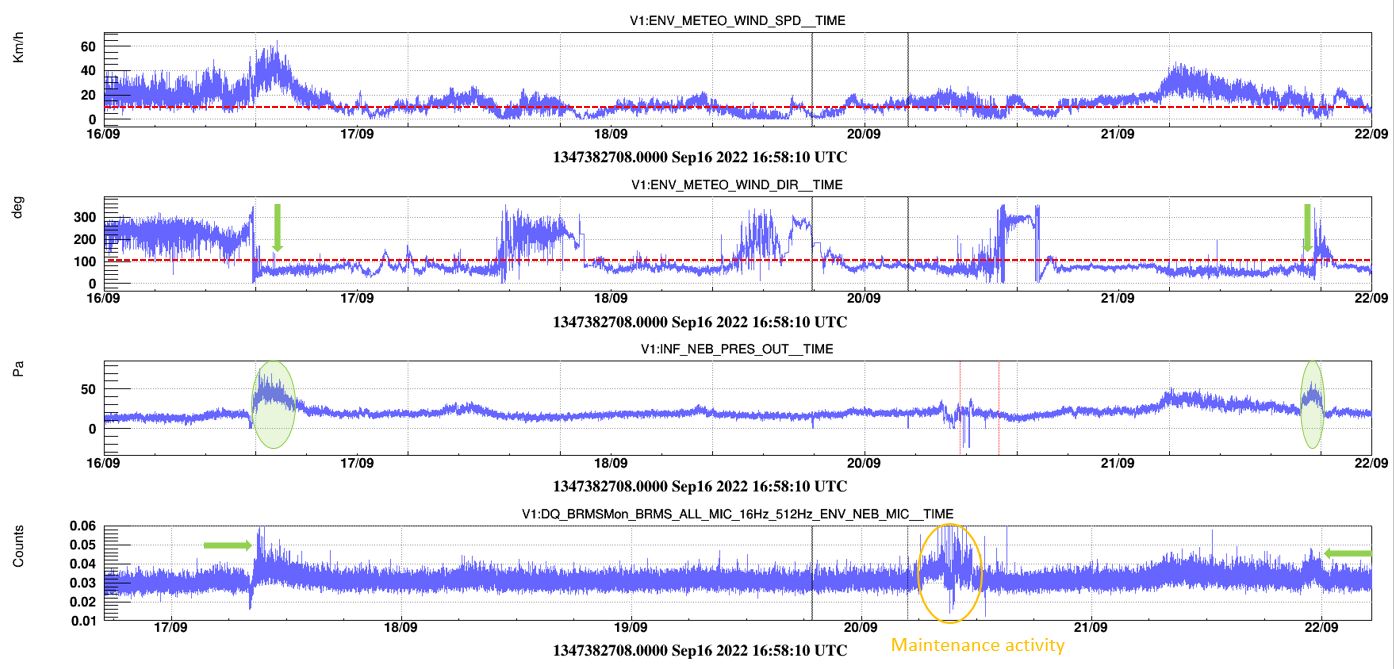
Figure 3 shows the effect of the wind speed&direction on the microphone of the NEB experimental room when the *PRES_OUT* increases. The analyzed NEB data set is before the slow-down actions of the NEB AHU fan inverter (#57154). The blu curve is the "quiet": the acoustic ASD during a day with low wind activity (v~4 km/h). We observe a broadband noise in the frequency range ~(10-100) Hz (yellow and violet curves) during the days with wind velocity above ~10 km/h. But what triggers this acoustic noise amplification effect is also the wind direction below 100 deg. Indeed, the red curve, despite having sustained wind activity (v~34.3 km/h) but a direction greater than 100 deg (dir~222.3 deg), shows an acoustic noise in the room almost comparable to the quiet. This effect might be related to how the wind impinges on the supply and return external air ducts of the NEB AHU system.
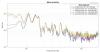
Regarding the West end building, this effect seems less evident: independently of the direction, only the high wind velocity (above ~15 km/h) produces a slight growth of the acoustic noise in the frequency band ~(10-50)Hz (green and yellow curves) but the effect is larger than NEB above 50 Hz, Figure 4.
Further investigation will follow.
