Today we continued to characterize the SQZ from the delay line trying to better understand the excess of phase noise.
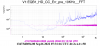
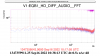
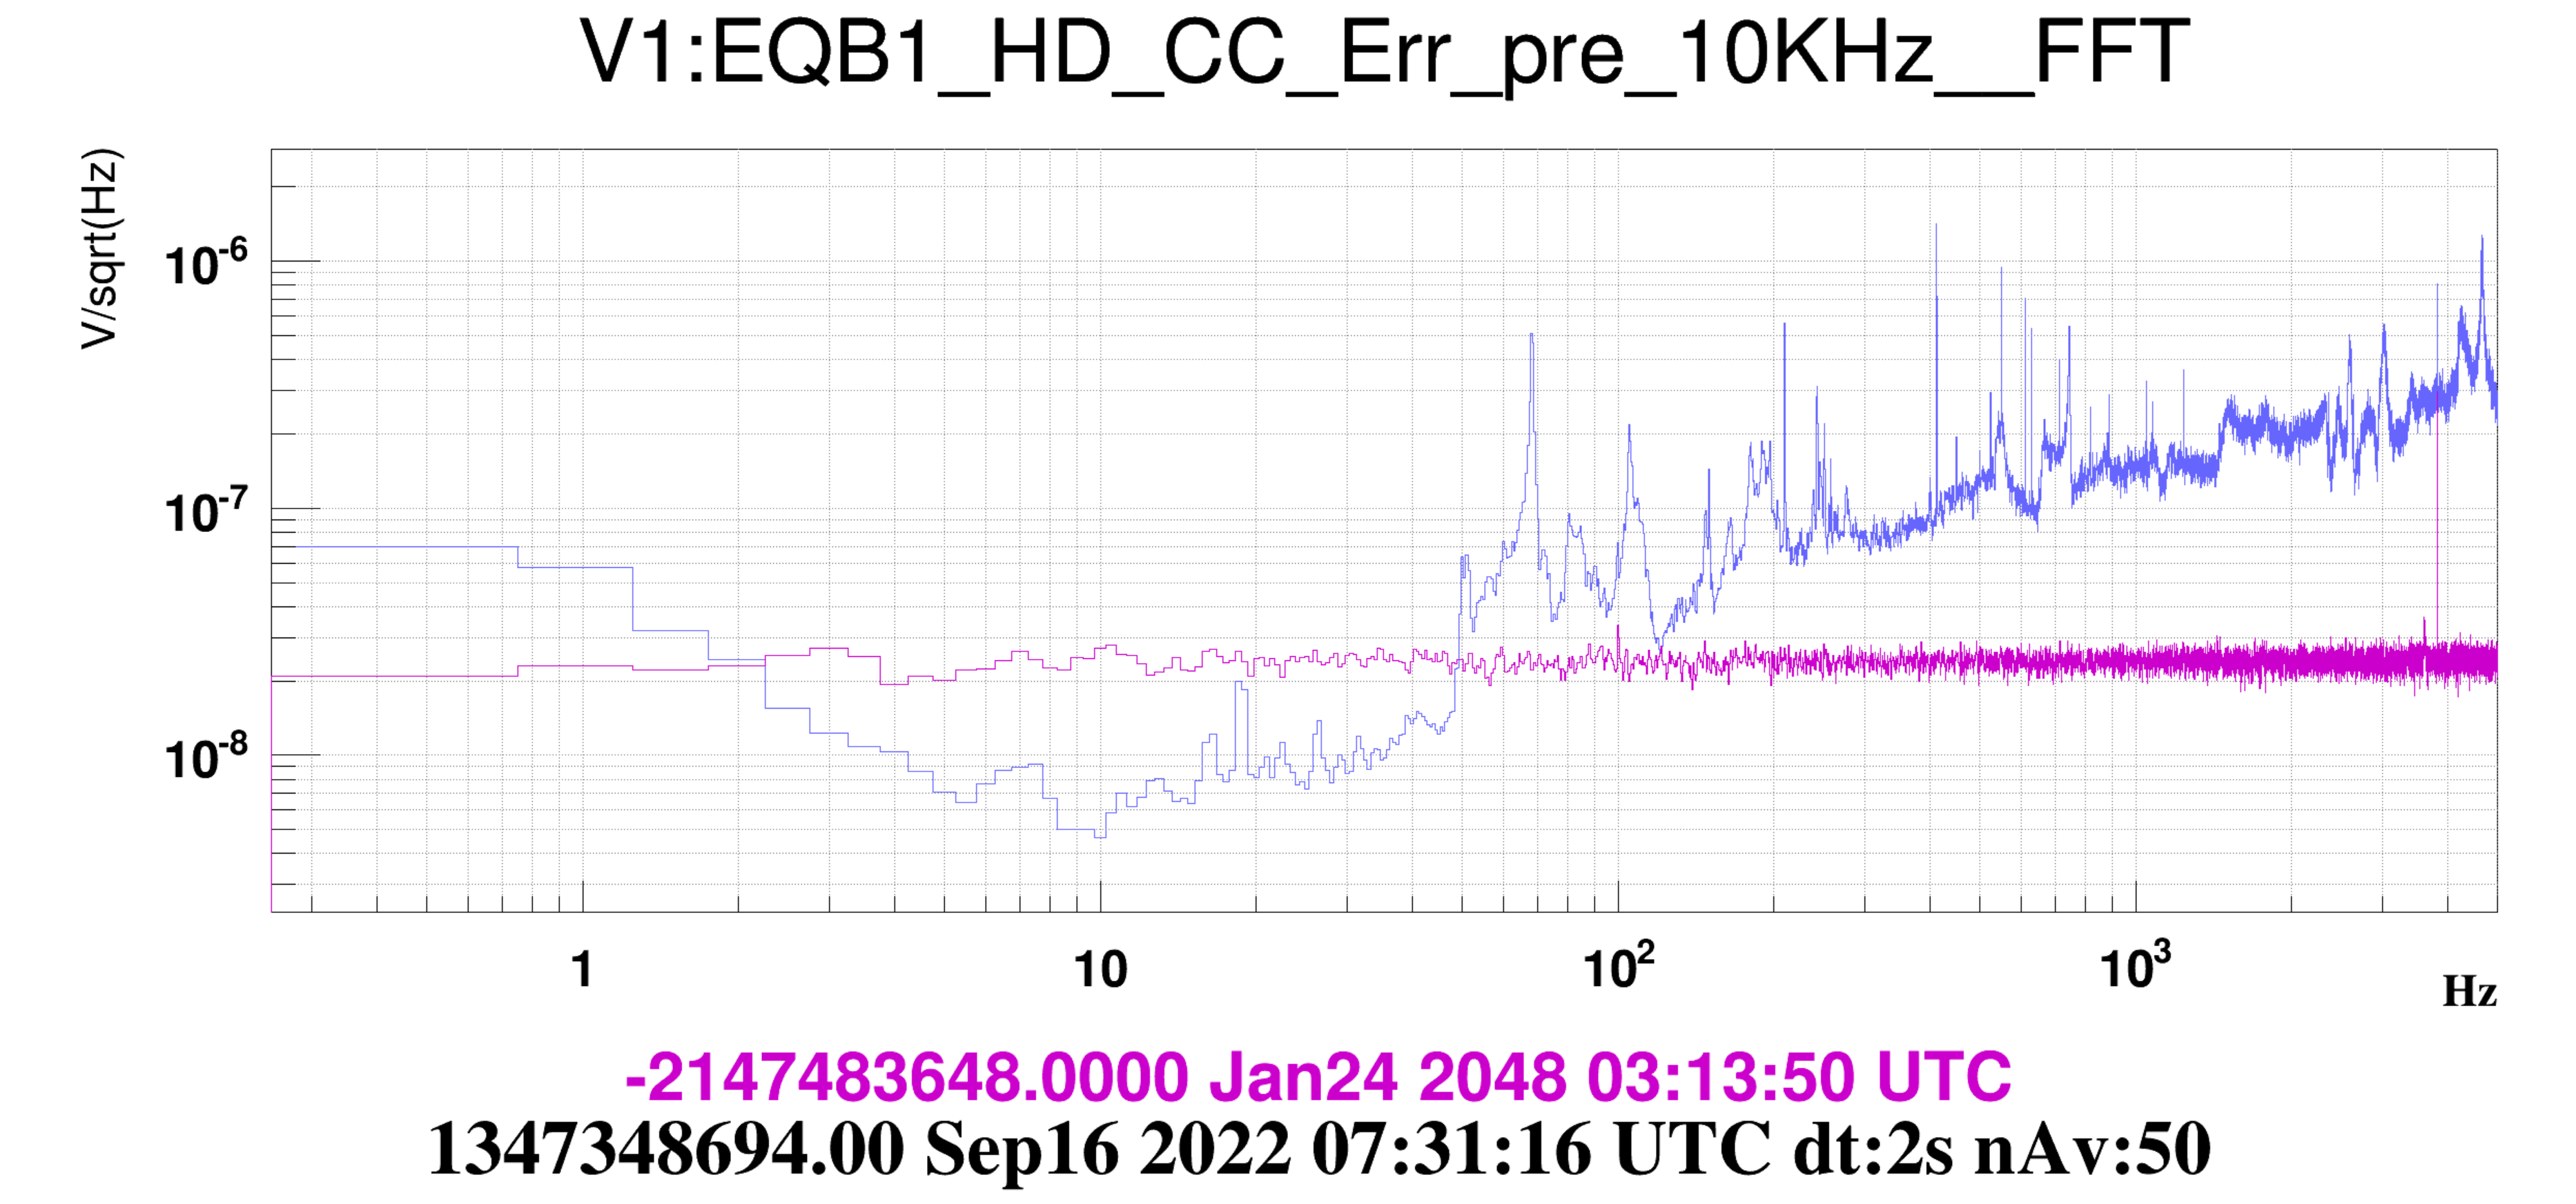
- we measured the sensing noise of the CC loop, i.e. the spectrum of the signal EQB1_HD_CC_Err_pre with the IR_Shutter closed (only LO on HD detector). We compared it to the spectrum of the same signal with the CC loop closed (LO+SQZ+CC beams on HD). The shutter was closed at 08:56:27 UTC. We can see that above 50 Hz the loop is not limited by the sensing noise (Fig. 1)
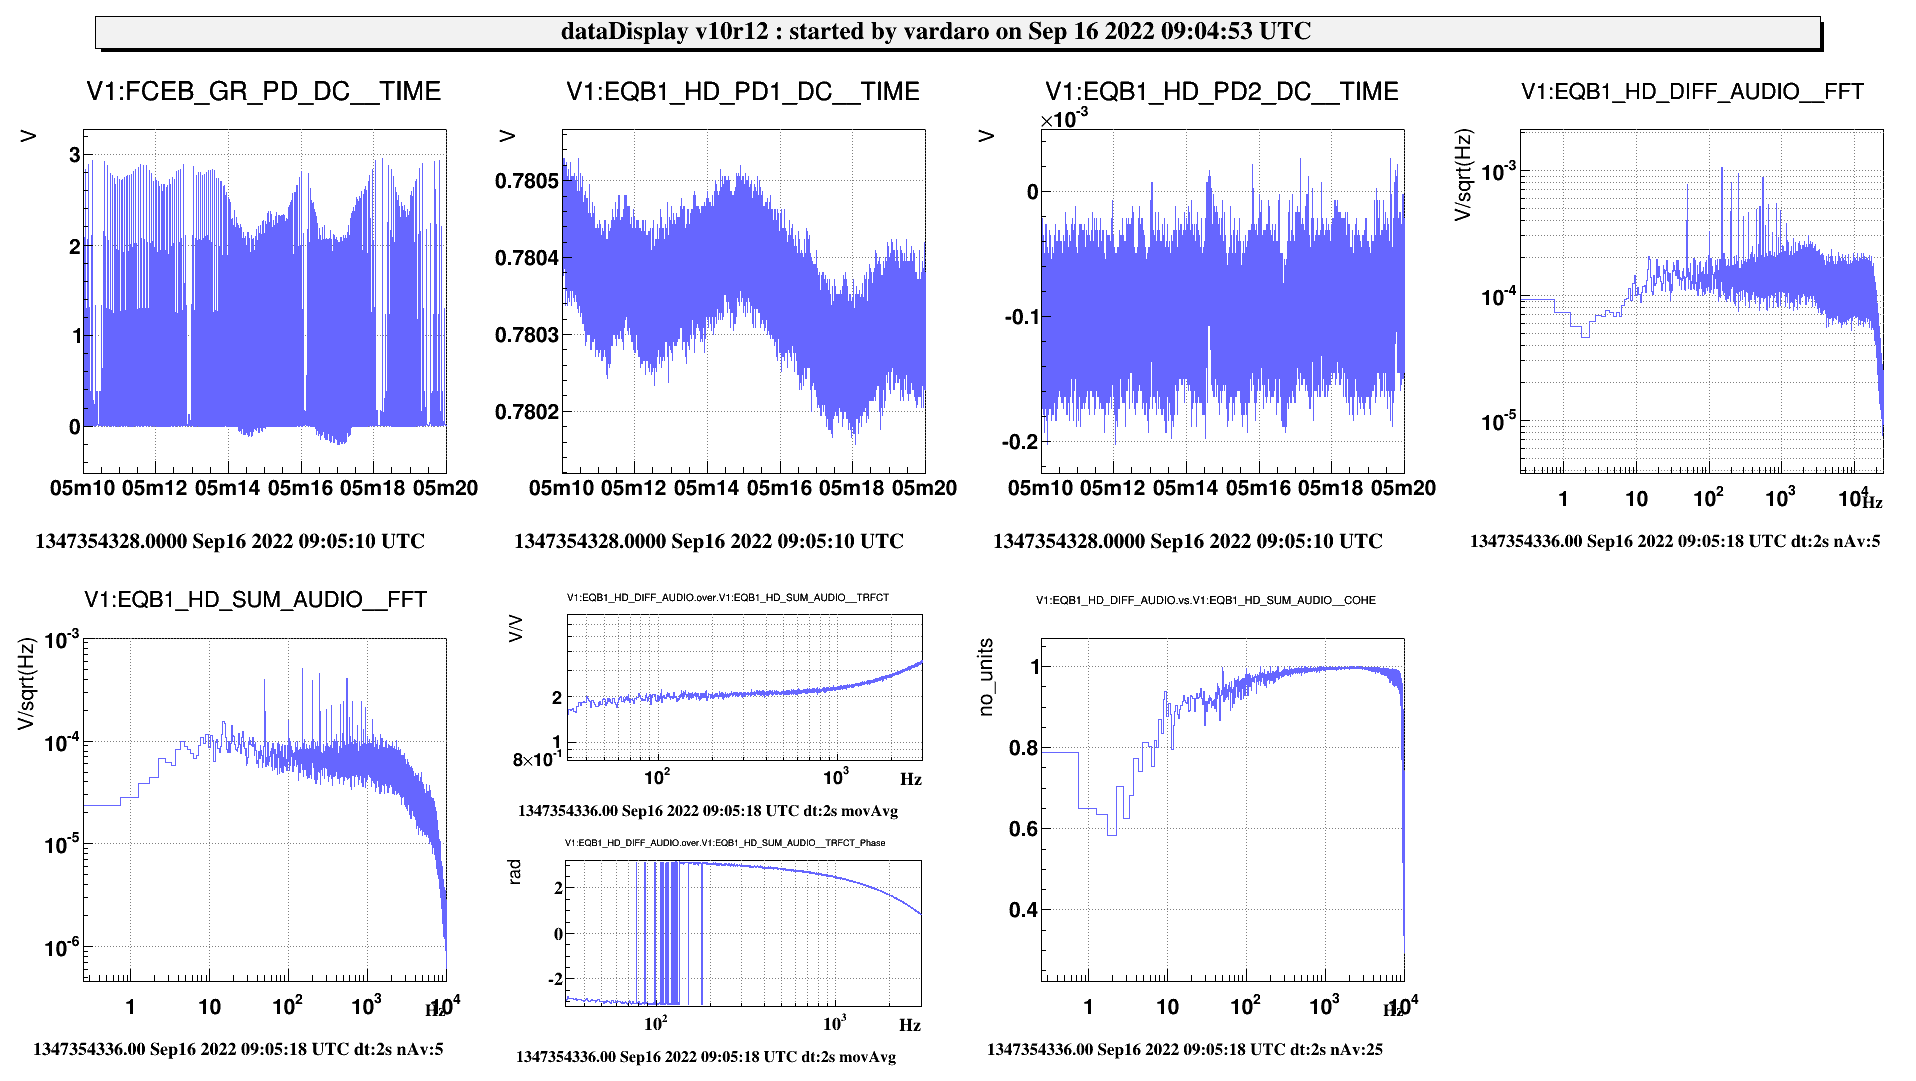
- Secondly we wanted to measure if the HD CMRR was still good. To do it we did the following things:
- Measure the HD Diff channel gain wrt the sum gain G*(PD1-PD2)/(PD1+PD2)=G if PD2=0. This could be obtained by shuttering the light in front of PD2, i.e. putting EQB1_HD_MIR to deflect the beam toward PD2. HD MIR was put at 09:04:09 UTC. Difference gain in figure 2, we measured 2.1.
- We removed HD MIR 09:09:00 UTC and we measure the CMRR doing the transfer function DIF/SUM. We measured a CMRR of 42 dB, but this measurement was not good because we where not injecting common mode noise into the HD Path.
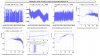
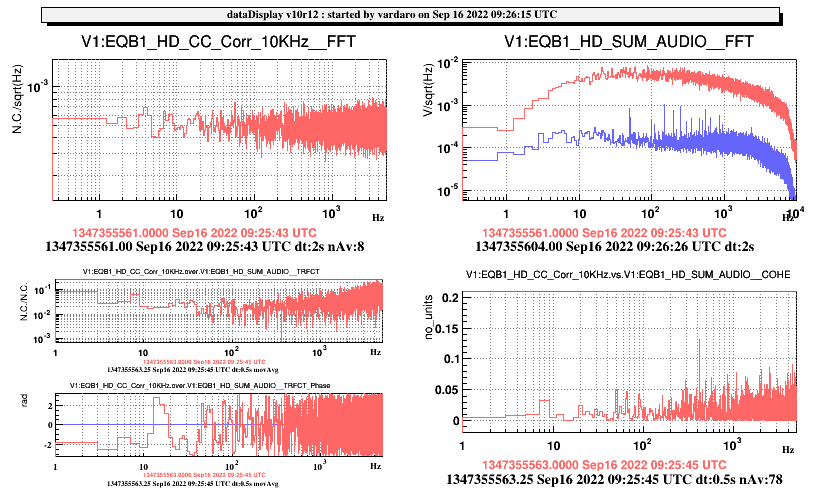
- We injected 0.0005 V of white noise into the LO PZT (HD CC actuator), we excited the sum by a factor 50. Fig 3. We choose the amplitude of the noise in order to have a linear response between HD SUM and noise level. With this noise we measured a CMRR of 66 dB (09:28:02 UTC). But we found a coherence between sum and difference of 0.4.
- We injected 0,00025 V of white noise 09:36:40 UTC. Now the coherence is 0.12 but the CMRR remained quite the same 64 dB
- We injected 0.000125 V of noise 09:39:00 UTC. The coherence was 0.04 and the CMRR remained quite the same 62 dB. Thus we can infer that we have a CMRR > 60 dB. This is not limiting our measurement.
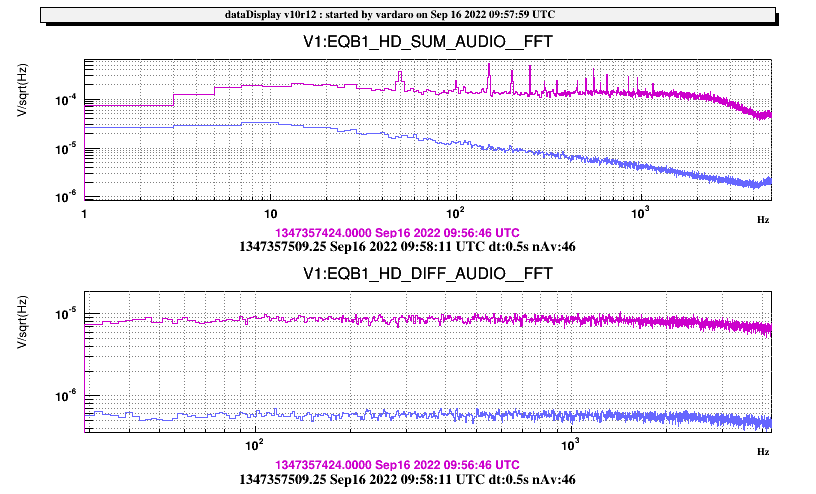
- We checked also the HD Shot noise clearence: we measured before the spectrum of the HD DIFF AUDIO channel with only LO 09:55:30 UTC (shot noise) and than we closed the LO shutter at 09:57:45 UTC. We measured 23 dB of clearence (about 1% of losses), see fig 4.
- The spectrum of 15th september Pump power scan, Fig 4 of previous entry, are filled of lines. We know from tapping tests in the past that some of them are due to vibrations of Mirrors mount. Thus we tried to insulate better the OPA from scattered light, i.e. we tried to rotate the HWP on EQB1 to improve the isolation factor of the EQB1 FI.
- We started at 10:03:48 UTC and we measure 6.4 dB of SQZ and 9.1 dB of ASQZ at 10:12:42 UTC.
- We moved +500 steps from the initial at 10:18:39 UTC and we worsened the situation, more peaks and 6.2 dB of SQZ
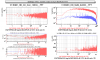
- We moved other +500 steps 10:20:10 UTC, we measured 5.8 dB of SQZ and 9 dB of SQZ. The structures on the spectrum increased a lot. (Fig 5.)
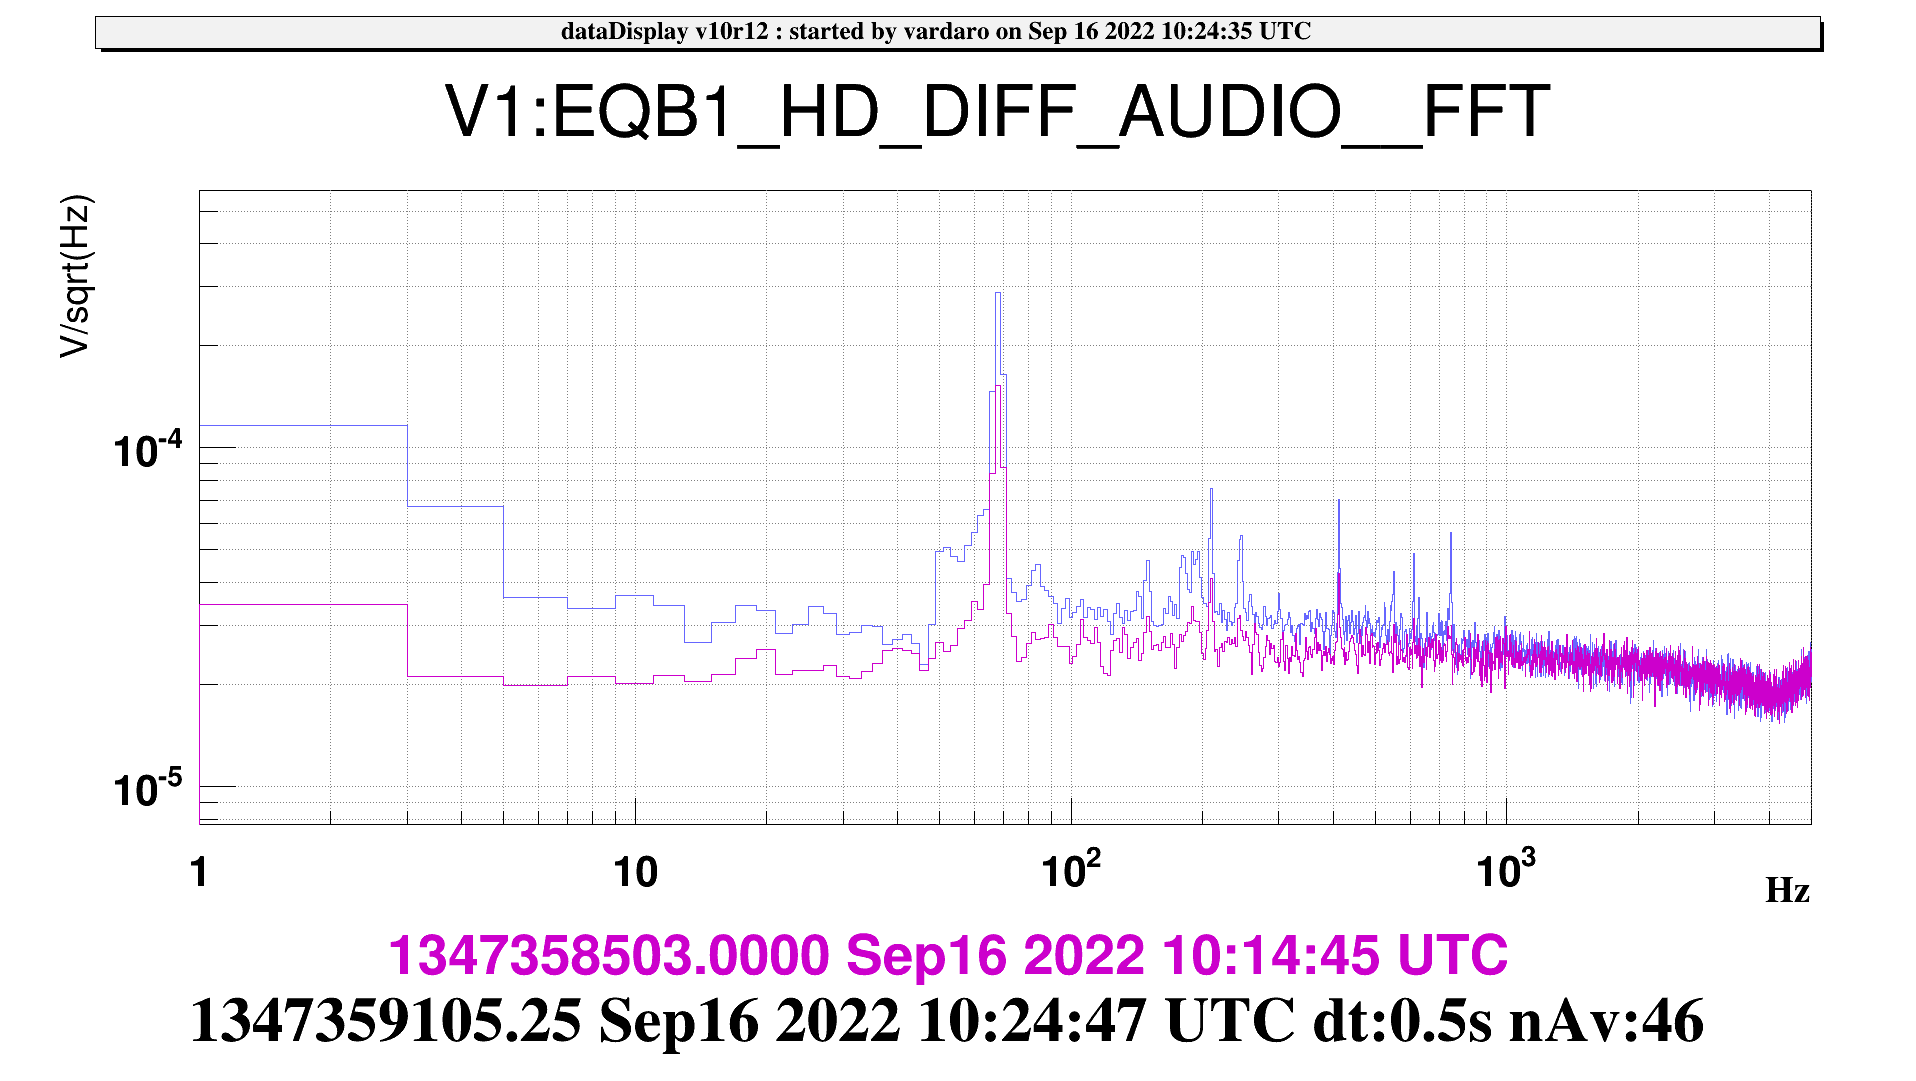
- We started to go in the opposite direction and after -2800 steps at 10:32:05 UTC we removed the peaks and we measured 6.7 dB of SQZ see figure 6. Then we tried to fine tune the HWP to see if we could improve again the situation.
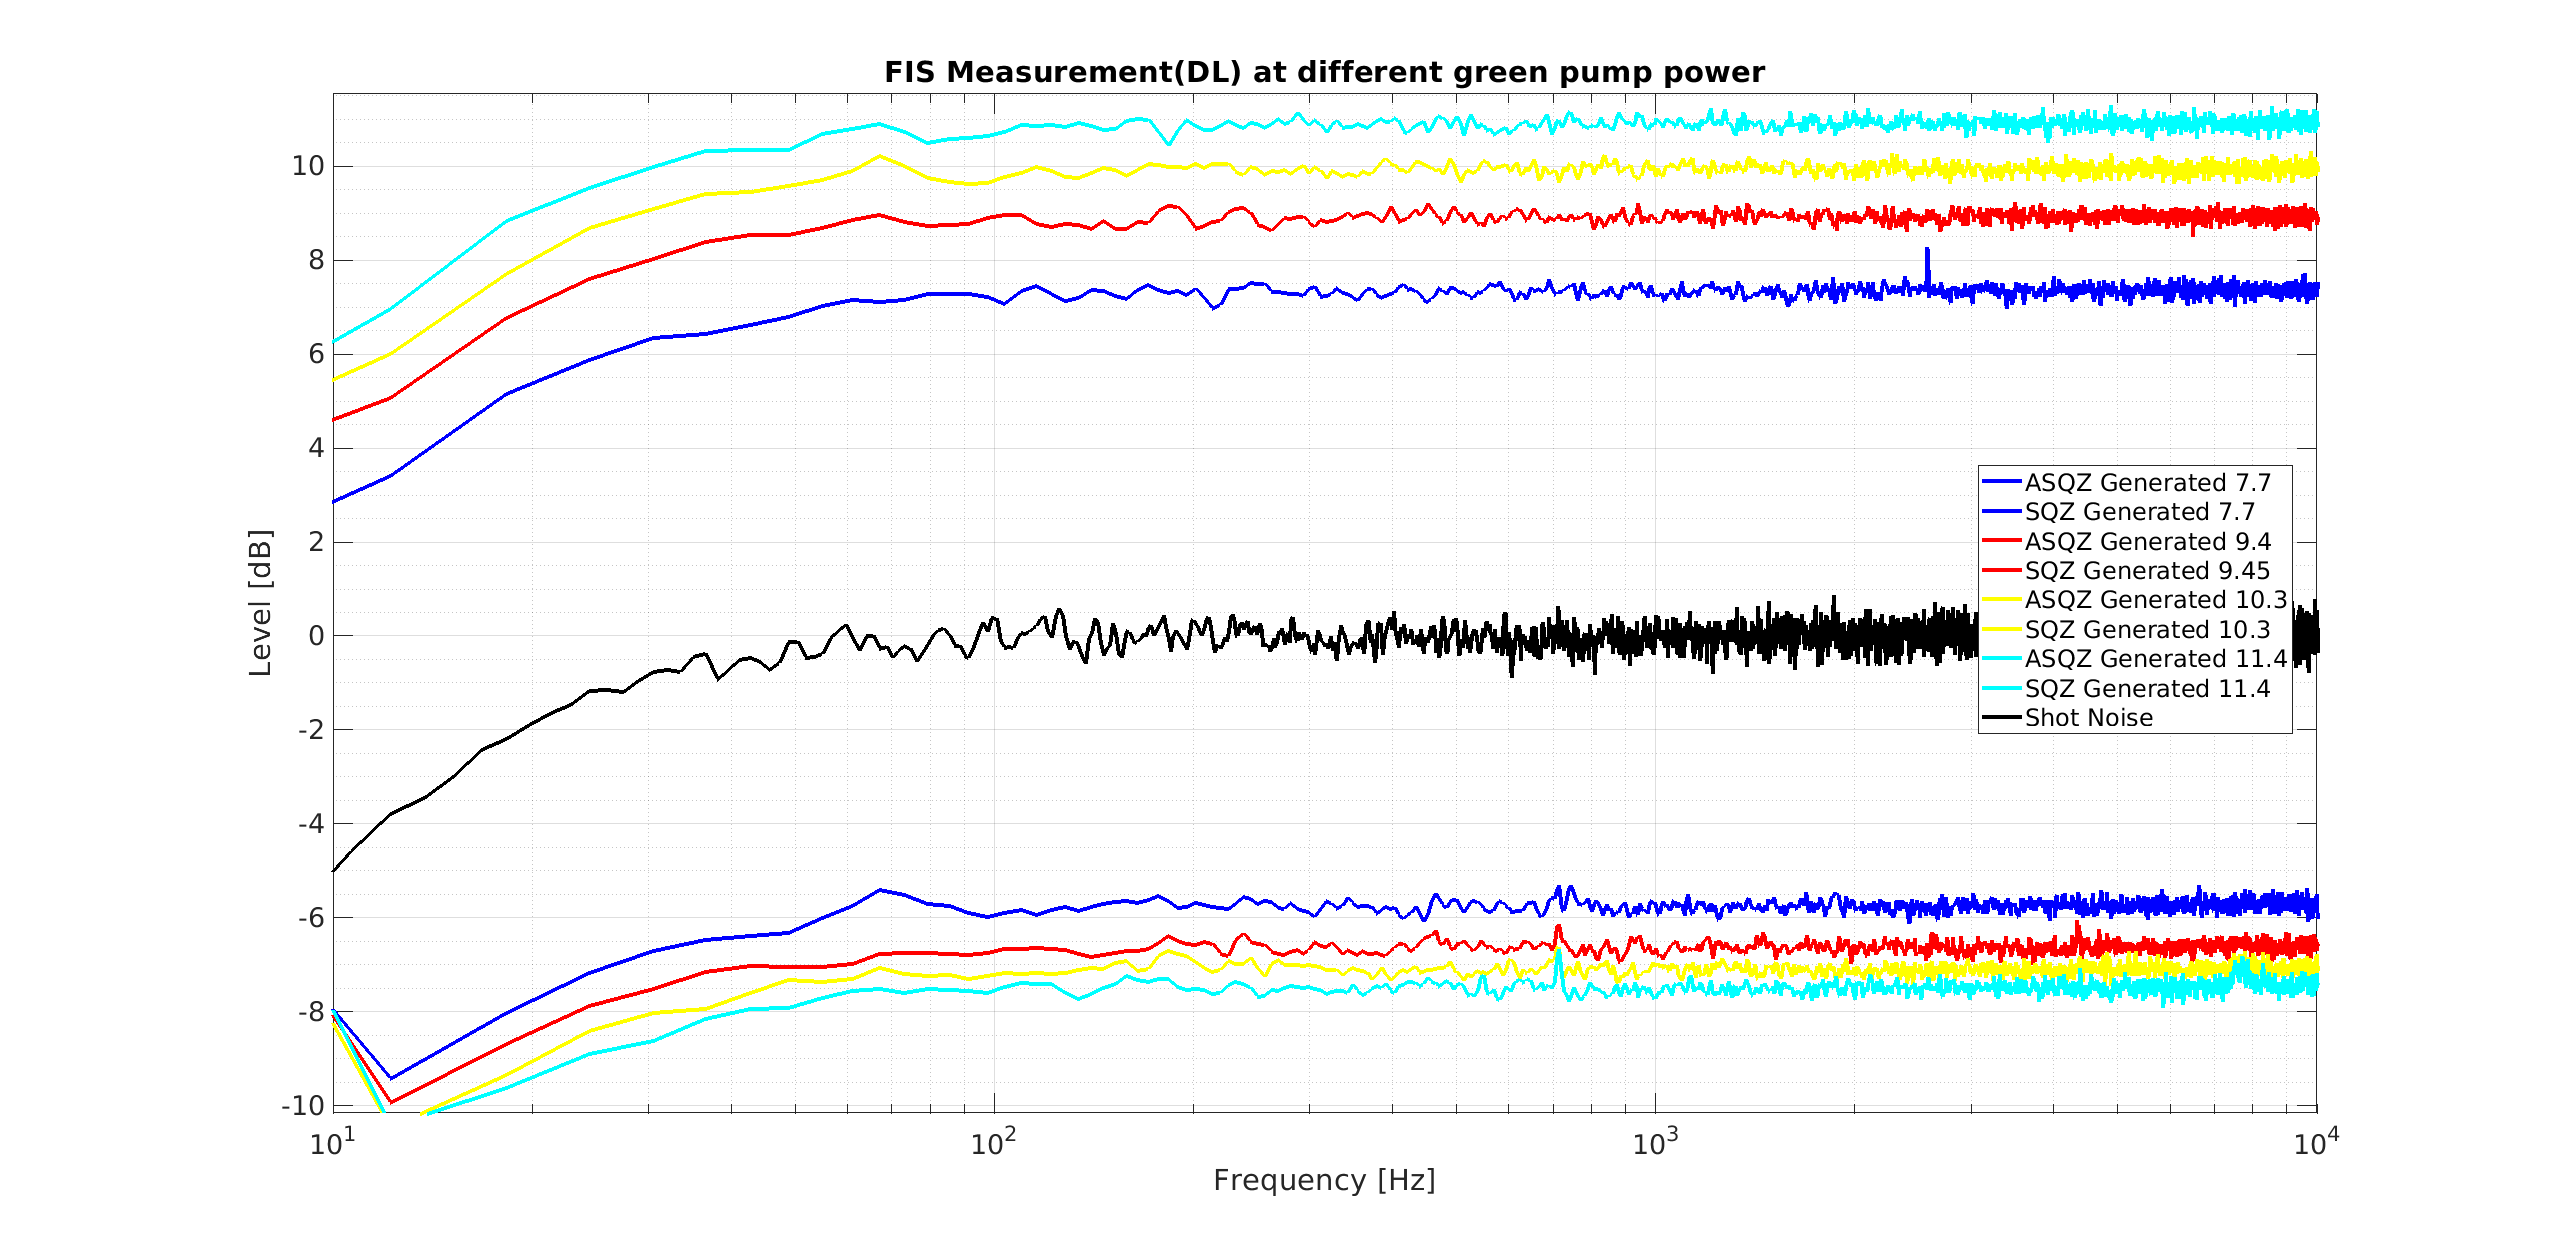
After the HWP tuning we decided to do another grenn pump power scan:
| MZ offset | Parametric Gain | GPS CC Open | GPS SQZ | phi SQZ | SQZ level | GPS ASQZ | phi ASQZ | ASQZ level | notes |
| 0 V | 9.19/3.125=2.94=9.4dB | 11:31:15 UTC | 11:23:50 UTC | 2.25 rad | 6.7±0.1 dB | 11:28:43 UTC | 0.86 rad | 8.9±0.1 dB | at least 2 min of spectra |
| 0.05 V | 10.03/3.065=3.27=10.3dB | 13:32:15 UTC | 13:12:50 UTC | 2.25 rad | 7.1±0.1 dB | 13:17:10 UTC | 0.86 rad | 9.9±0.1 dB | at least 2 min of spectra |
| 0.1 V | 10.82/2.87=3.77=11.5dB | 12:36:35 UTC | 12:27:30 UTC | 2.2 rad | 7.5±0.1 dB | 12:32:10 UTC | 0.92 rad | 10.9±0.1 dB | at least 2 min of spectra |
| -0.05 V | 8.19/3.207=2.55=8.14dB | 13:51:50 UTC | 14:09:00 UTC | 2.2 rad | 5.8±0.1 dB | 14:13:31 UTC | 0.9 rad | 7.5±0.1 dB | strange point discarded in the analysis |
| -0.055 V | 8.2/3.39=2.41=7.67 dB | 16:06:50 UTC | 15:28:52 UTC | 2.3 rad | 5.8±0.1 dB | 15:53:23 UTC | 0.82 rad | 7.3±0.1 dB | at least 2 min of spectra |
After the measurement we take a shot noise spectrum at 16:37:20 UTC.
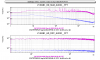
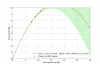
We fitted the data (Fig 7) and we obtained 11.0±0.5 % of losses (as yesterday) with 14±12 mrad (about 4 time less than yesterday).
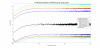
Fig 8 shows the spectra of the measurement that this time are flat. Note that the HP filter in the HD DIFF audio channel change the shot noise shape up to 50 Hz. We will correct the spectra with a correction function.
Next steps on SQZ measurements
- we should understand if the LO scattered light scattered by HD PDs is the cause of the stray light. To do it we could measure SQZ by decreasing the LO power.
- Repeat the mump power scan with the SQB1 back reflecor. Here we can add an additional FI, thus we can see if adding a faraday, more isolation for the OPA, it is possible to improve again the measurements.
Tuning of GR Automation parameters
During the measurement we also changed some parameter of the automation SQZ_FLT. This was done without passing through git.
- The gain of the BPC (weight of GR_M5 and GR_M7 BPC_2) was decreased from -1 to -0.2 (factor 5)
- In the function that checks the green transmission we change the factor 0.9 in a factor 0.5
- In the function that checks the green AA we changed the thresholds from 1 to 10
- In the function that checks the green BPC2 we changed the thresholds from 0.4 to 20
After this change the cavity remained locked for more time without unlock for the thresholds too narrow ( we had a very windi condition). Moreover the BPC gain lowered by a factor 5 helped a lot to avoid misalagnement of the cavity between a lock and the following one. The threshold should be better tuned the next week.
