We performed a comparison of the INJ system before and after the intervention of last week.
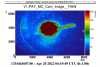
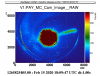
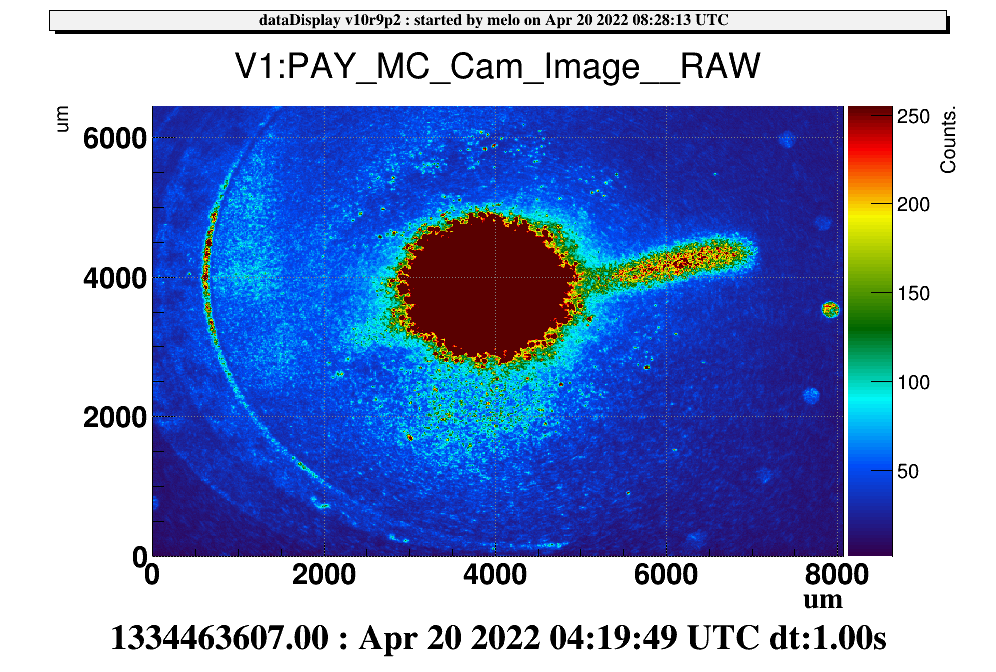
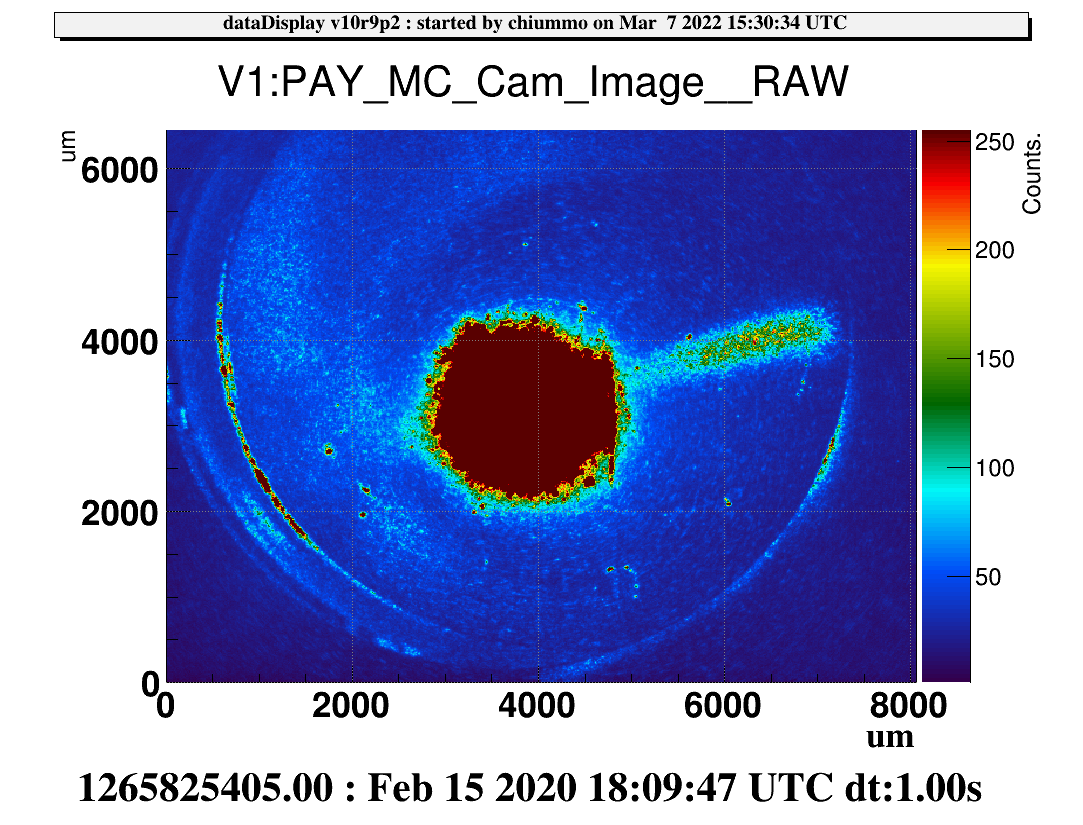
First, we compared the image of the beam on the camera (MC_Cam). The first figure shows the image of the beam on April 7th (before the towers were opened) and the second figure shows the beam on the 20th of April after the towers were closed and the INJ system was recovered. As can be observed there was not a significant visible change according to the images. Just for reference, on the third picture we can see an image of the beam during O3, when the transmitted power of the MC was 27W.
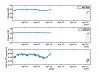
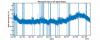
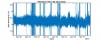
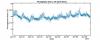
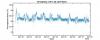
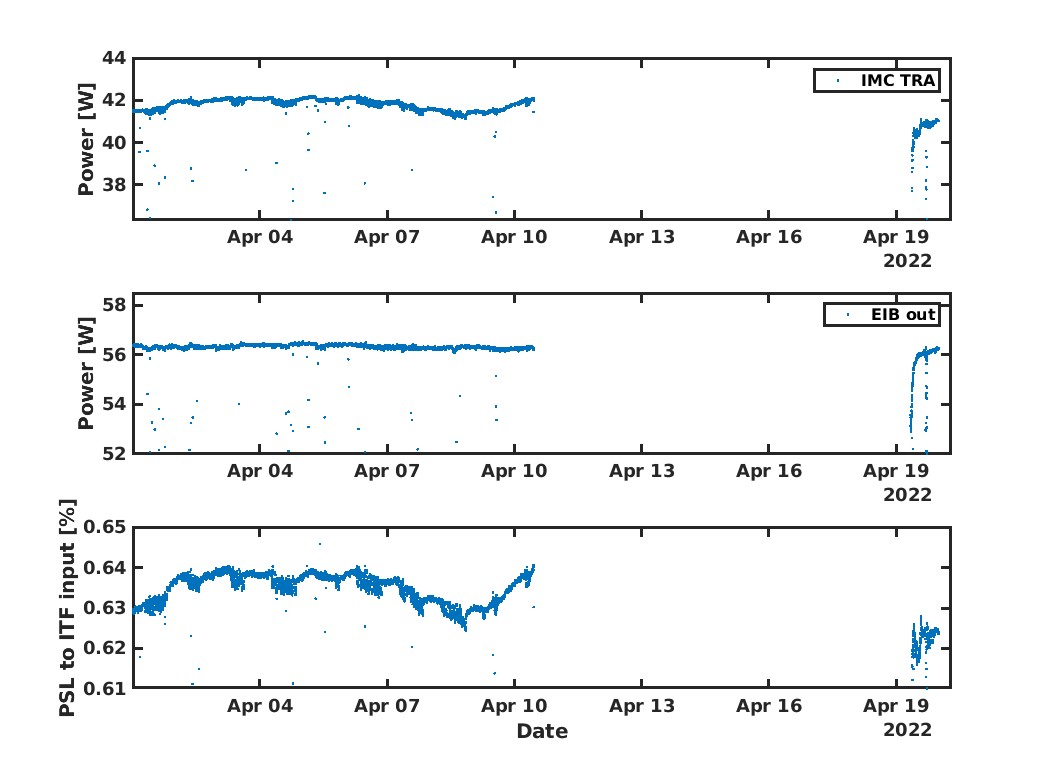
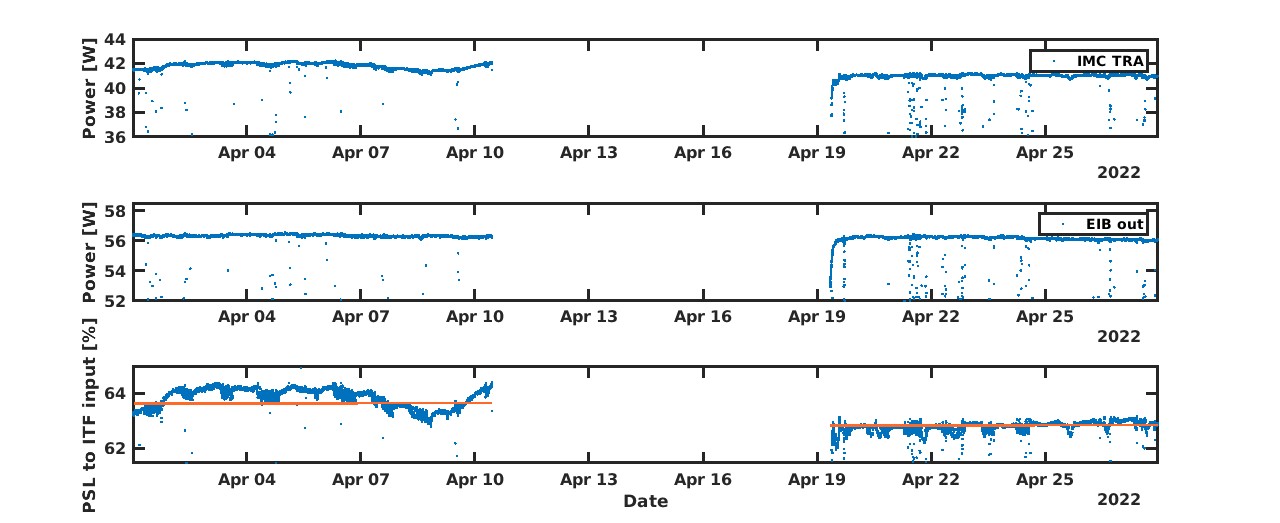
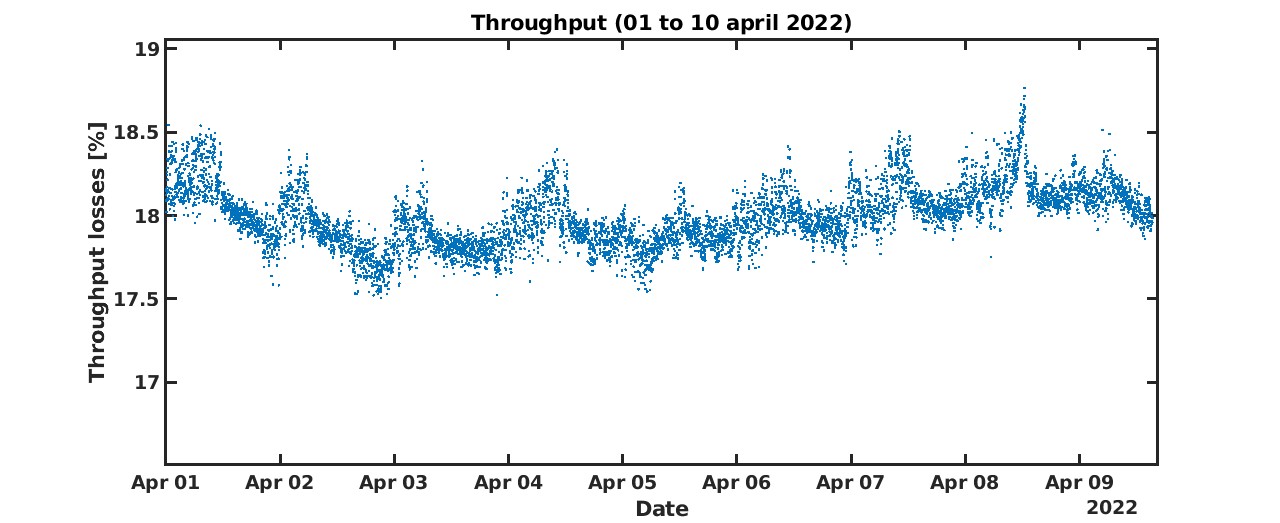
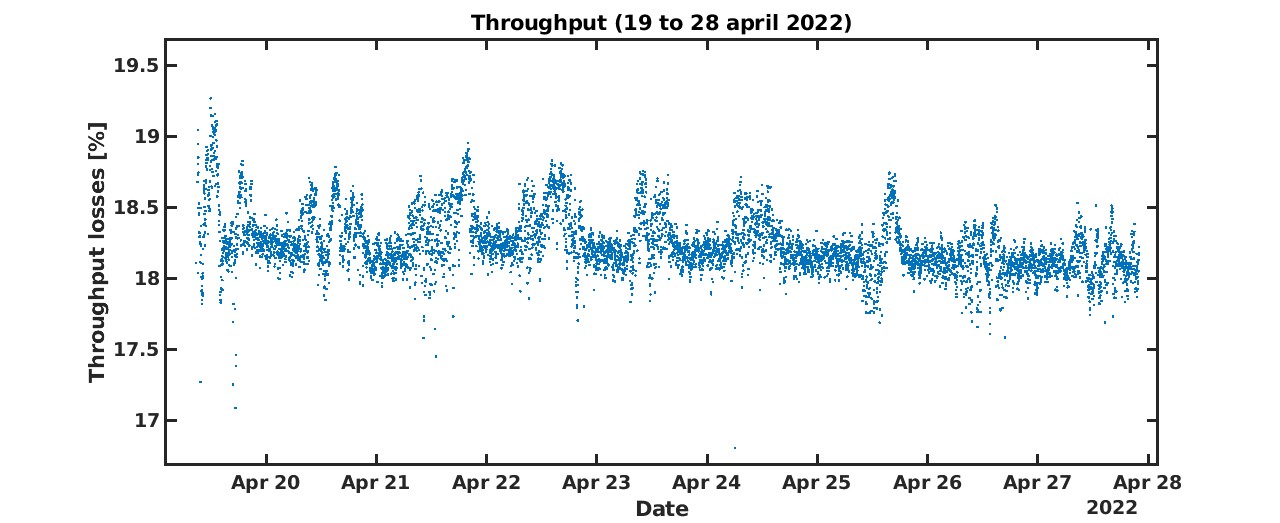
Then, on the fourth plot we can see the power trend of the transmission of the Mode Cleaner (top graph), the power going towards the Mode Cleaner (middle graph) and the throughput of the injecton system (bottom graph), i.e., is the ratio between the calculated power at the output of the PMC (we have estimated 7% losses from the output of the PMC to the output of EIB) and the power at the input of the interferometer (which is estimated to be 7.5% less w.r.t the output of the IMC due to SIB1 losses). As we can see the throughput has slightly decreased (around 1.5%).
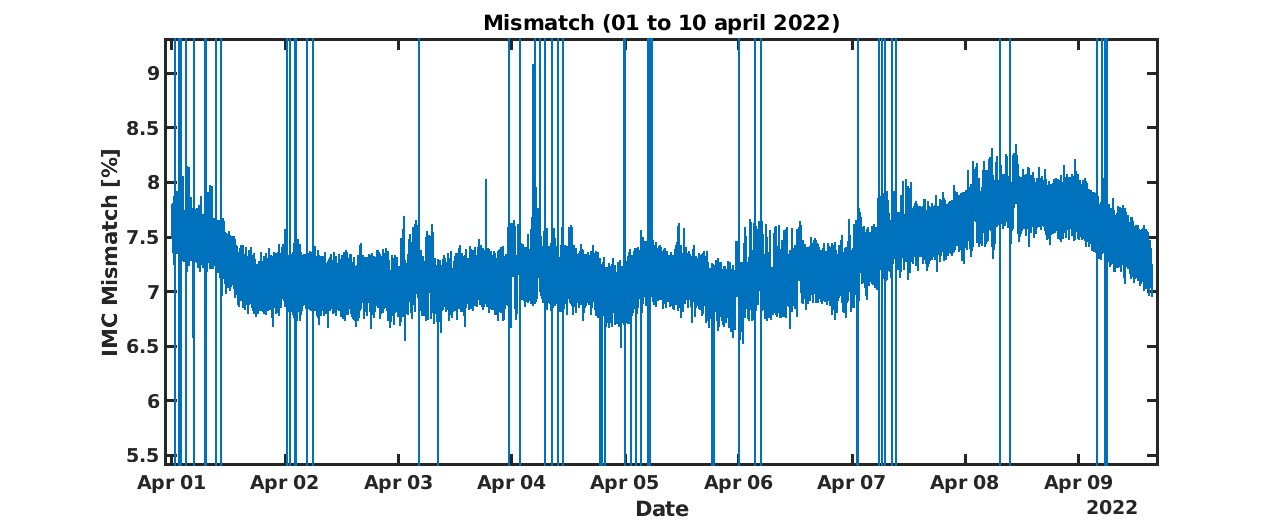
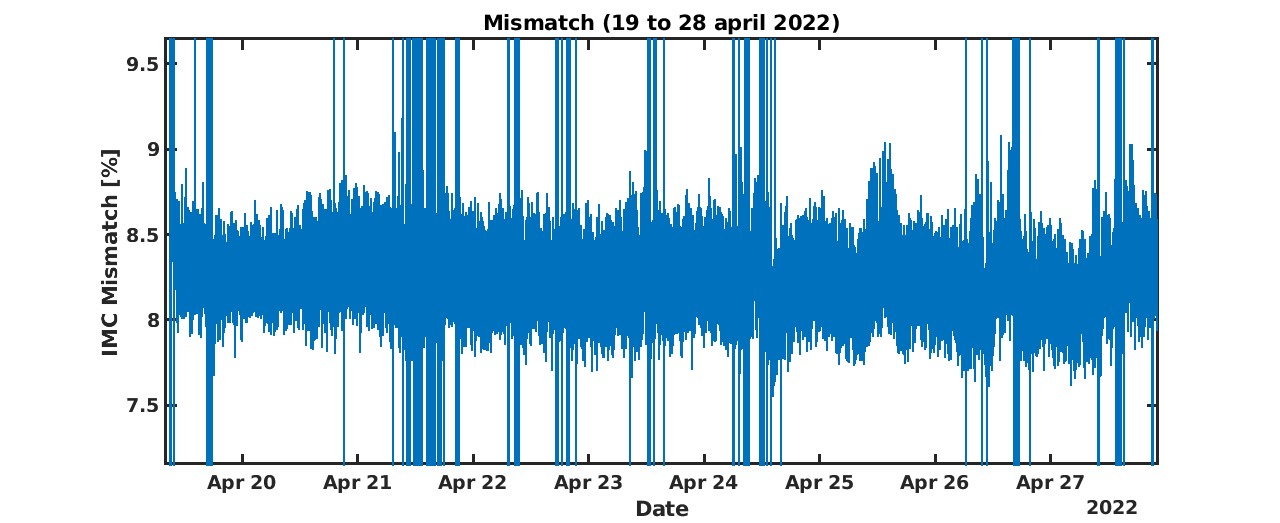
We have also calculated the intracavity losses of the IMC, as can be found in the table below:
| Mismatch (%) | Throughput Losses (%) | |
| 09/04 (before intervention) | 8.7% | 17% |
| 20/04 (after intervention) | 9.3% | 17.2% |
These results show a 0.6% worsening of the mismatch and 0.2% of the intracavity losses.
