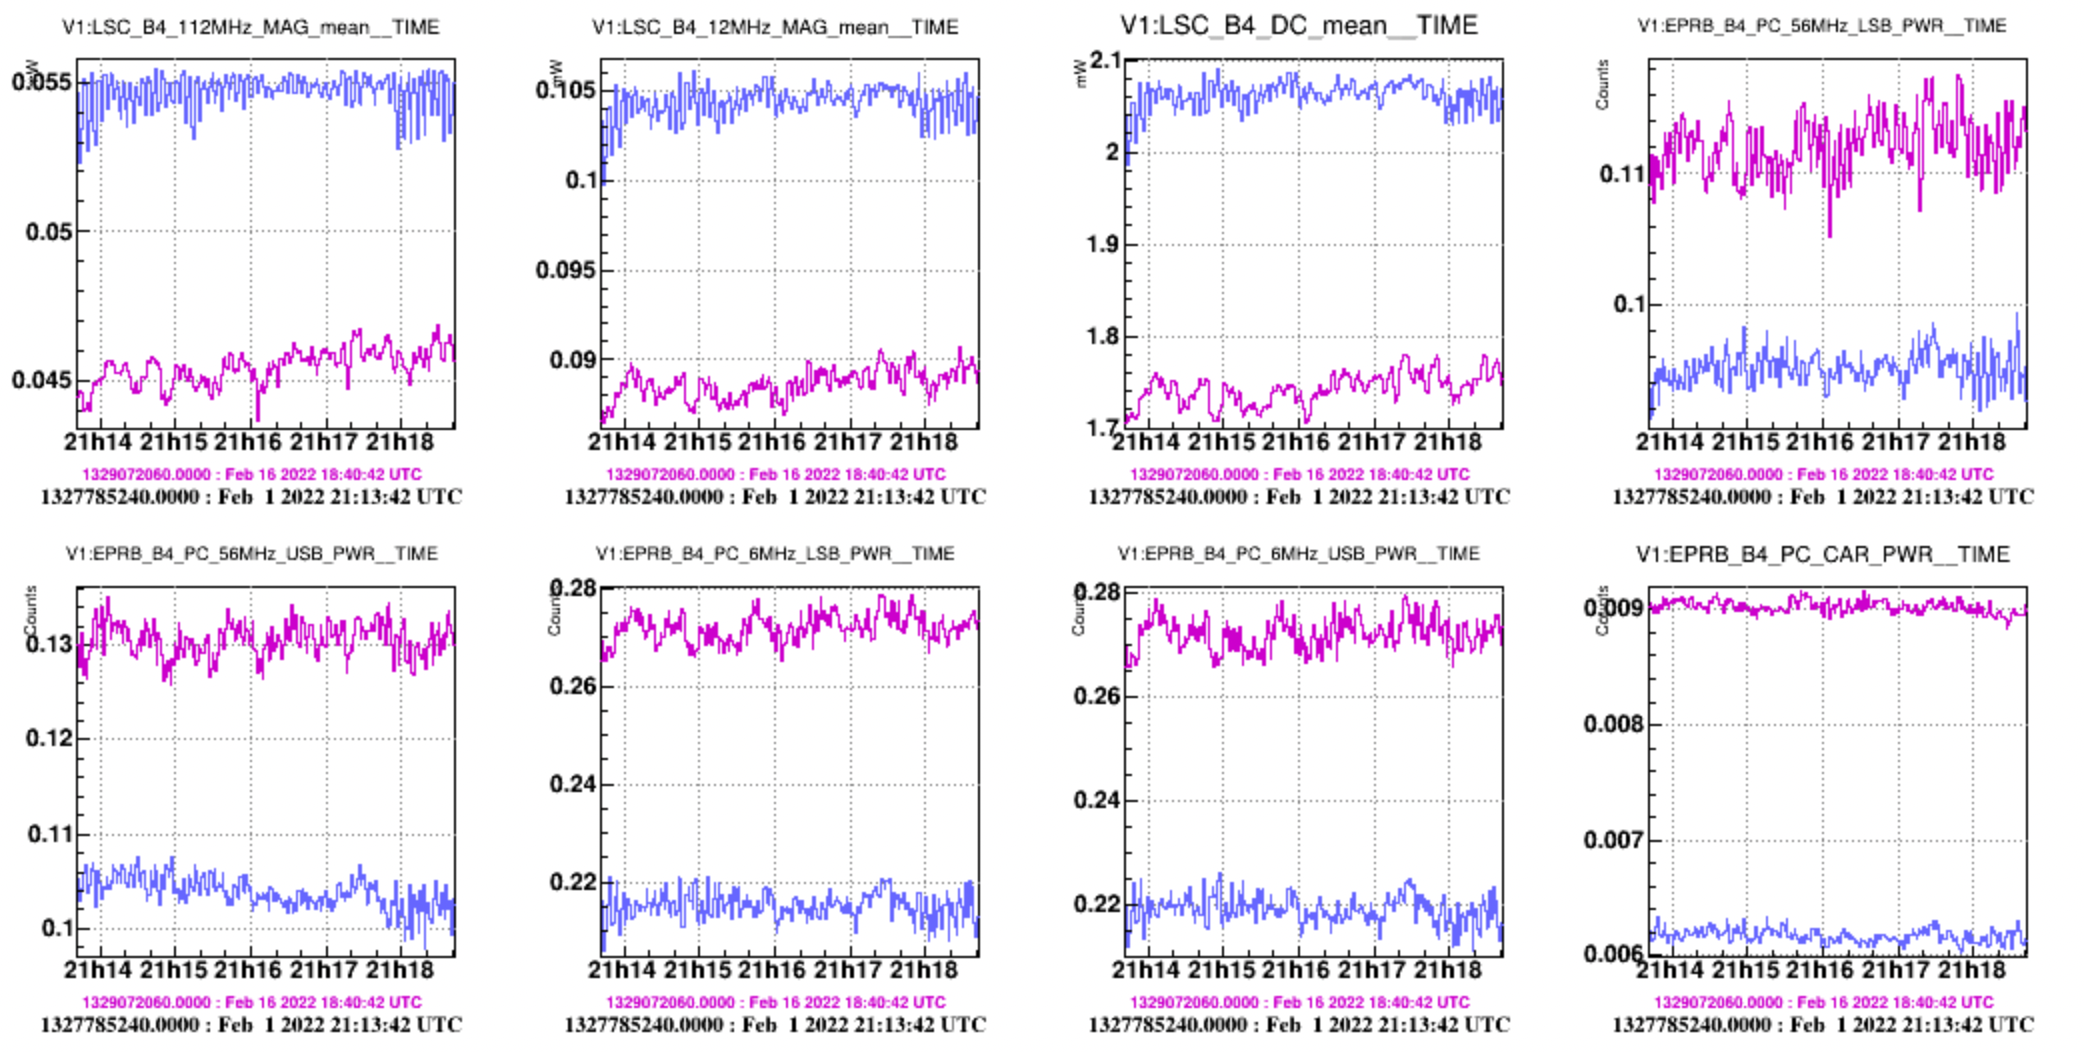
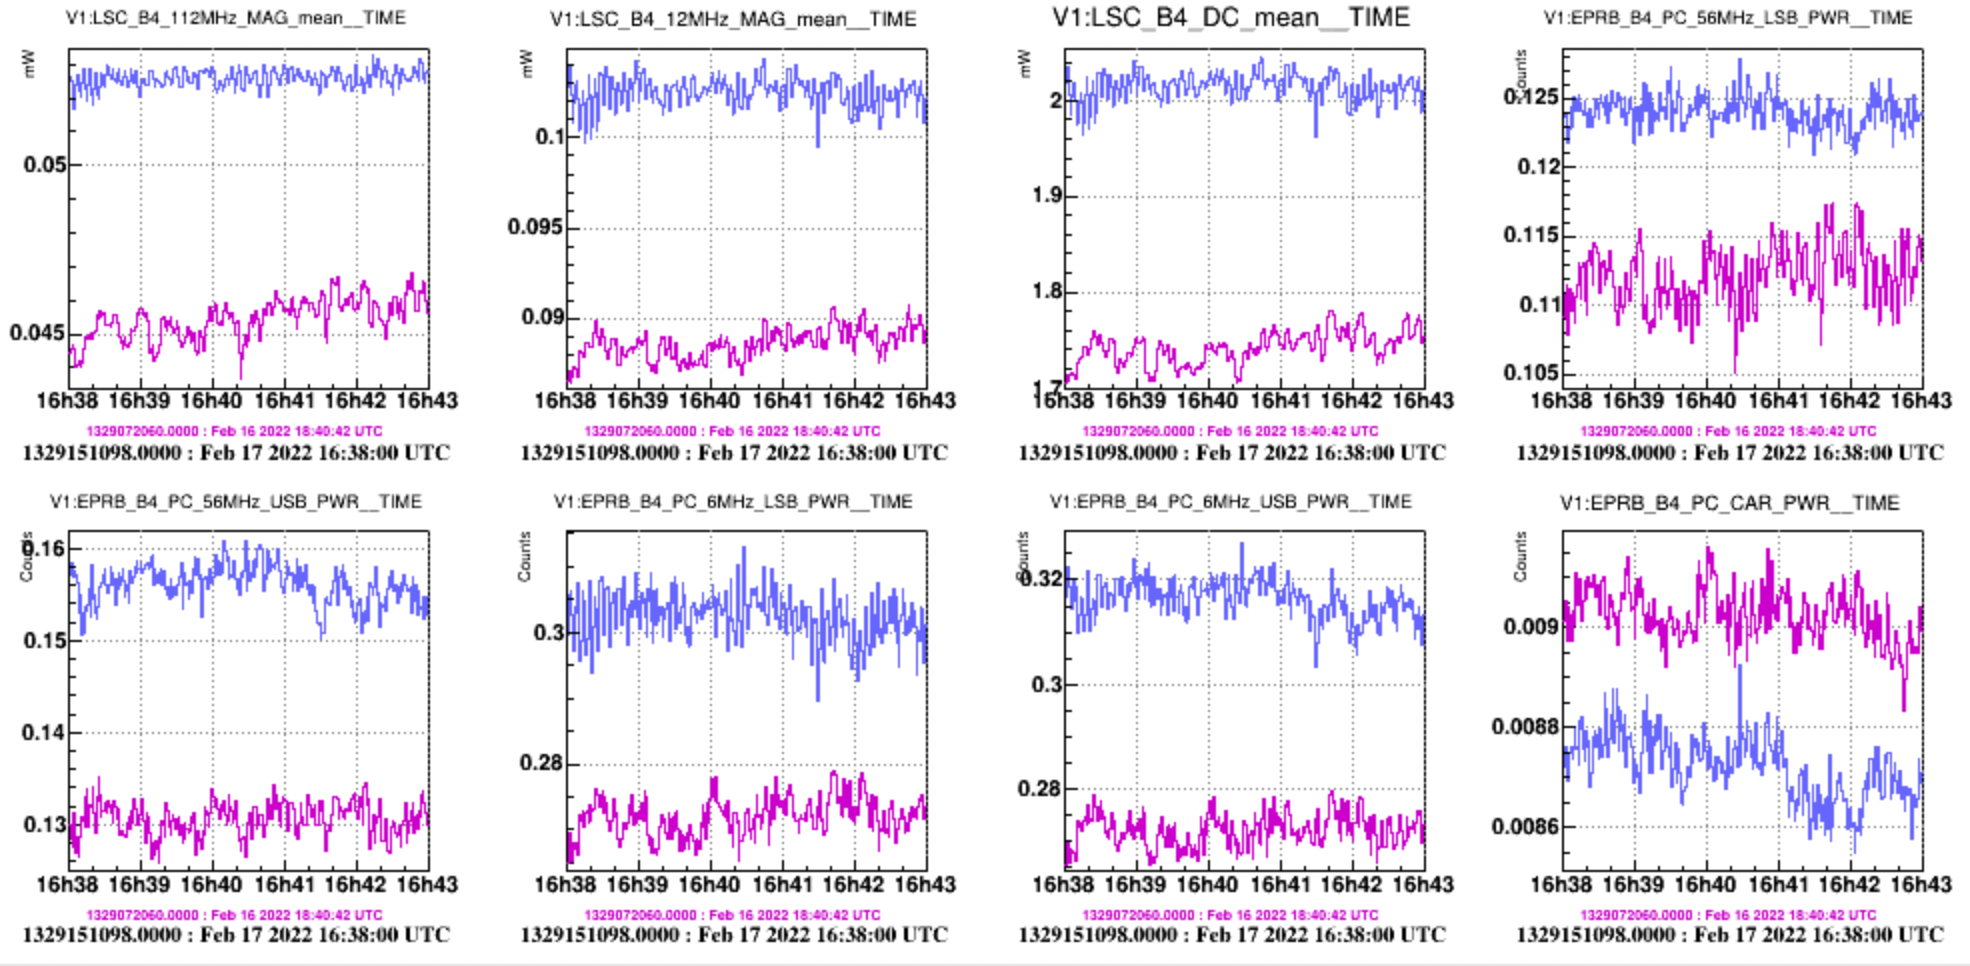
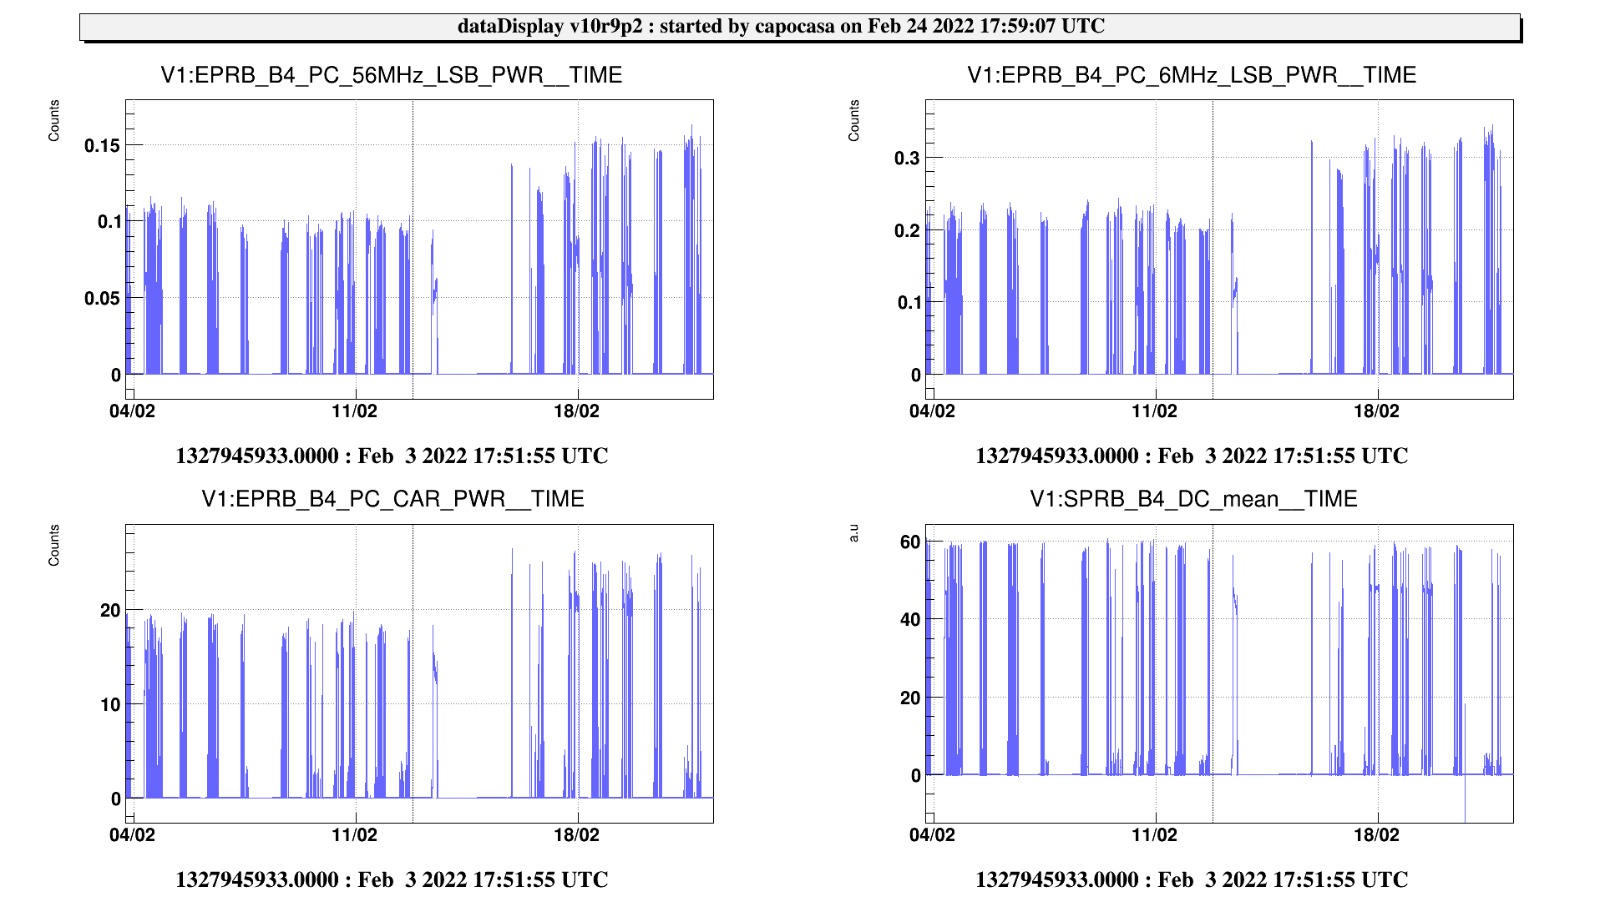
- Figure 1: trend of B4 signals both on the photodiode and the phase camera. It can be notice that after the work on the alignment of the cavities, all the signals of the photodiode are measuring lower powers than before. On the other hand, all the powers measured by the phase camera are higher than before. This is a bit strange, we could check the centering both of the photodiode and the phase camera.
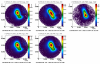
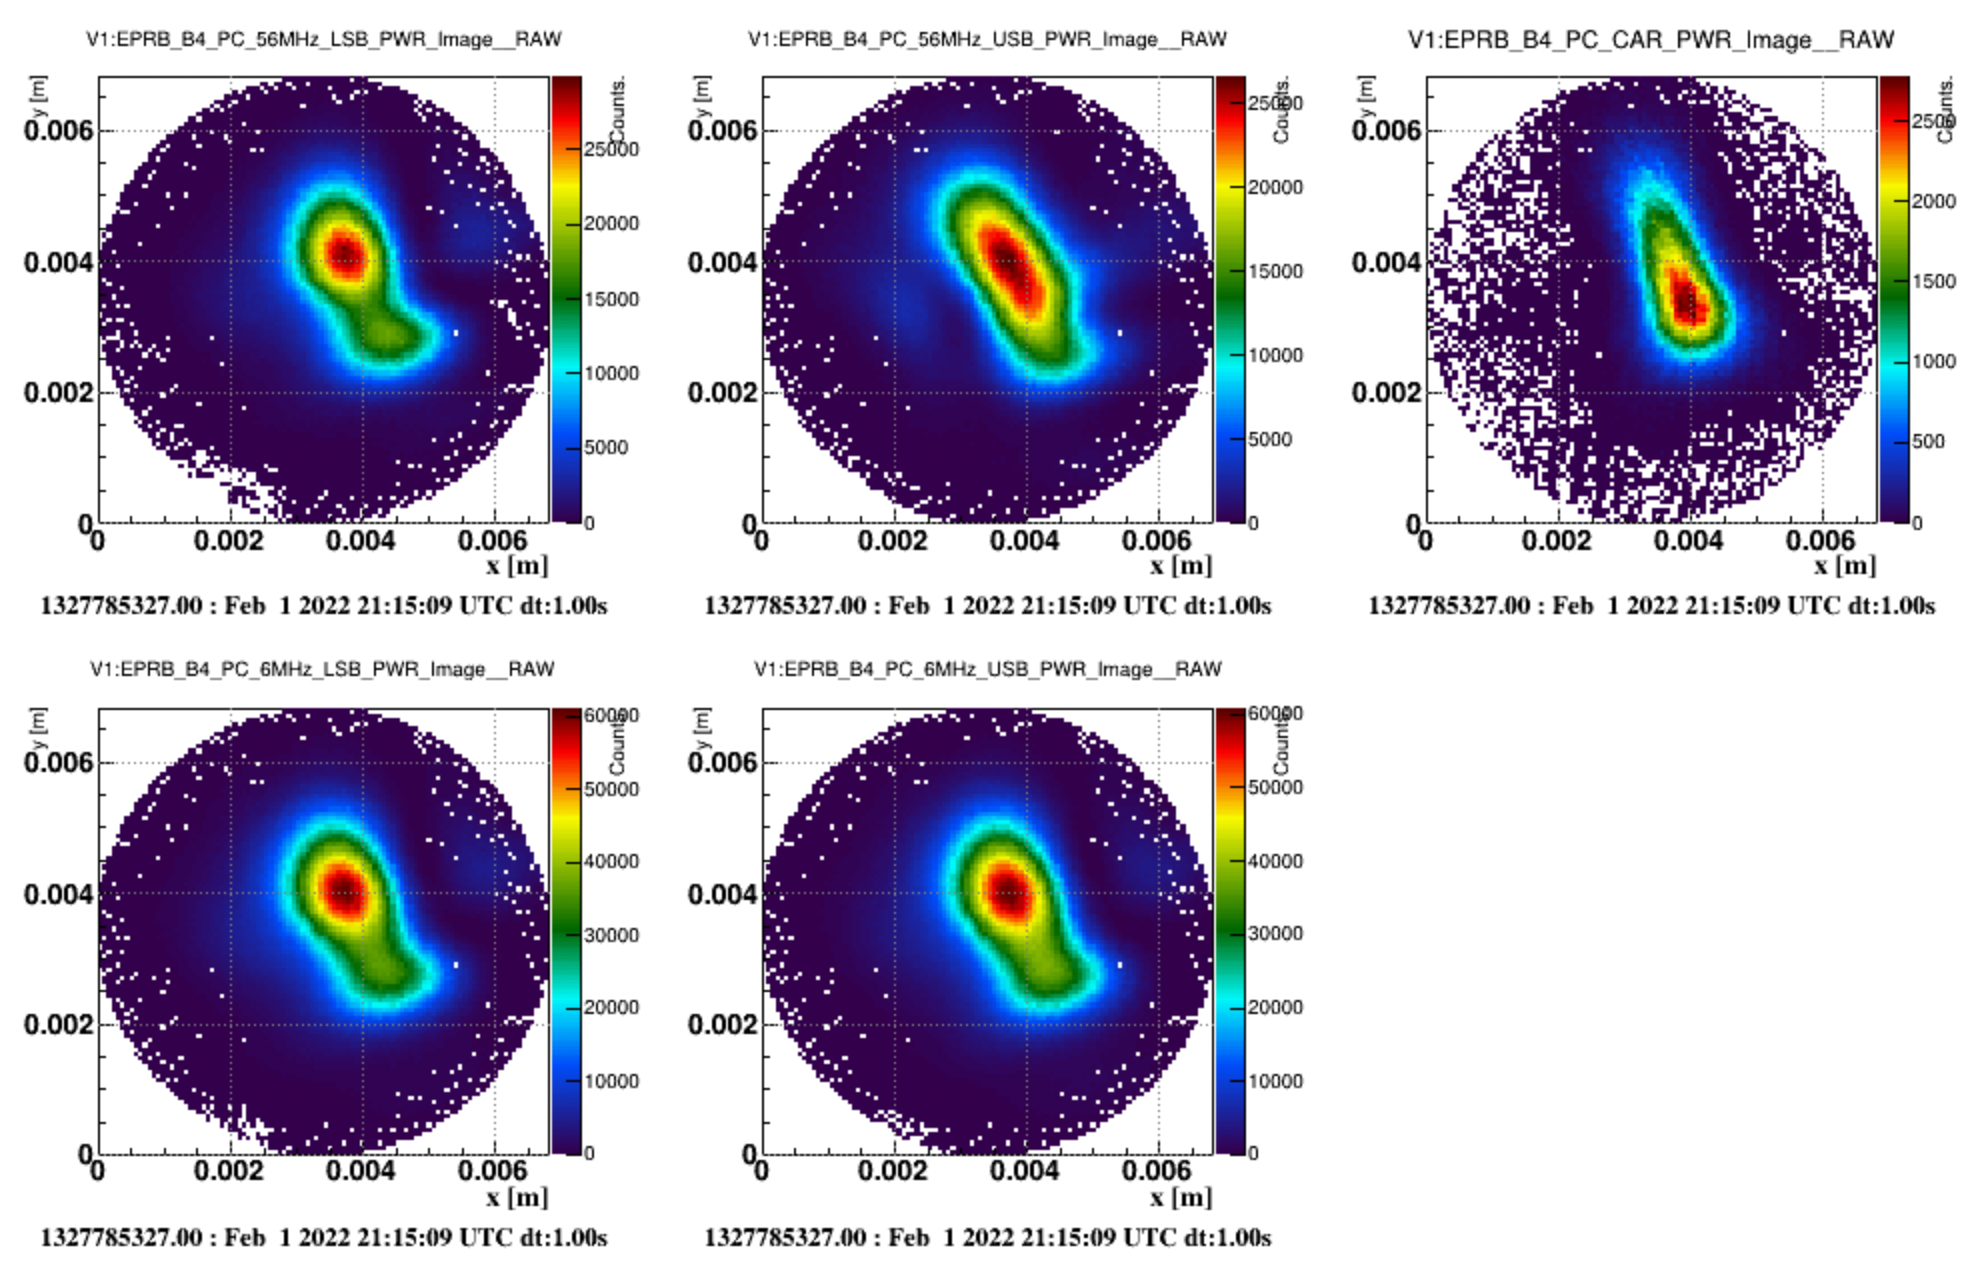
- Figure 2: images acquired by the phase camera before the work on the alignment of the cavity. The sidebands are not pure Gaussian but their are in agreement with what was measured in fall 2021.
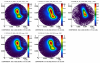
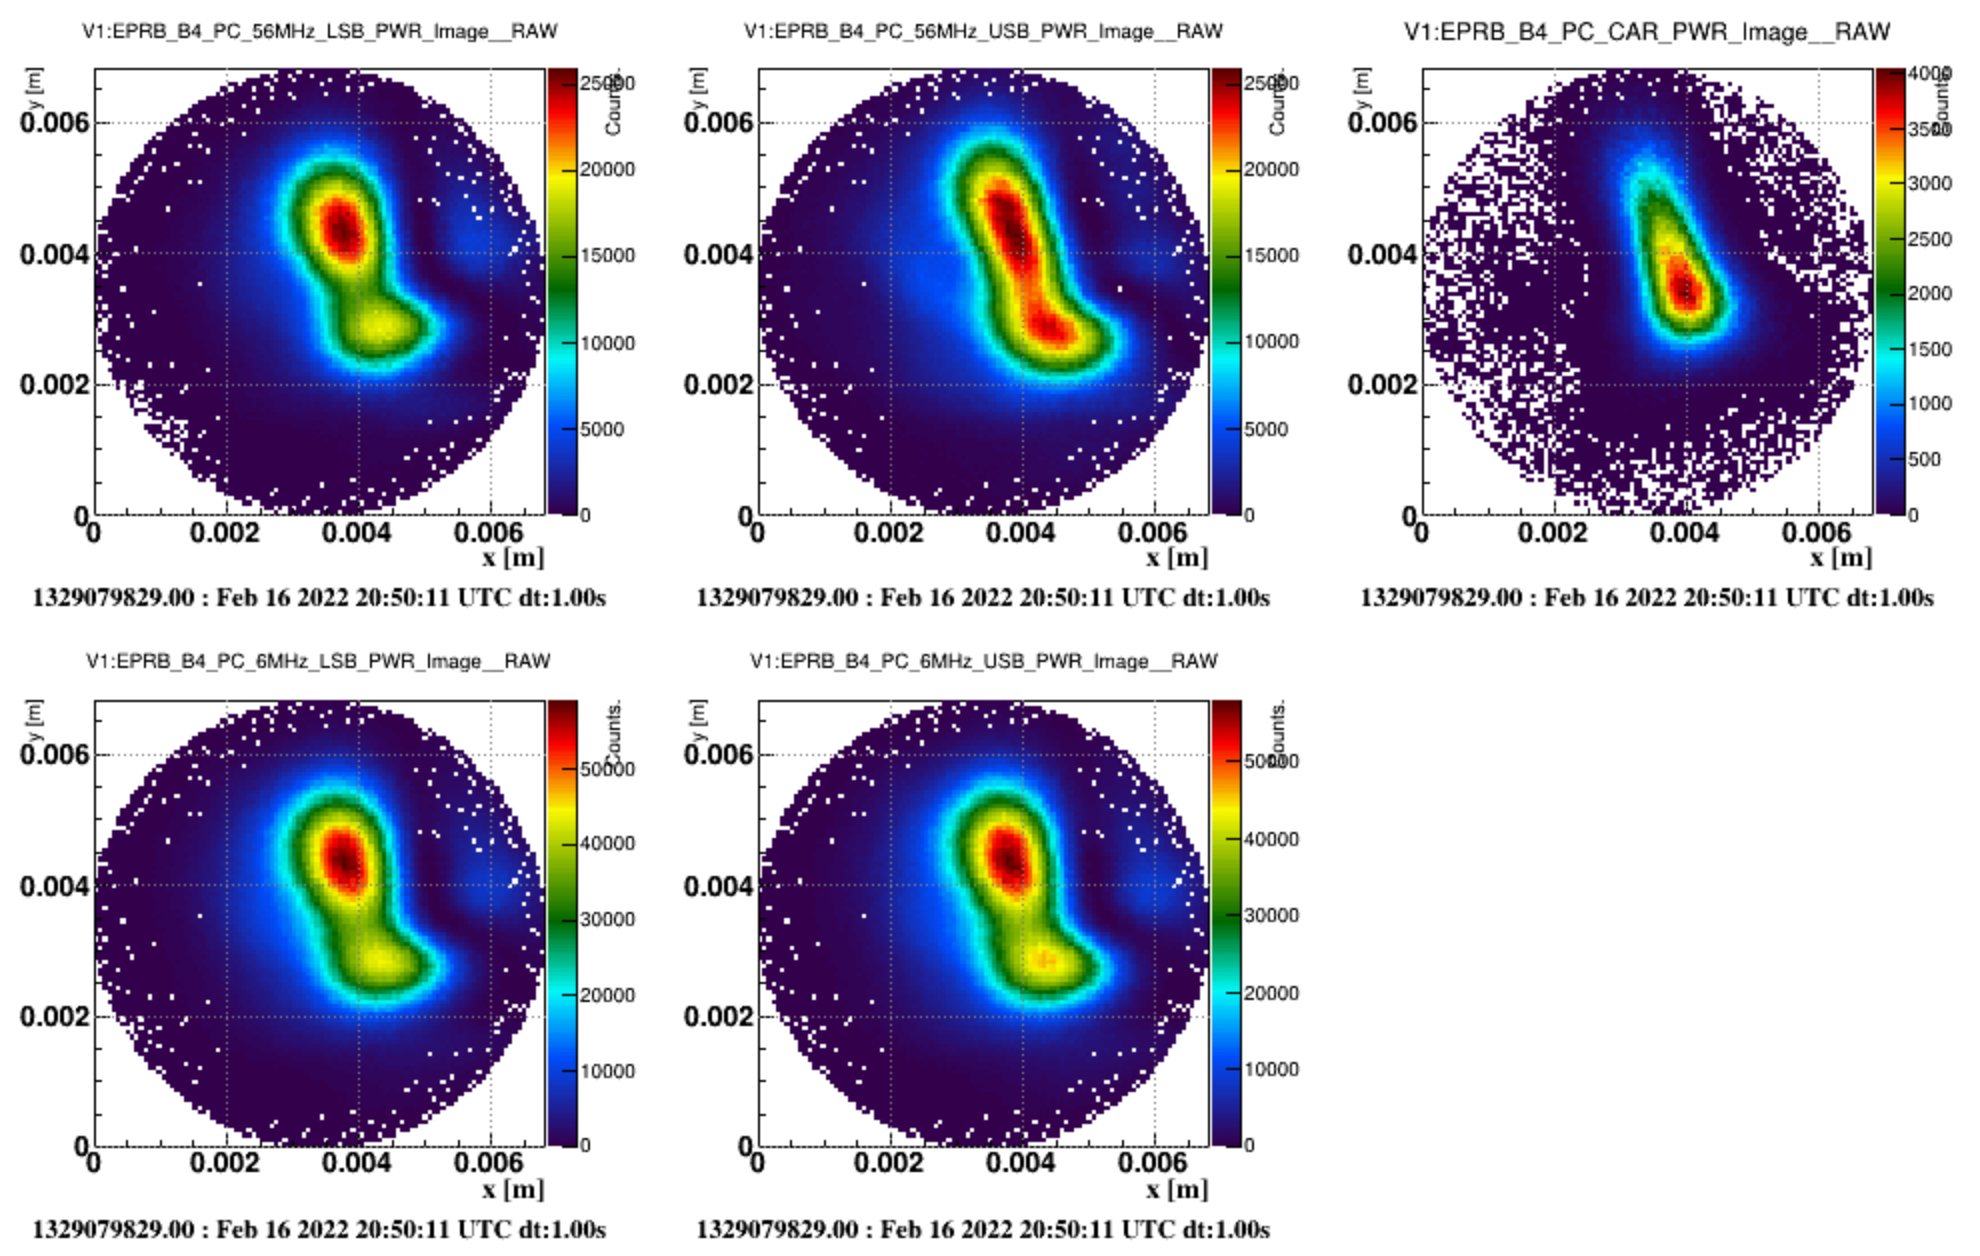
- Figure 3: images acquired by the phase camera after the work on the alignment of the cavity.
It seems that the higher-order mode content of the sidebands (both 6 MHz and 56MHz) slightly increased after the optimization of the cavity alignment.

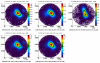
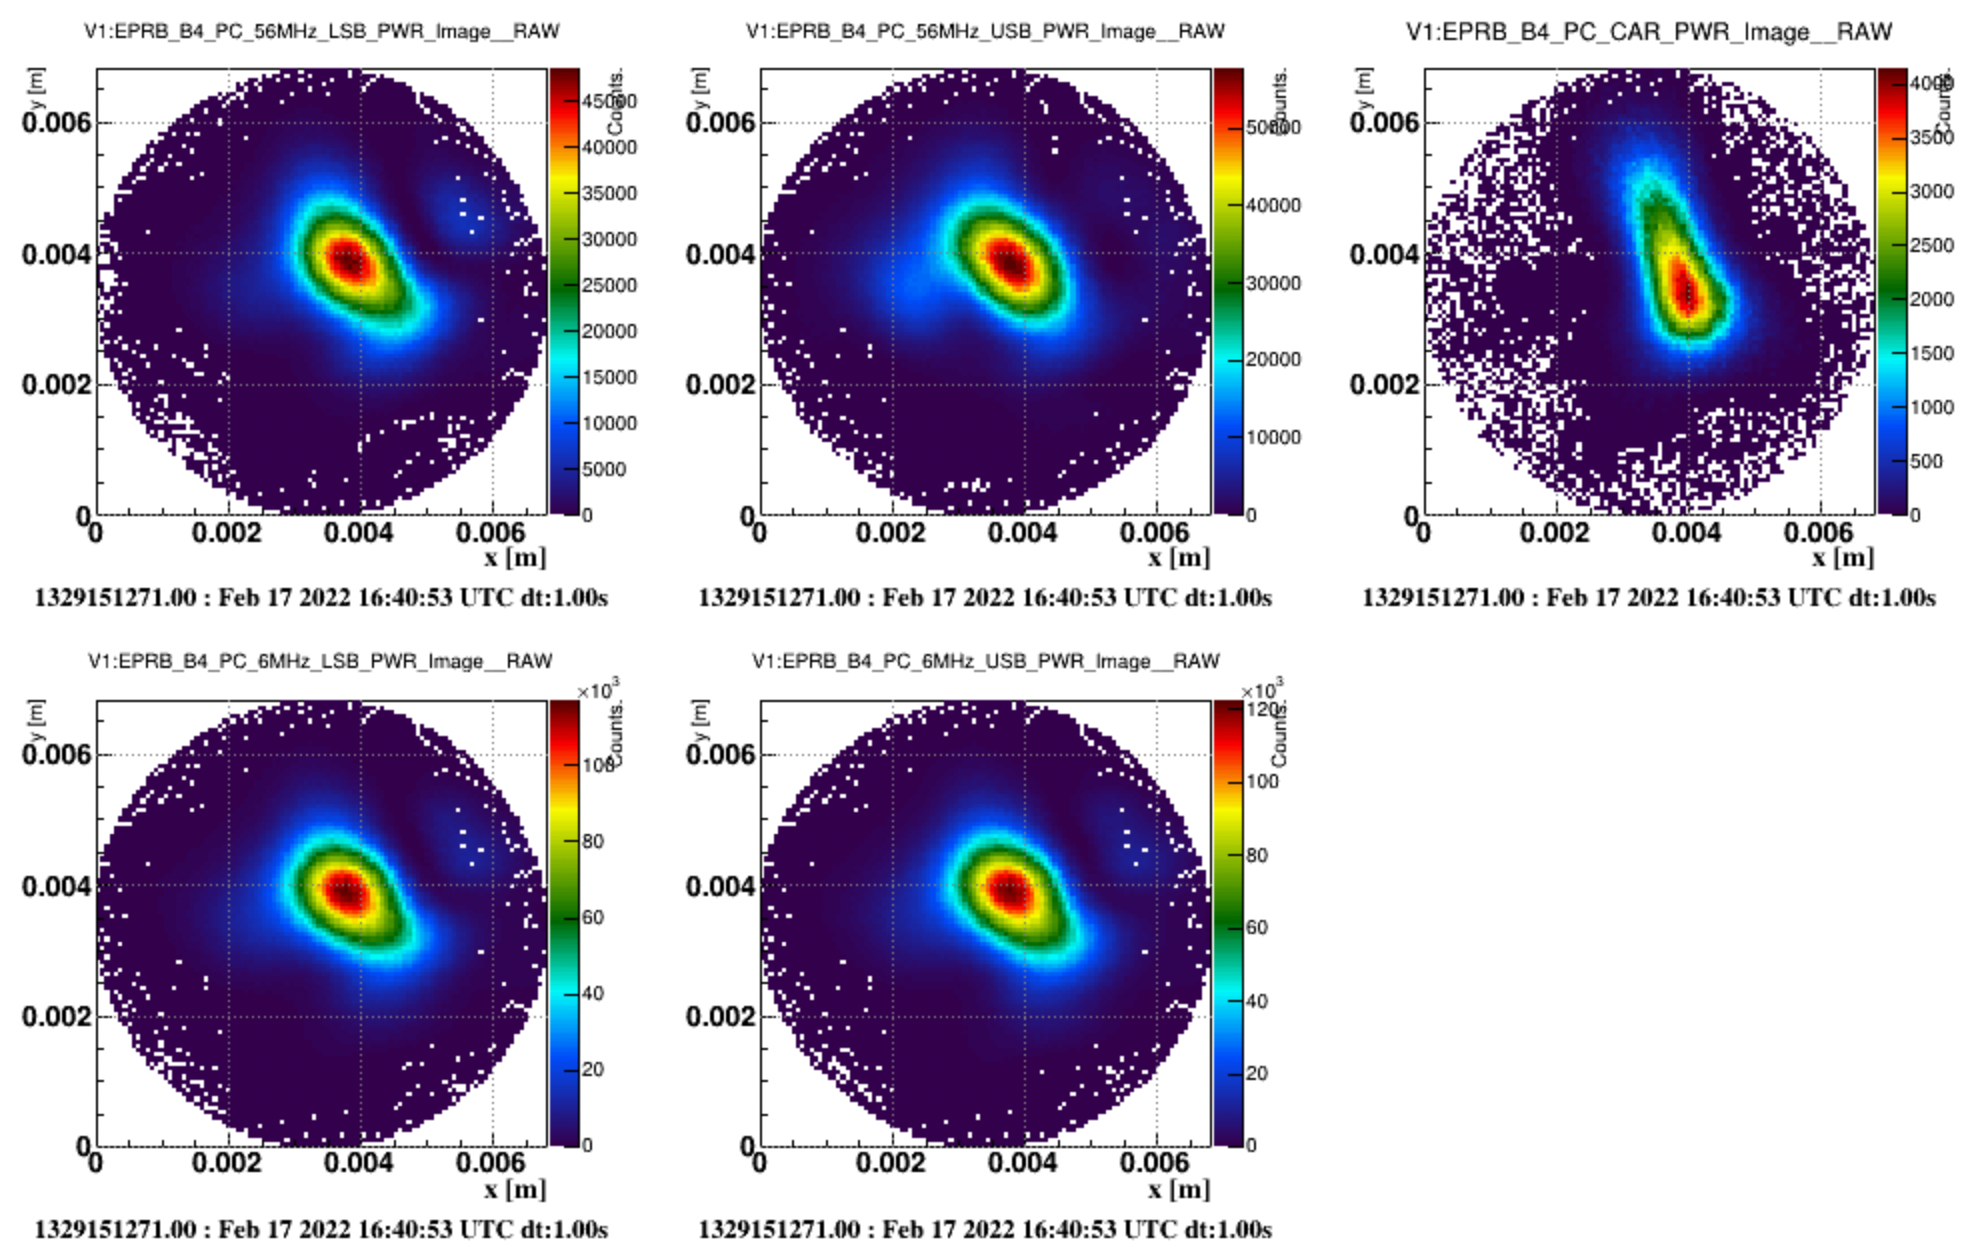
After the recovery of the TCS failures, the status of the sidebands improved a lot. the power increased on all the signals, both of the photodiode and the phase camera, except the PC carrier (it could be reasonable considering that the carrier should be anti-resonant in this configuration). The shape of all the sidebands is much more circular.
A sistematic study of the locks before and after the shift of the beam was performed:
- We found all the lock in CARM NULL 1f of the ITF between 1st January 2022 and 20th February 2022 (189 in total)
- We considered only the lock with a duration greather than 500s (144 in total)
- For each considered lock we discarded the first 300s of data and we averaged a list of channels.
- We plot in an histogram the distribution of the average of each parameter in two different groups:
- before the 31st January (before the beam shift)
- after the 3dh February (after the beam shift)
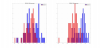
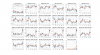
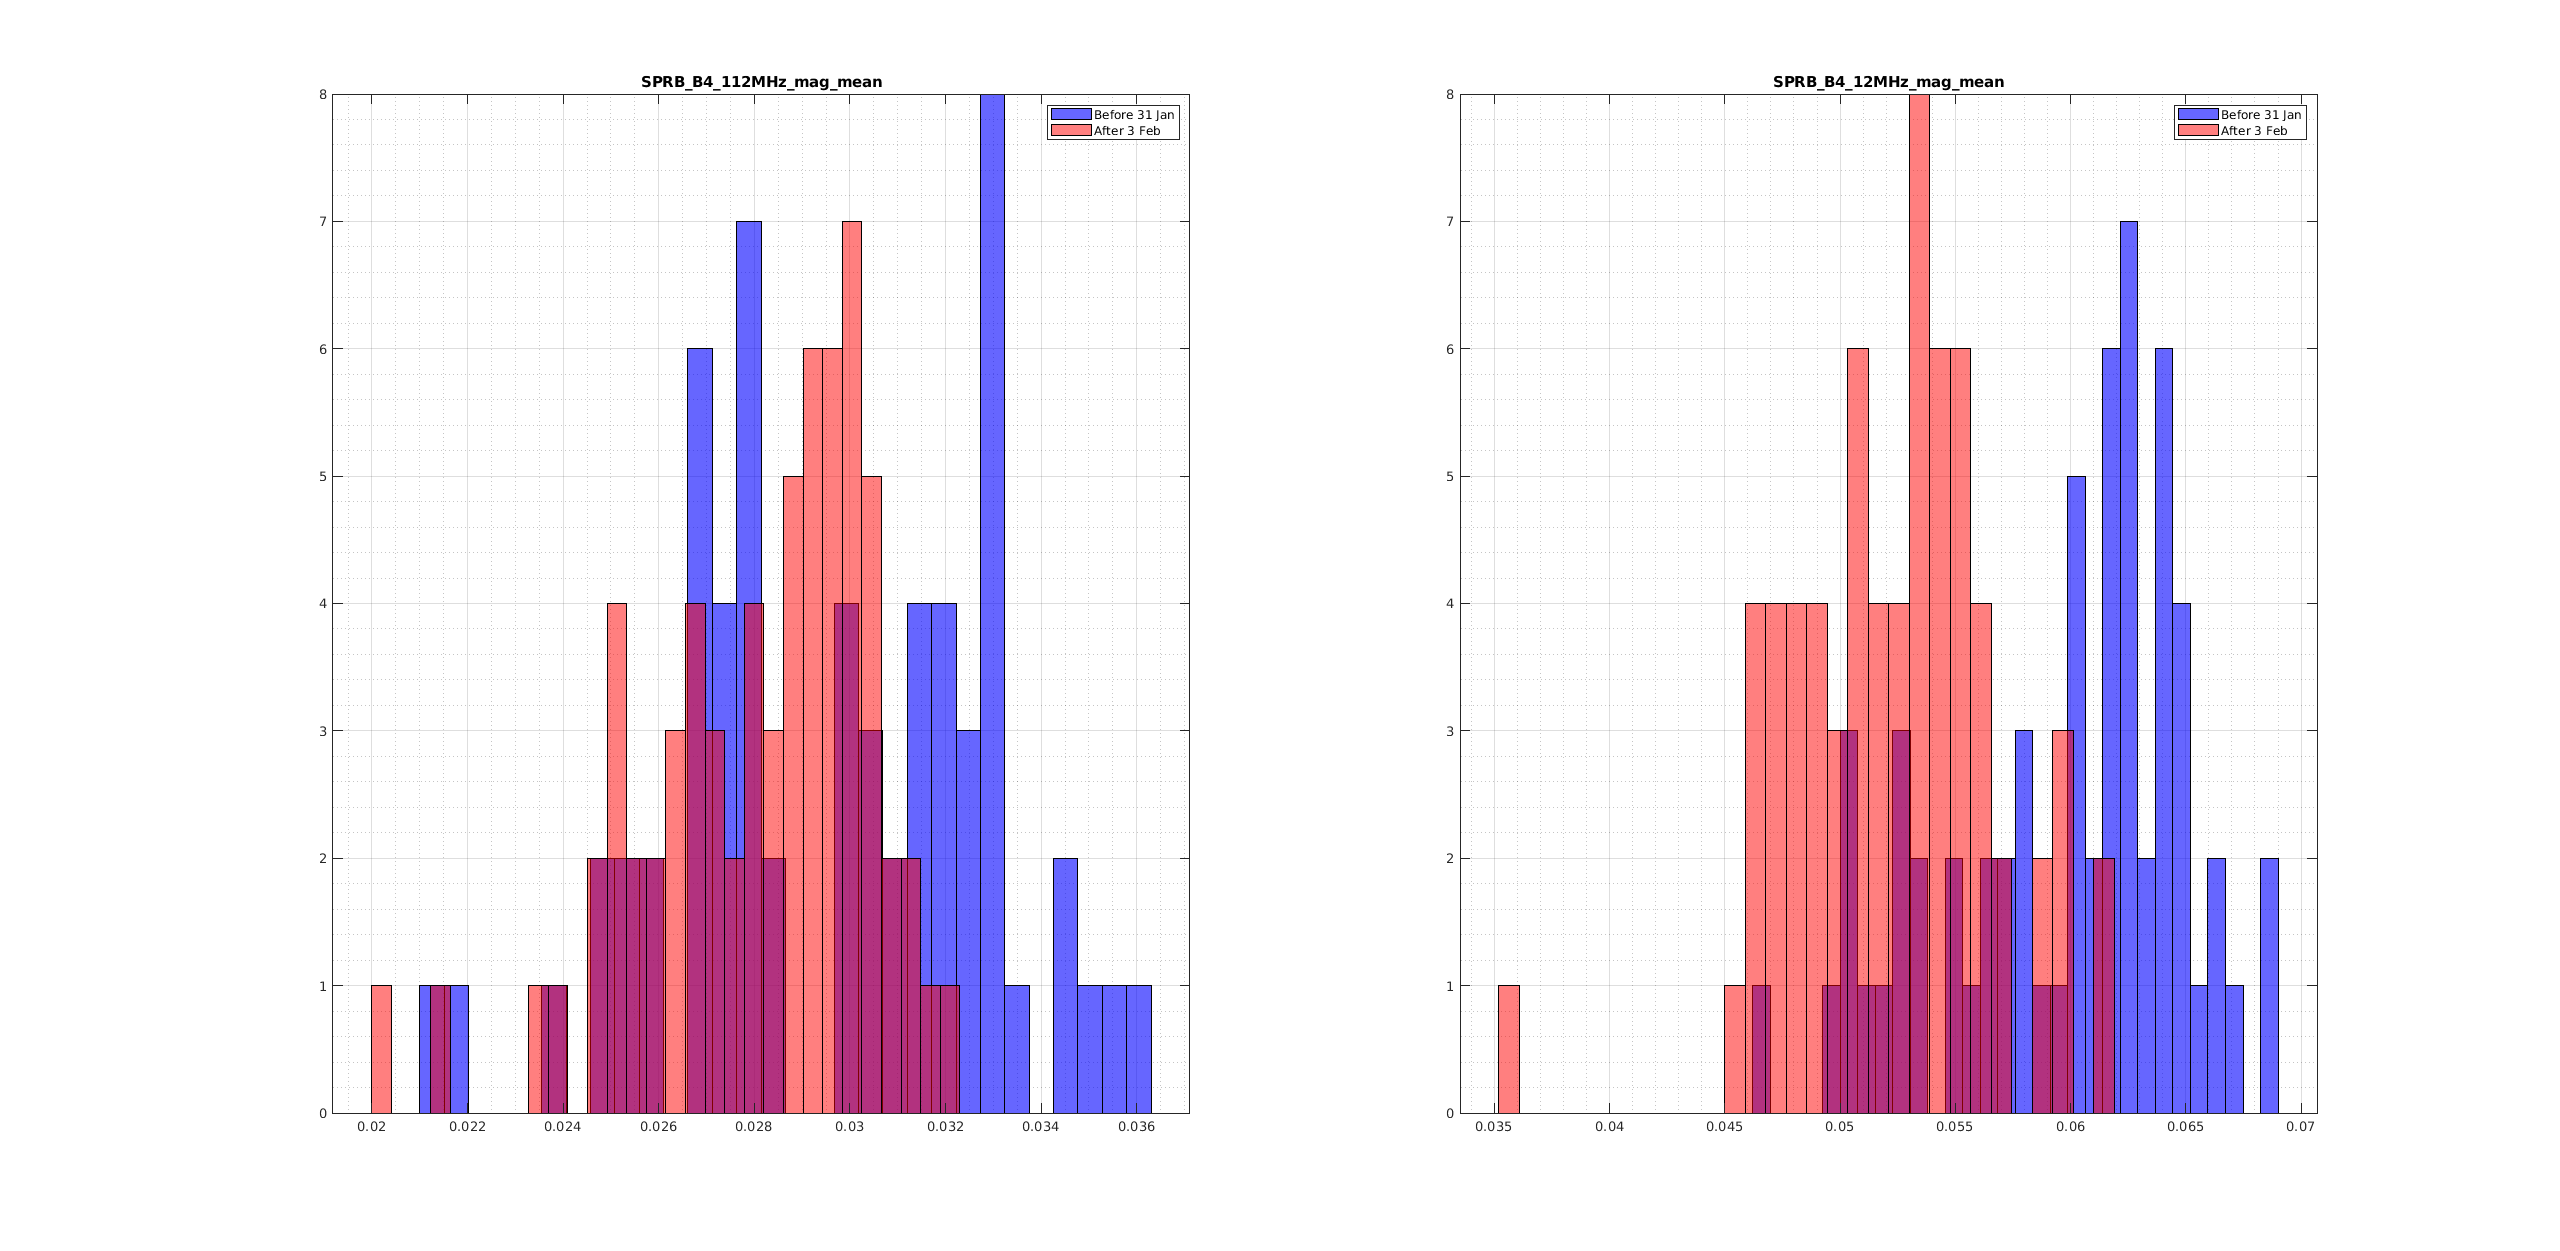
In Figure 1 we plot the distribution of the mean value of the sideband power before and after the beam shift. Both the sideband (12 MHz and 56 MHz) decreased. The reduction of the 6 MHz is more evident with respect the reduction of the 56 MHz.
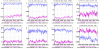
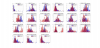
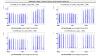
For sake of completeness int Figure 2 we show all the channels that are taken in consideration during this analysis. Further studies are in progress.
To be more complete and more correct we did a second analysis:
- the first big step of the shift of the input beam was not the 31st january but the 27th
- we took locks longer than 1300s starting from the 31st November 2021 up to the 20th February 2022
- we averaged only 100s after the manual alignment and the thermal transient but before the degradation of the alignment due to some AA loop open. We decided to average between 1401 and 1500s after the beginning of the lock
- we include in the analysis also B2.
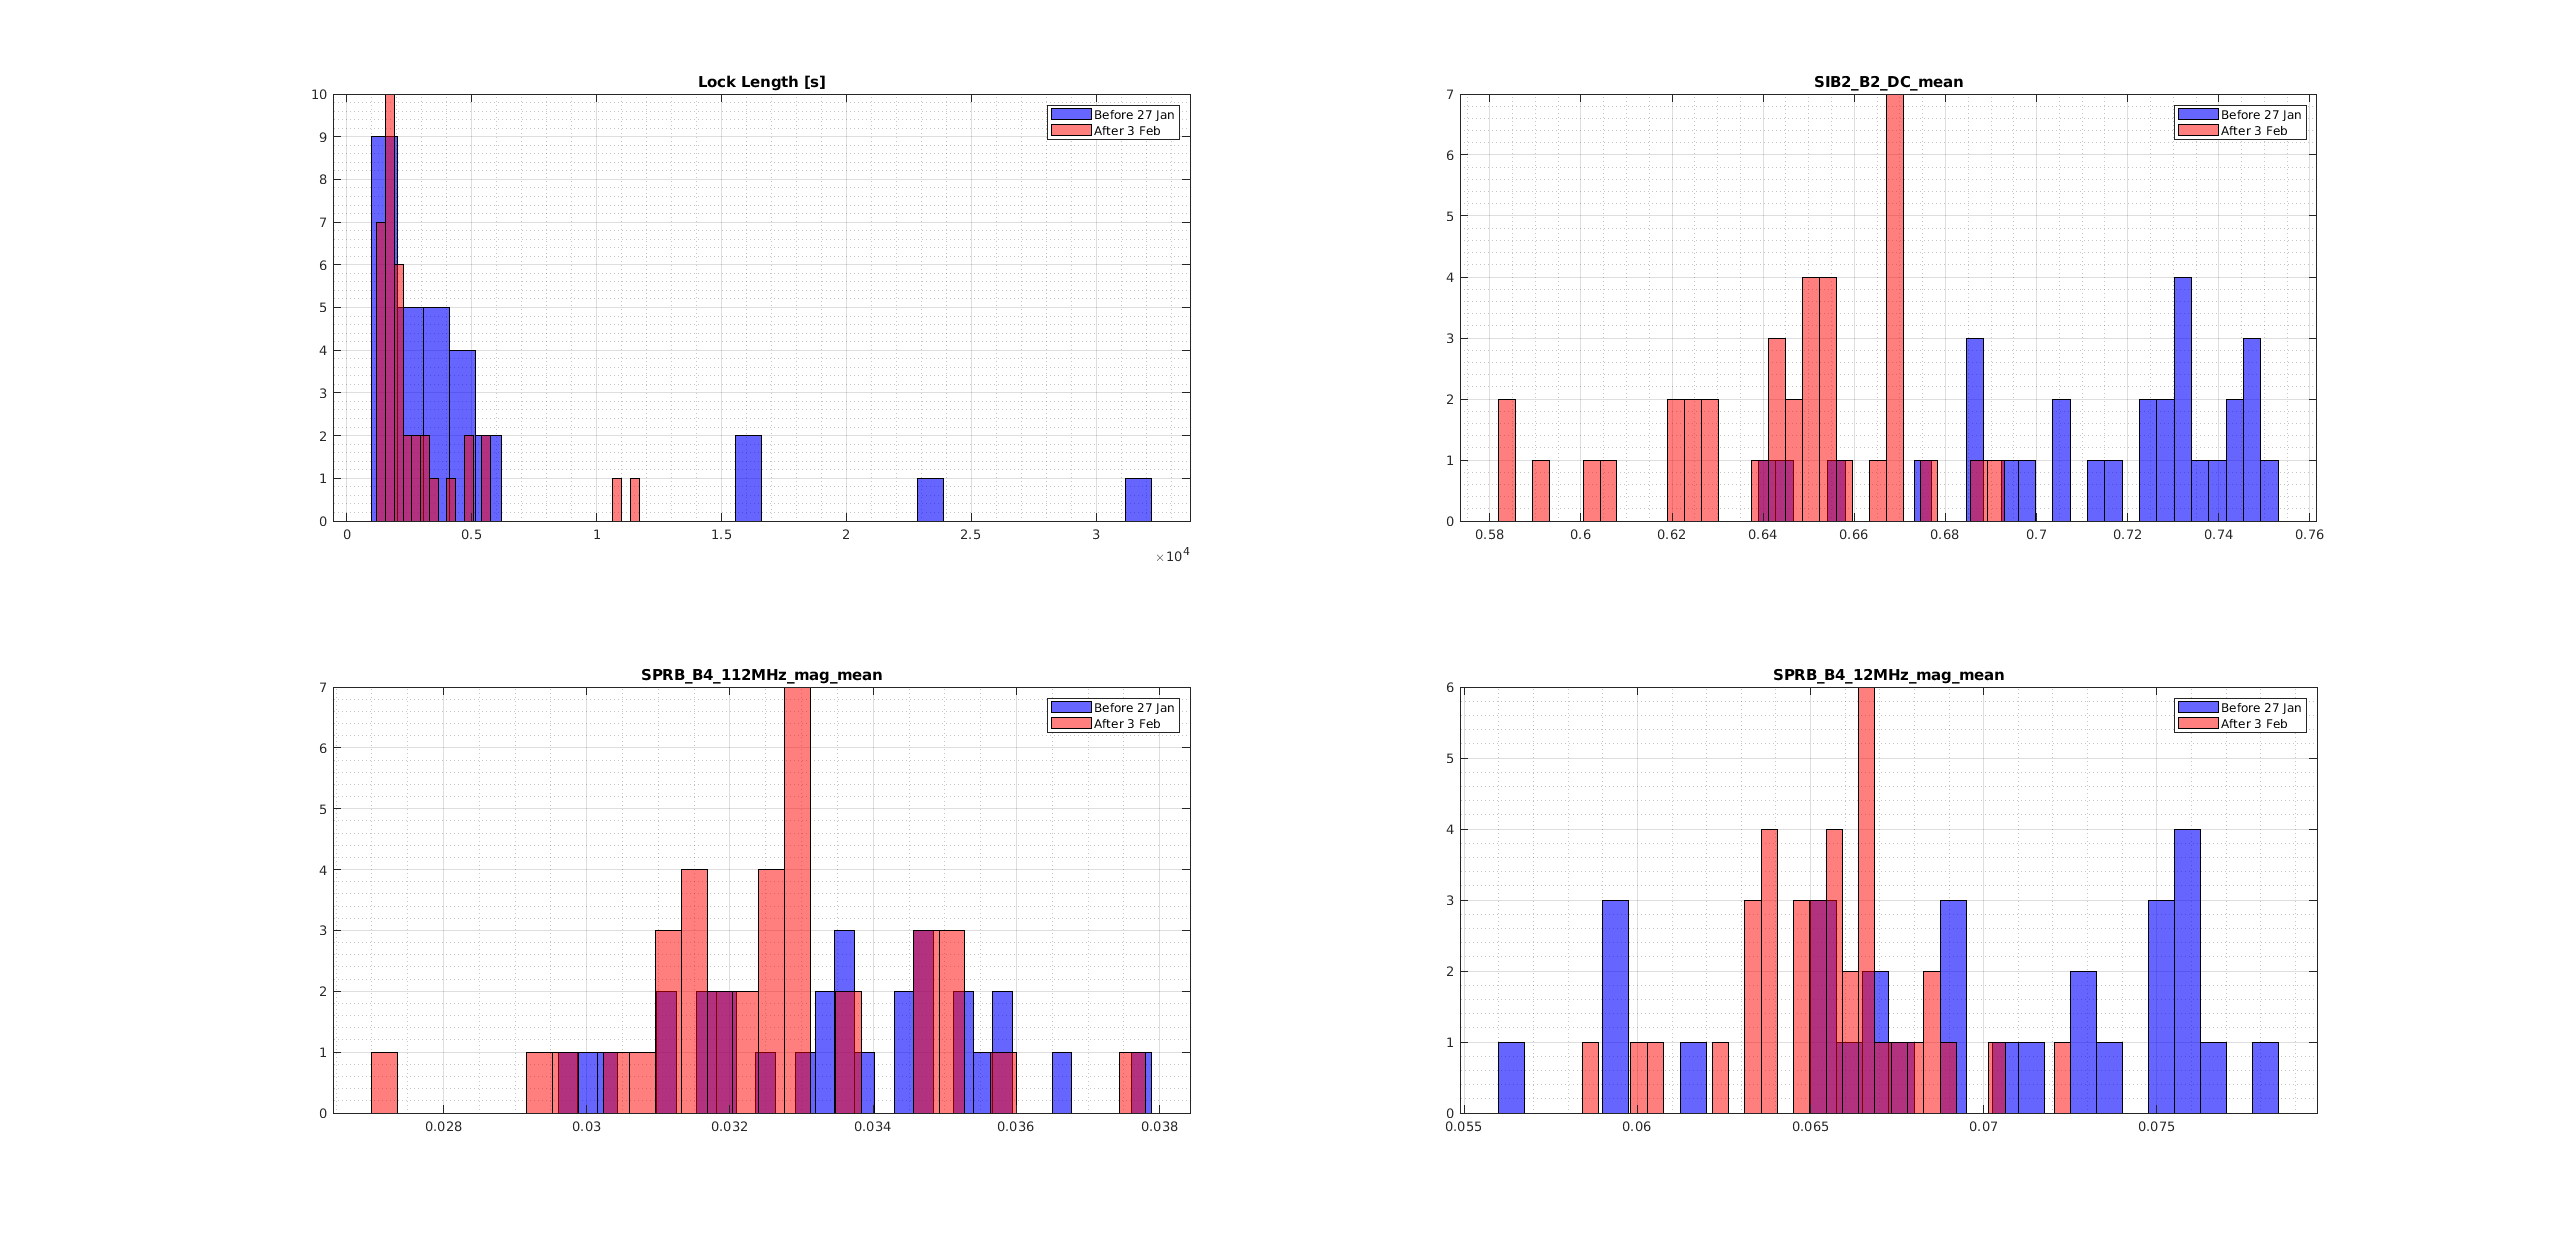
Fig.1 shows the results with these new kind of statistic:
- the B4 12 MHz and 112 MHz mag decreased after the beam shift
- the B2 DC signal decreased after the beam shift
We are performing analysis on the reduction of the level of B2 a new comment will follow
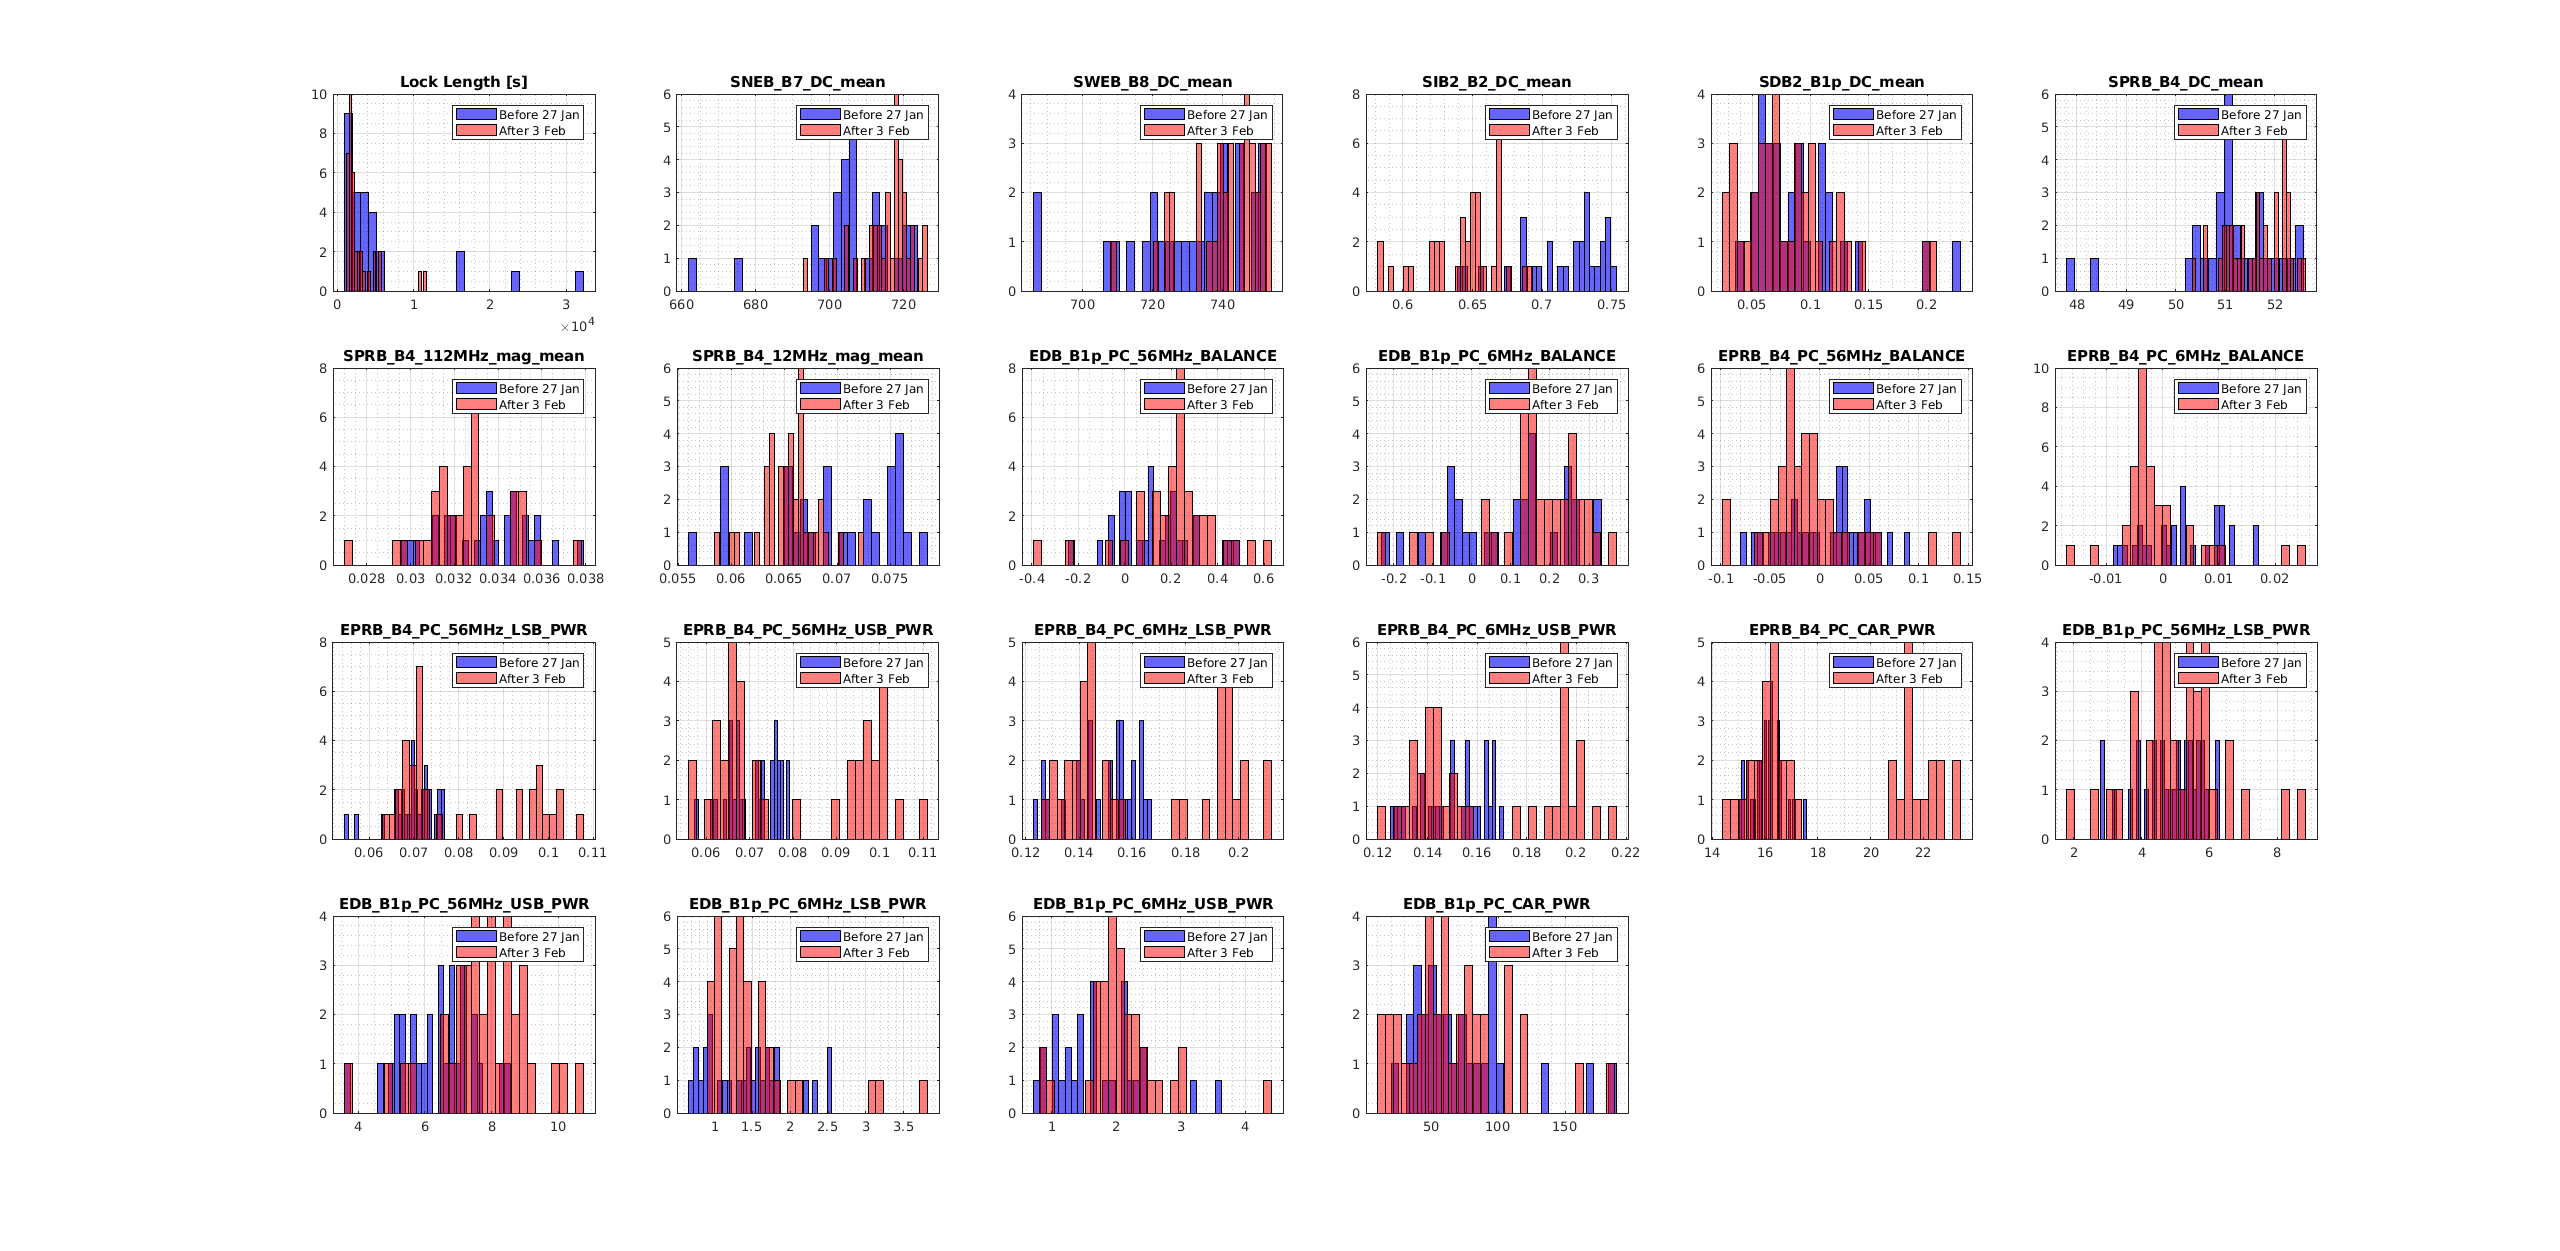
Fig.2 as in the last entry shows all the channels taken in consideration if one wants more information.
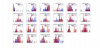
Fig 3 shows the same channels of Fig 1 but with the same selection criterium used in the last entry. This is a confirm that the reduction of the signals is the same with the two different approaches.

Let me give a few fast comments.
- The decrease of B2_DC is a good news. It means that we are coupling better the carrier light into the interferometer (assuming the input power did not change ....). Qualitatively it is consistent with the increased of B4_DC and B7_DC (I cannot understand if there is a change in B8_DC).
- The changes in B4_112MHz and B4_6MHz should be taken with a grain of salt.
It is a shortcut to say that these signals give the side-bands power in the recycling cavity.
These signals measure USB*CC(LSB)+CC(USB)*LSB. If USB and LSB have the same phases then this becomes 2*|USB|*|LSB|.
But if the two side-bands behave differently in the recycling cavity, e.g. because one of the two is partially resonating in the arms, they will have different phases and the B4_xMHz signals are more difficult to interpret.
- I would rather look to B4_PC_USB and B4_PC_LSB. These signals show a bimodal distribution after the realignment.
In one of the two states the power on the side-bands is clearly increased.
- The increase of B4_PC_CAR is also consistent with the decrease of B2_DC and is some cases it is rather impressive.
The bimodal distribution is clearly visible. Did the carrier really increase so much after the realignment for some of the locks?
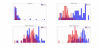
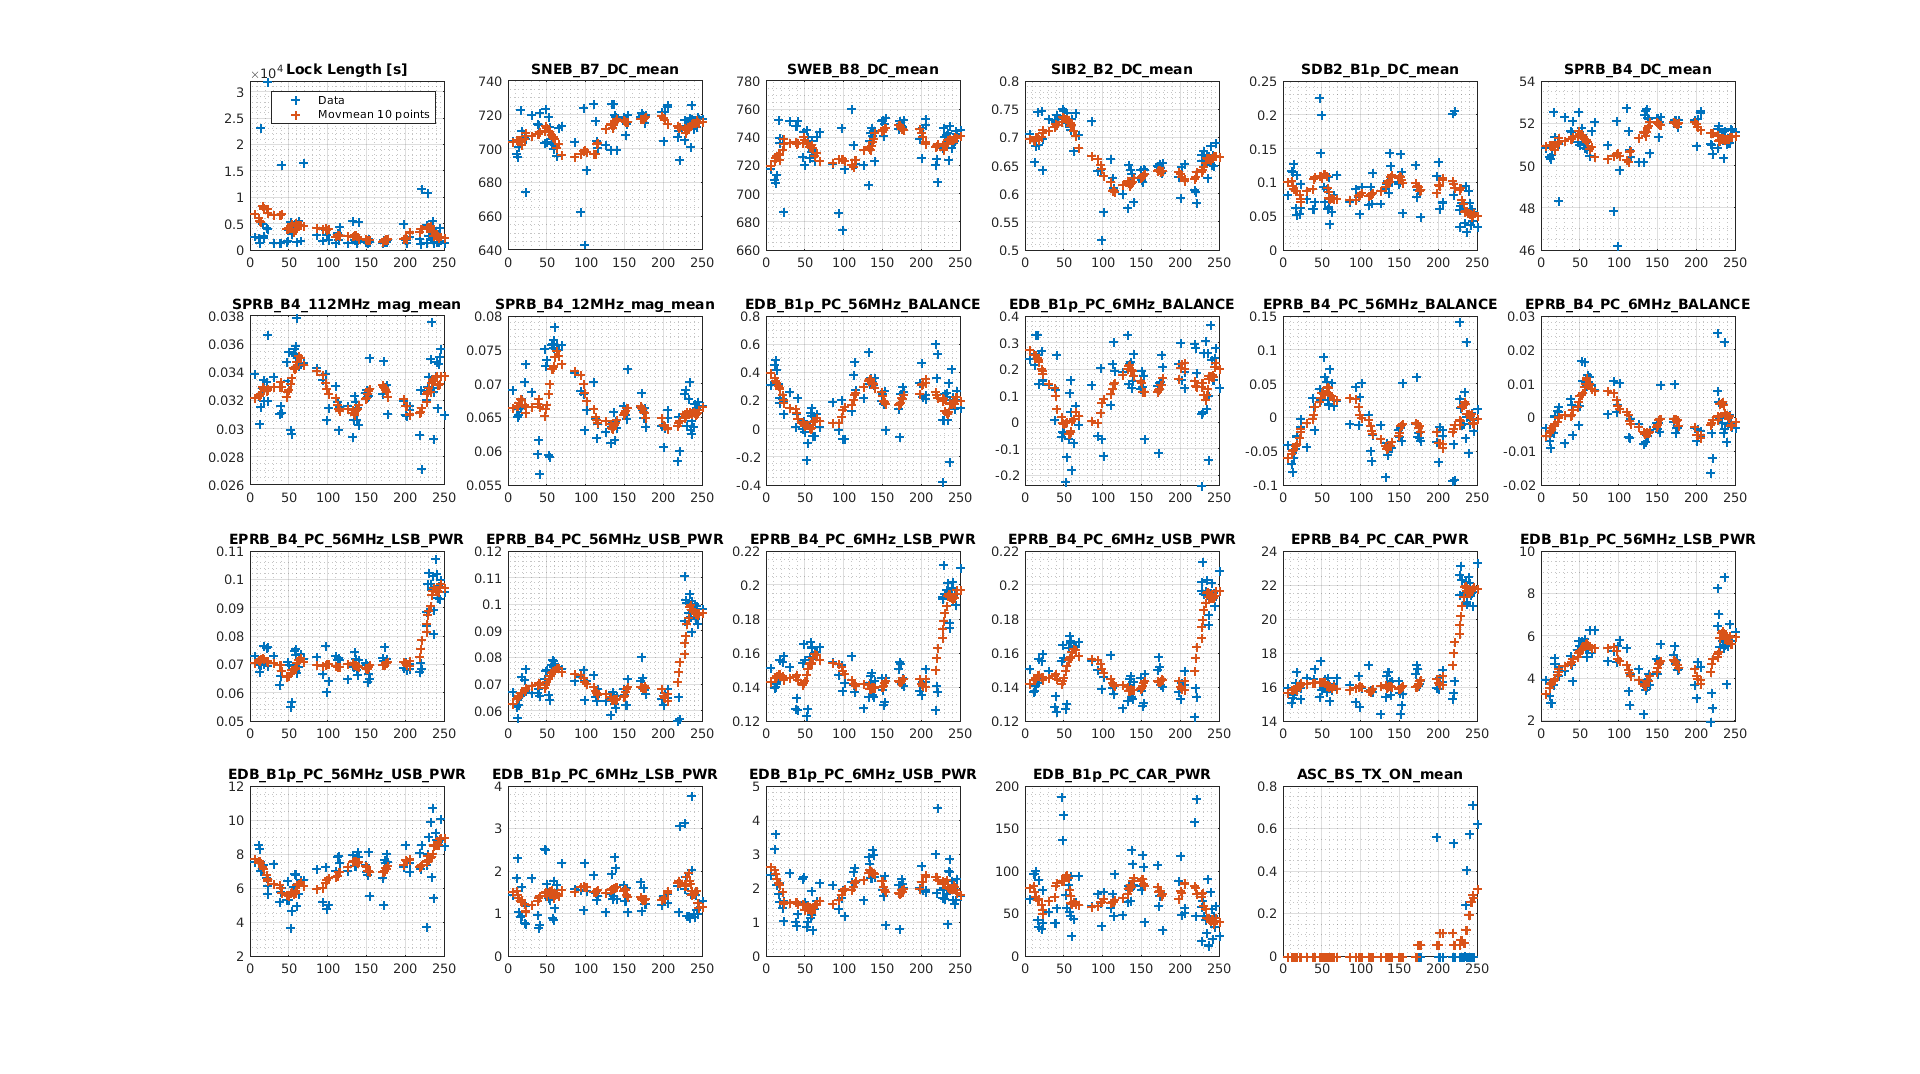
We already noticed the double distribution in all the SPRB_B4 phase camera. In order to understand well the situation we tried to plot the same information as a function of the time. The plot in Fig 1 shows the mean of each channel with in the X axis the lock index. In each subplot are shown in blue the points that correspond to the mean value of the channel for each lock and in red the moving average each 10 points of the blue curve.
From the figure we can do the following observations:
- around the lock 100 B7_DC, B8_DC and B2_DC decreased their value. The lock 100 ~28th January corresponds to the beam shift.
- after lock 220 we can see an increase of the power of each component of the SPRB phase camera. But this is not seen by the B4 DC sensor.
Figure 2 shows better the situation. There were 2-3 days without any lock of the ITF and afther that the 15th February the power on the B4 phase camera signals increased. In this period of shutdown two problems occured: the switch off of the main Laser and an issue of the TCS system.
As already noted by Paolo, Marco and Eleonora, at CARM NULL B2_DC decreased after the realignment (by about 10 %).
A slightly increase is visible on B4_DC.
In both cases I re-normalized the power using the input power since there was a small decrease of the input power at the same time.
The plot marked B2_norm and B4_norm are the normalized power plotted only at CARM NULL.
Overall this means that the light is better coupled into the interferometer.
Moreover, the variability of the B2 and B4 powers at CARM NULL has decreased after the re-alignment.