Last Friday we continued the work on the active stray light loop.
0. Alignment and visibility optimization
We started by cheking the HD visibility between LO and BAB.
We have the following powers:
- BAB:
- 0,39 V on HD PD1
- 1.75 V on PD_MONI
- LO:
- 0.78 V on PD1
- 3.69 V on PD_MONI
With this difference in power we can get a maximum visibility of 94%.
We started with 57% of visibility and then by moving SQB1_M13 and EQB1_M6, we reached ~80% (normalized by the powers).
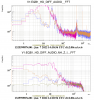
1. Higher stray light bump on HD AUDIO DIFF channel
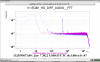
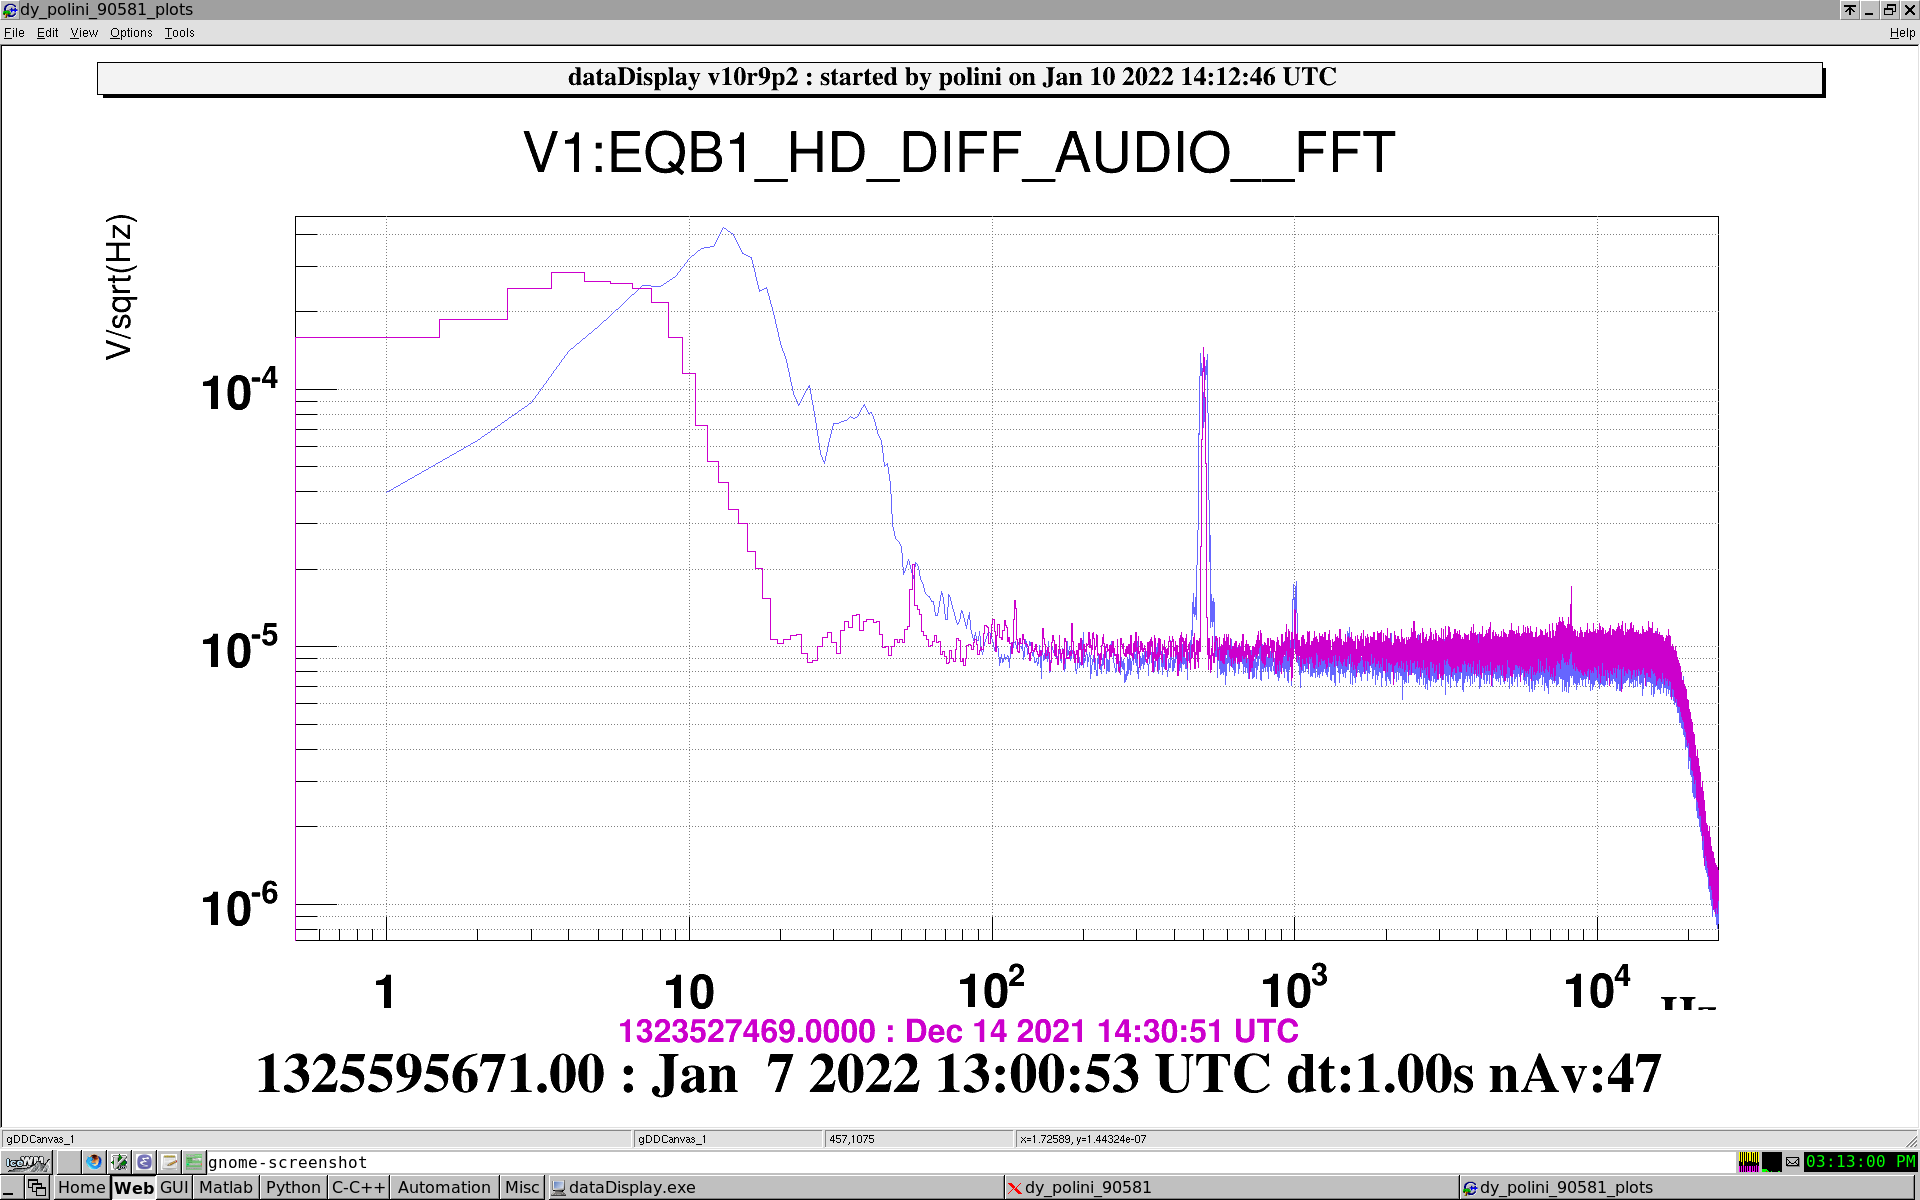
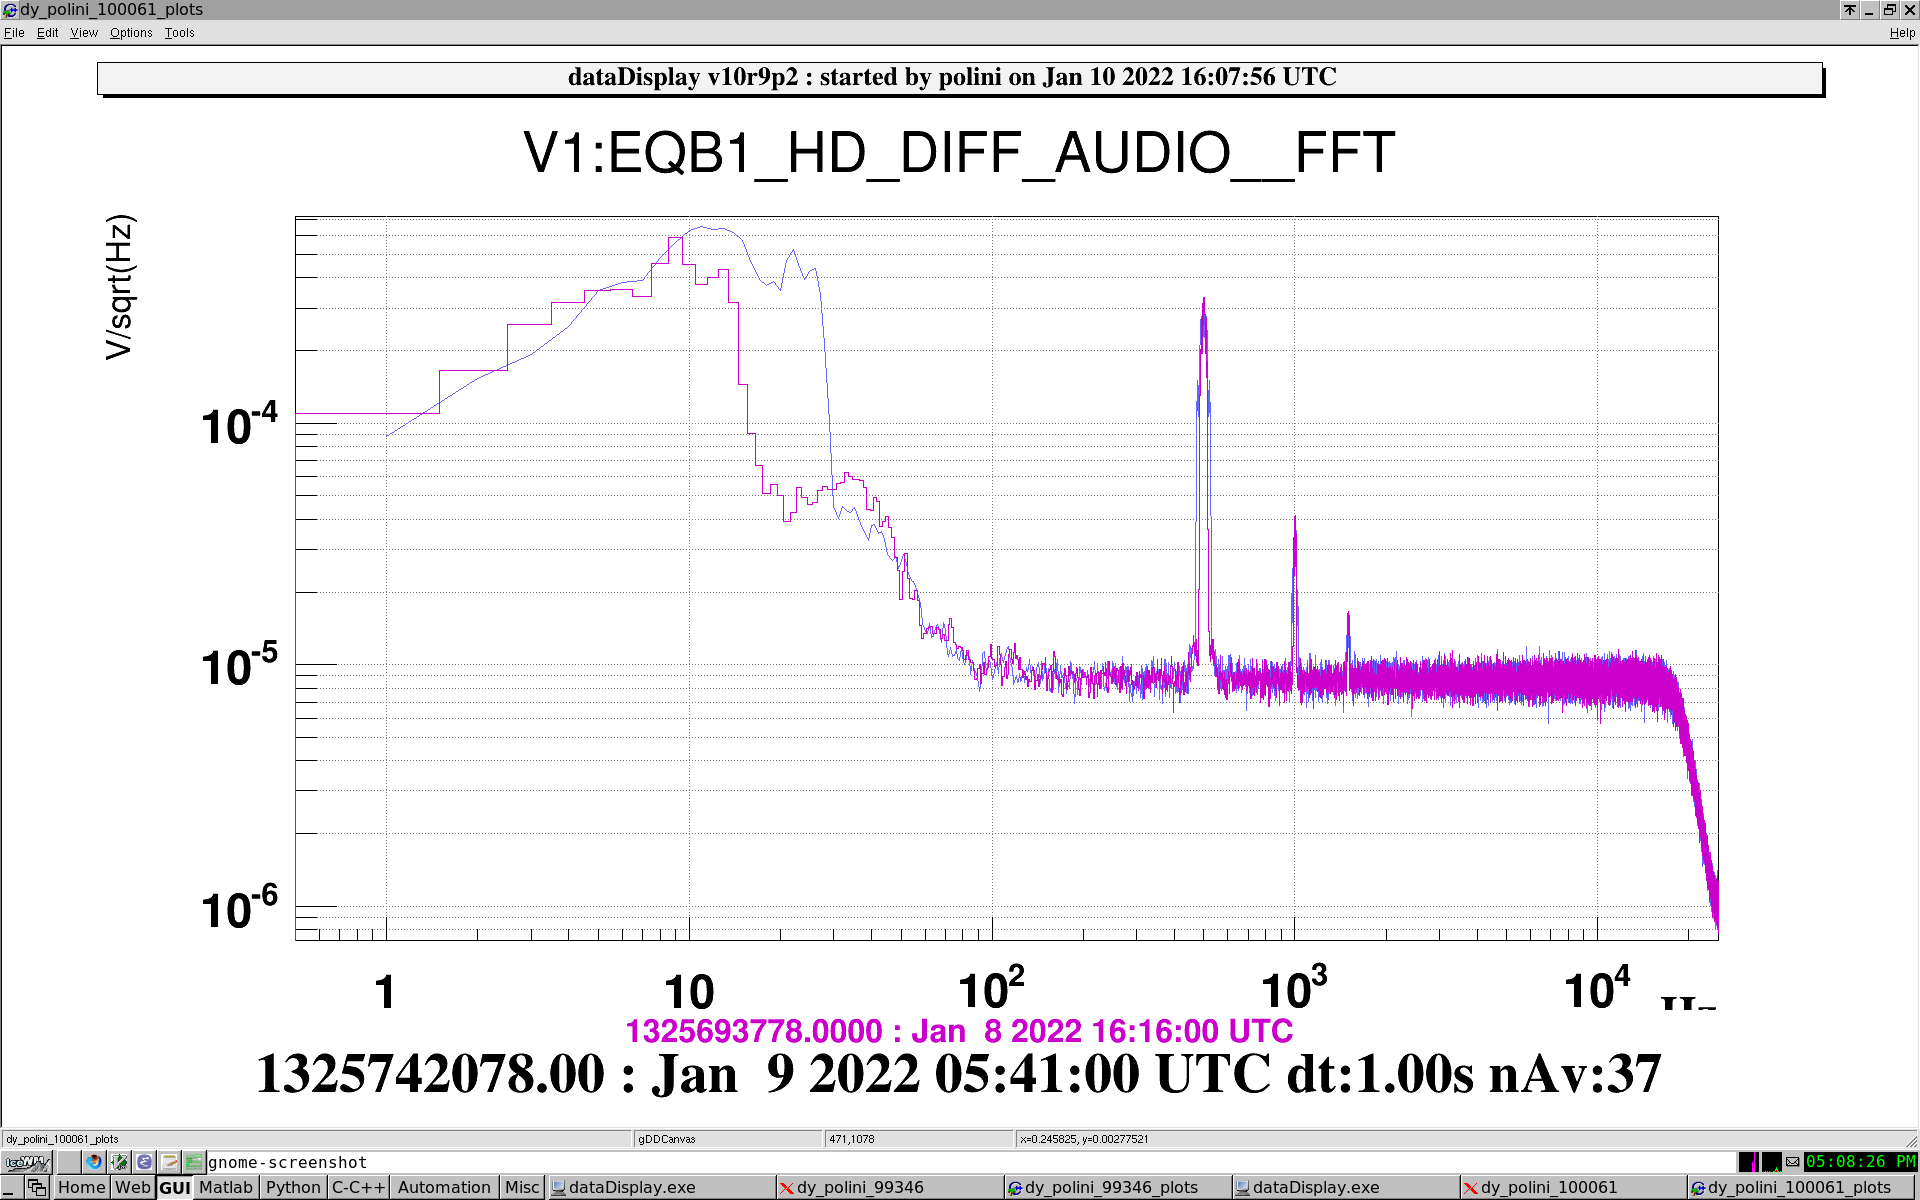
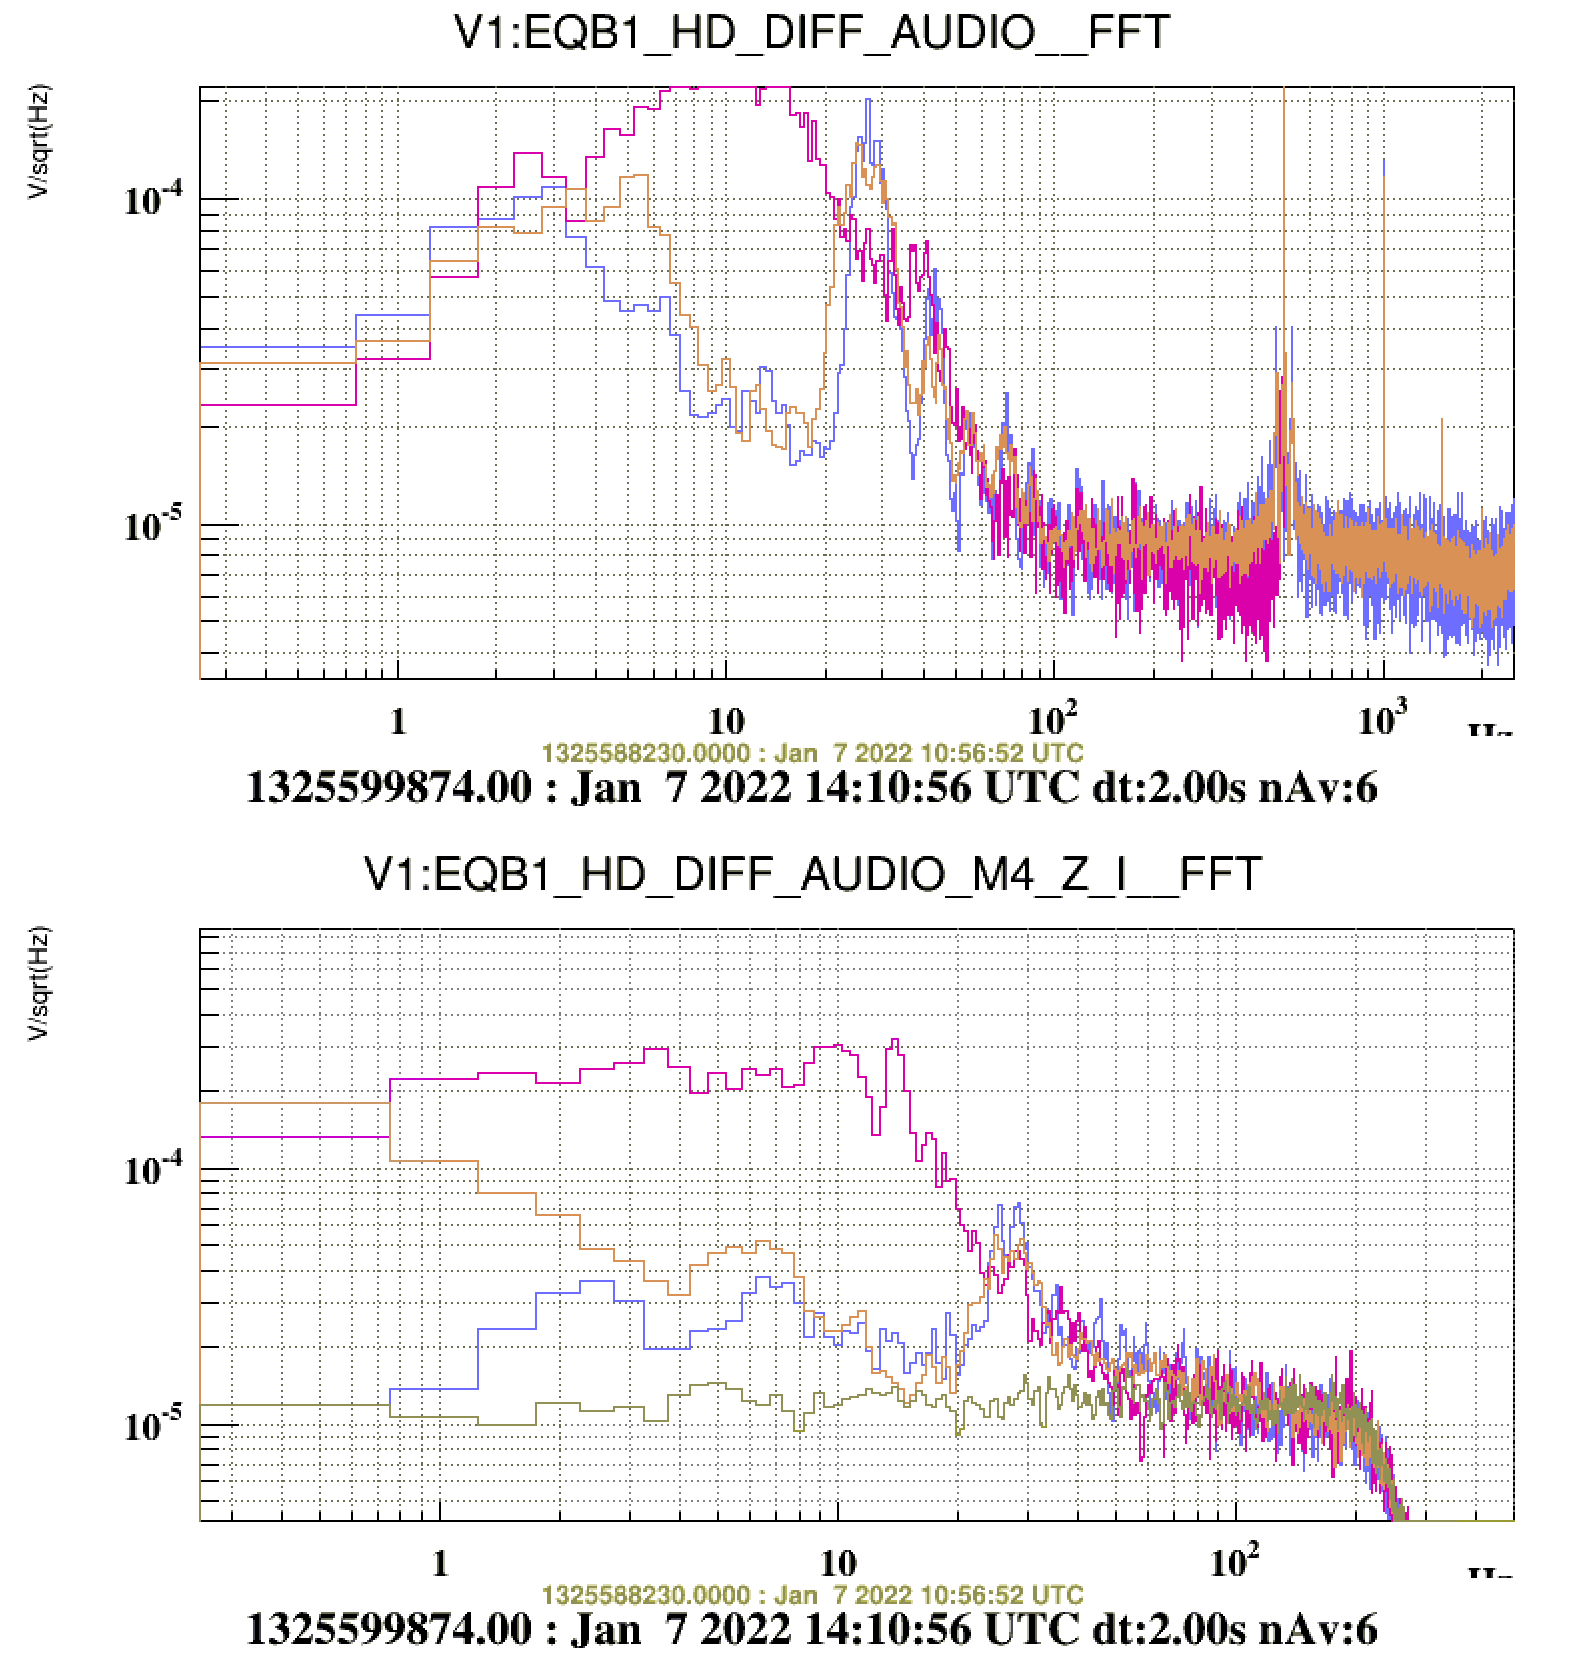
We noticed that the bump in the AUDIO DIFF channel of the homodyne, is larger than the previous time.
We compare the bump of the 7th January 2022 with what we had on 14th December 2021: see Fig. 1.
We can clearly see that the bump is larger, meaning that:
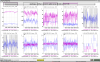
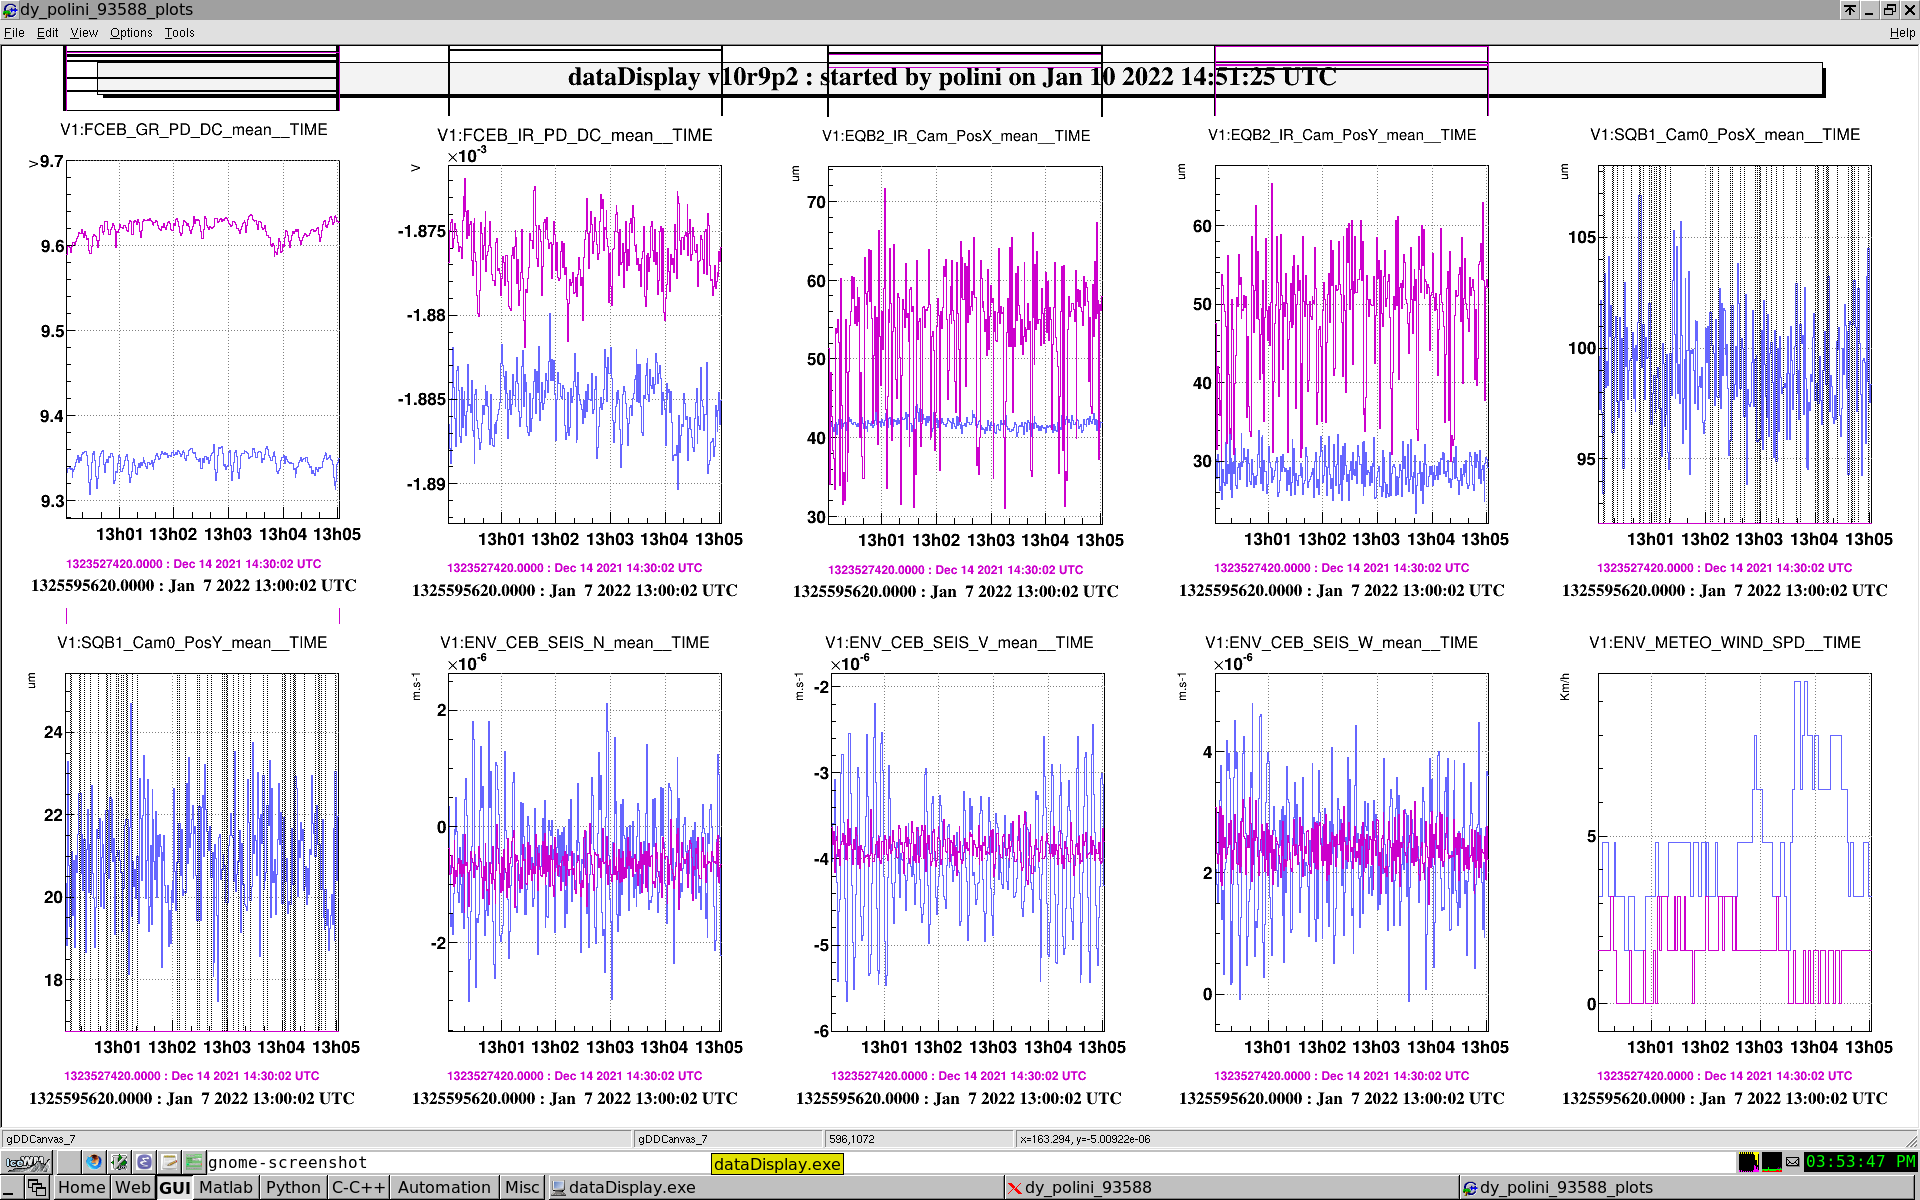
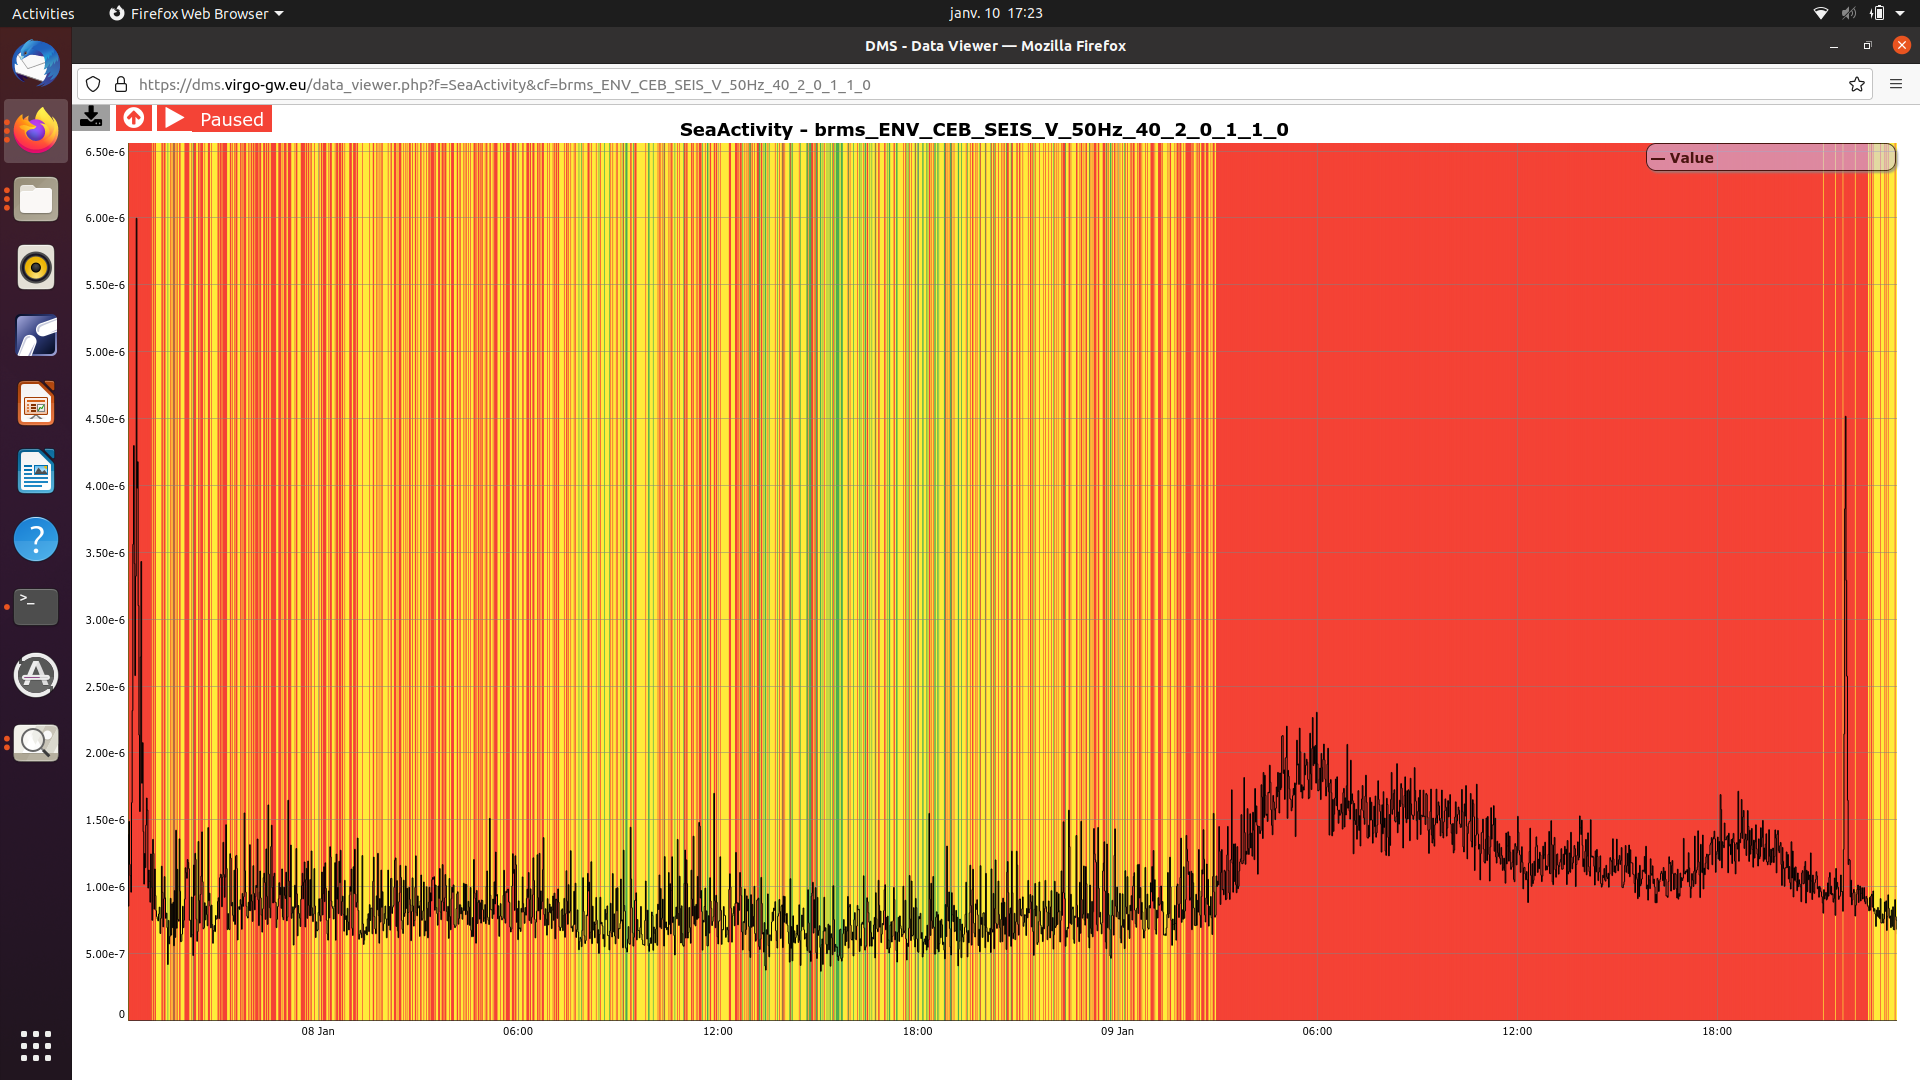
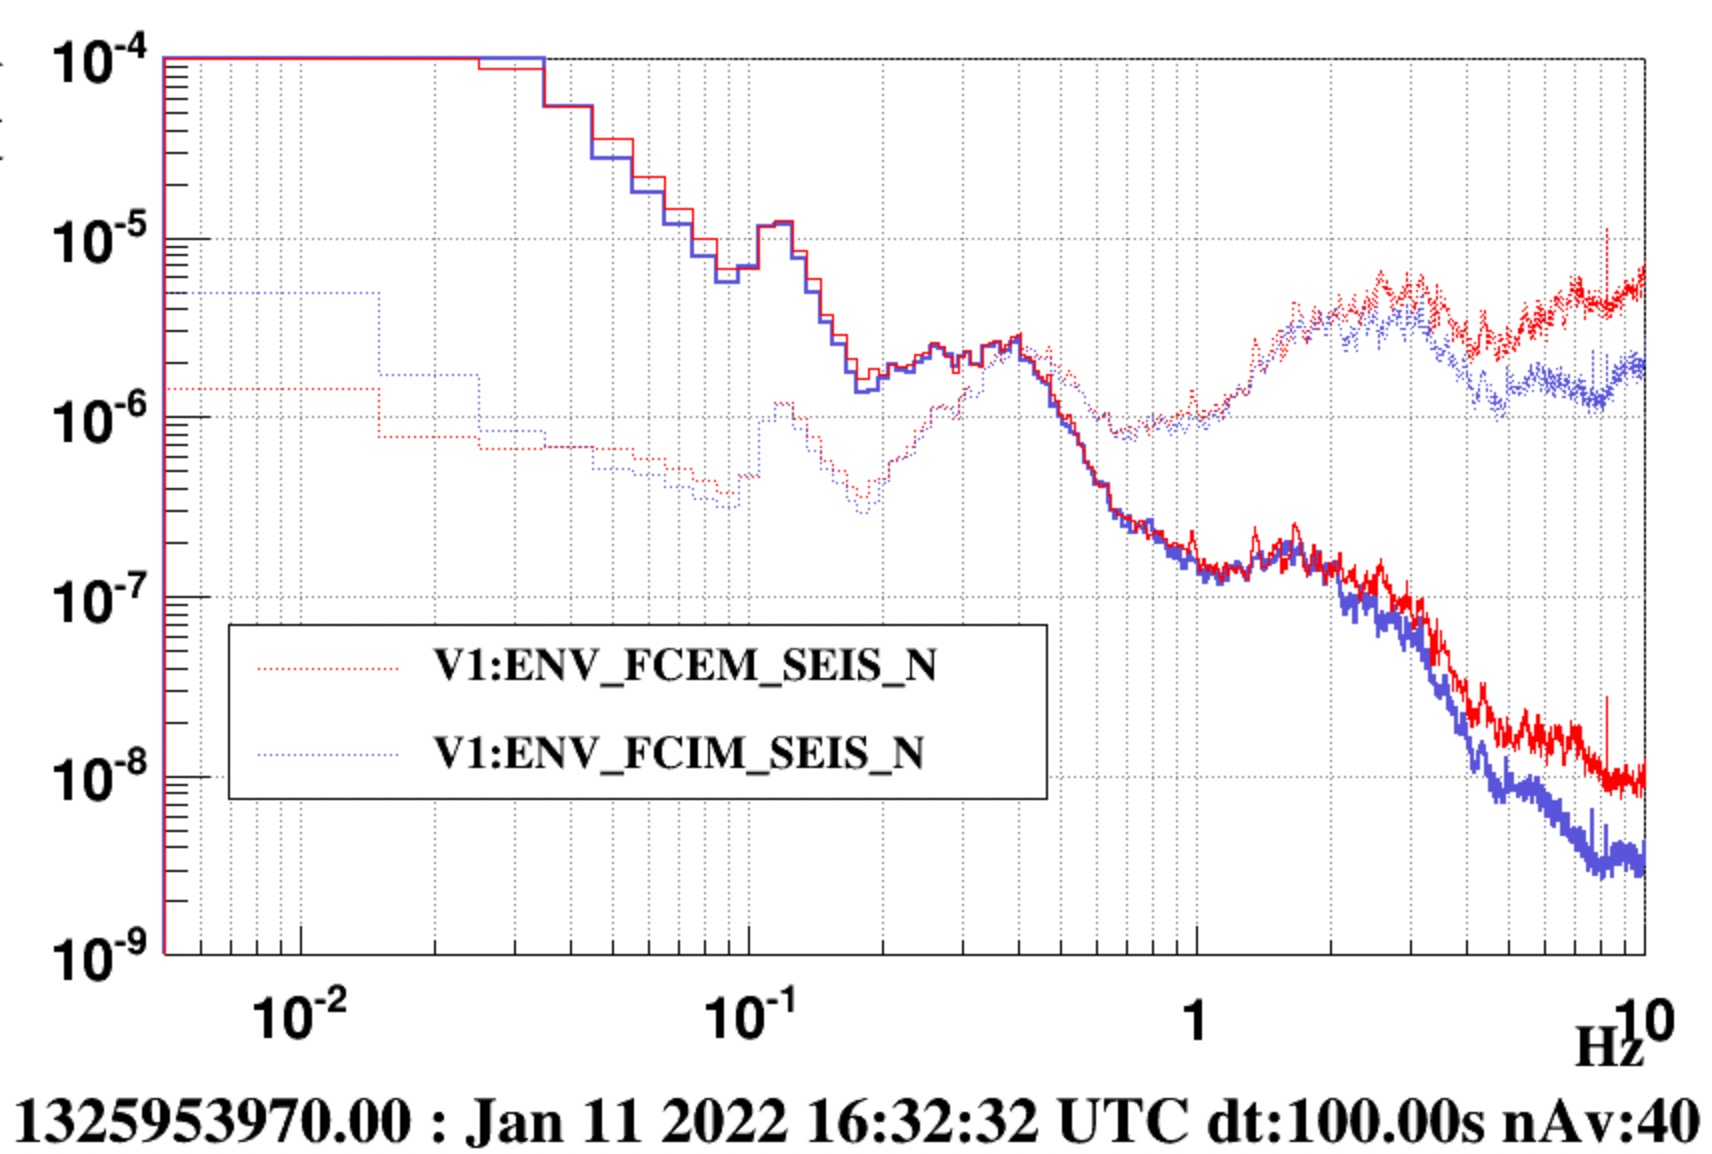
- our system is moving more than last time, see Fig. 2: the seismic activity is larger the 7th January (blue)
- we have a clip on the IR as shown from the fact that we are not able to restore the 1.5V in transmission from the cavity, but oly 0.9V.
We will further investigate the clipping that can be due to a different configuration of our system after Christmass holidays.
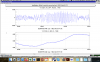
2. Dither line amplitude optimization
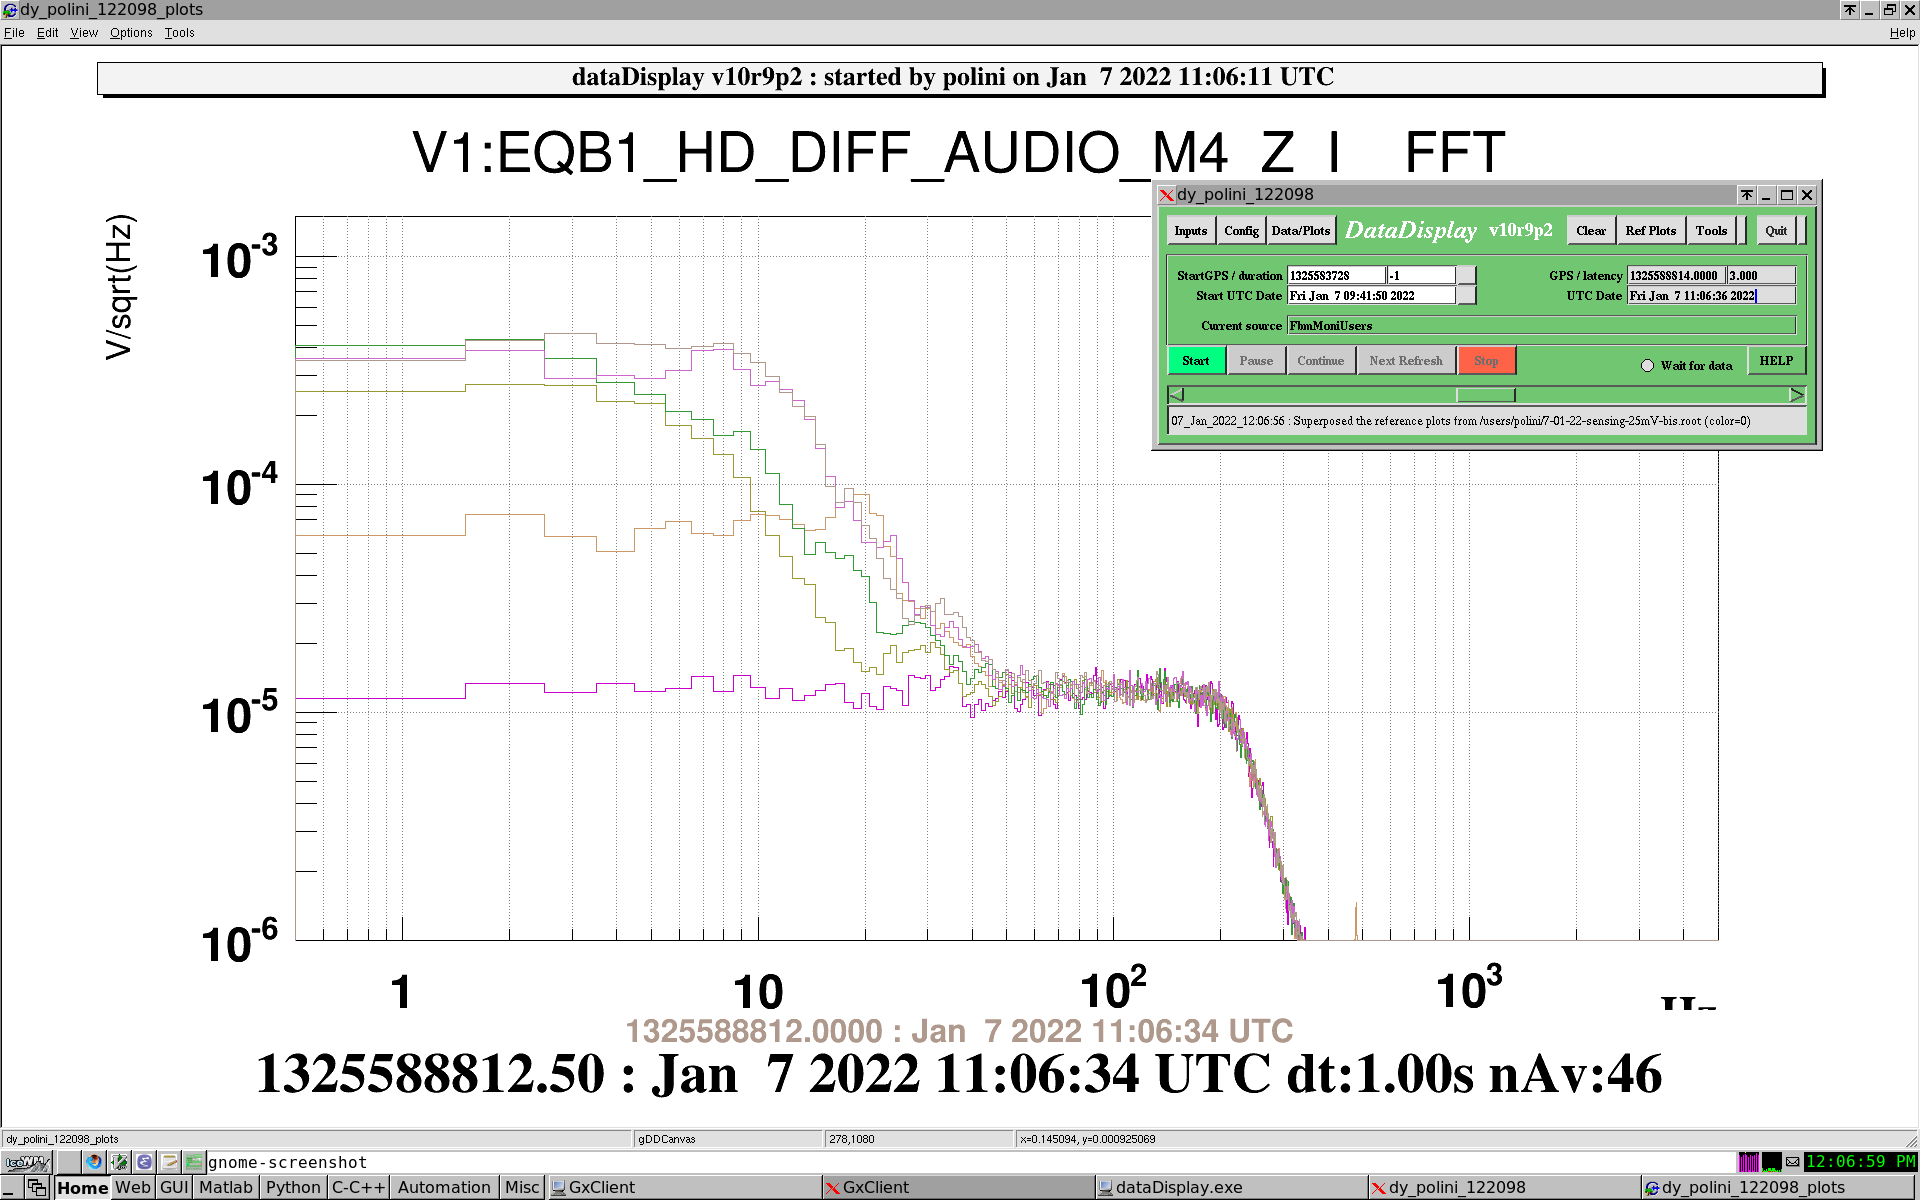
We optimized the amplitude of the dither line in order to have a good SNR on the error signal.
We acquired the following data on the 7th January 2022:
- 10h56m12: sensing noise, no dither line;
- 10h57m19: line amplitude = 5mV;
- 10h59m19: line amplitude = 10mV;
- 11h01m20: line amplitude = 15mV;
- 11h03m08: line amplitude = 20mV;
- 11h06m08: line amplitude = 25mV.
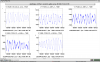
In Fig. 3 we have the signals increasing by increasing the line amplitude. If we increase it more than 15 mV we don't improve the SNR. We set the line amplitude to 15mV that corresponds to ~10 of SNR.
3. Correction filter modification attempt
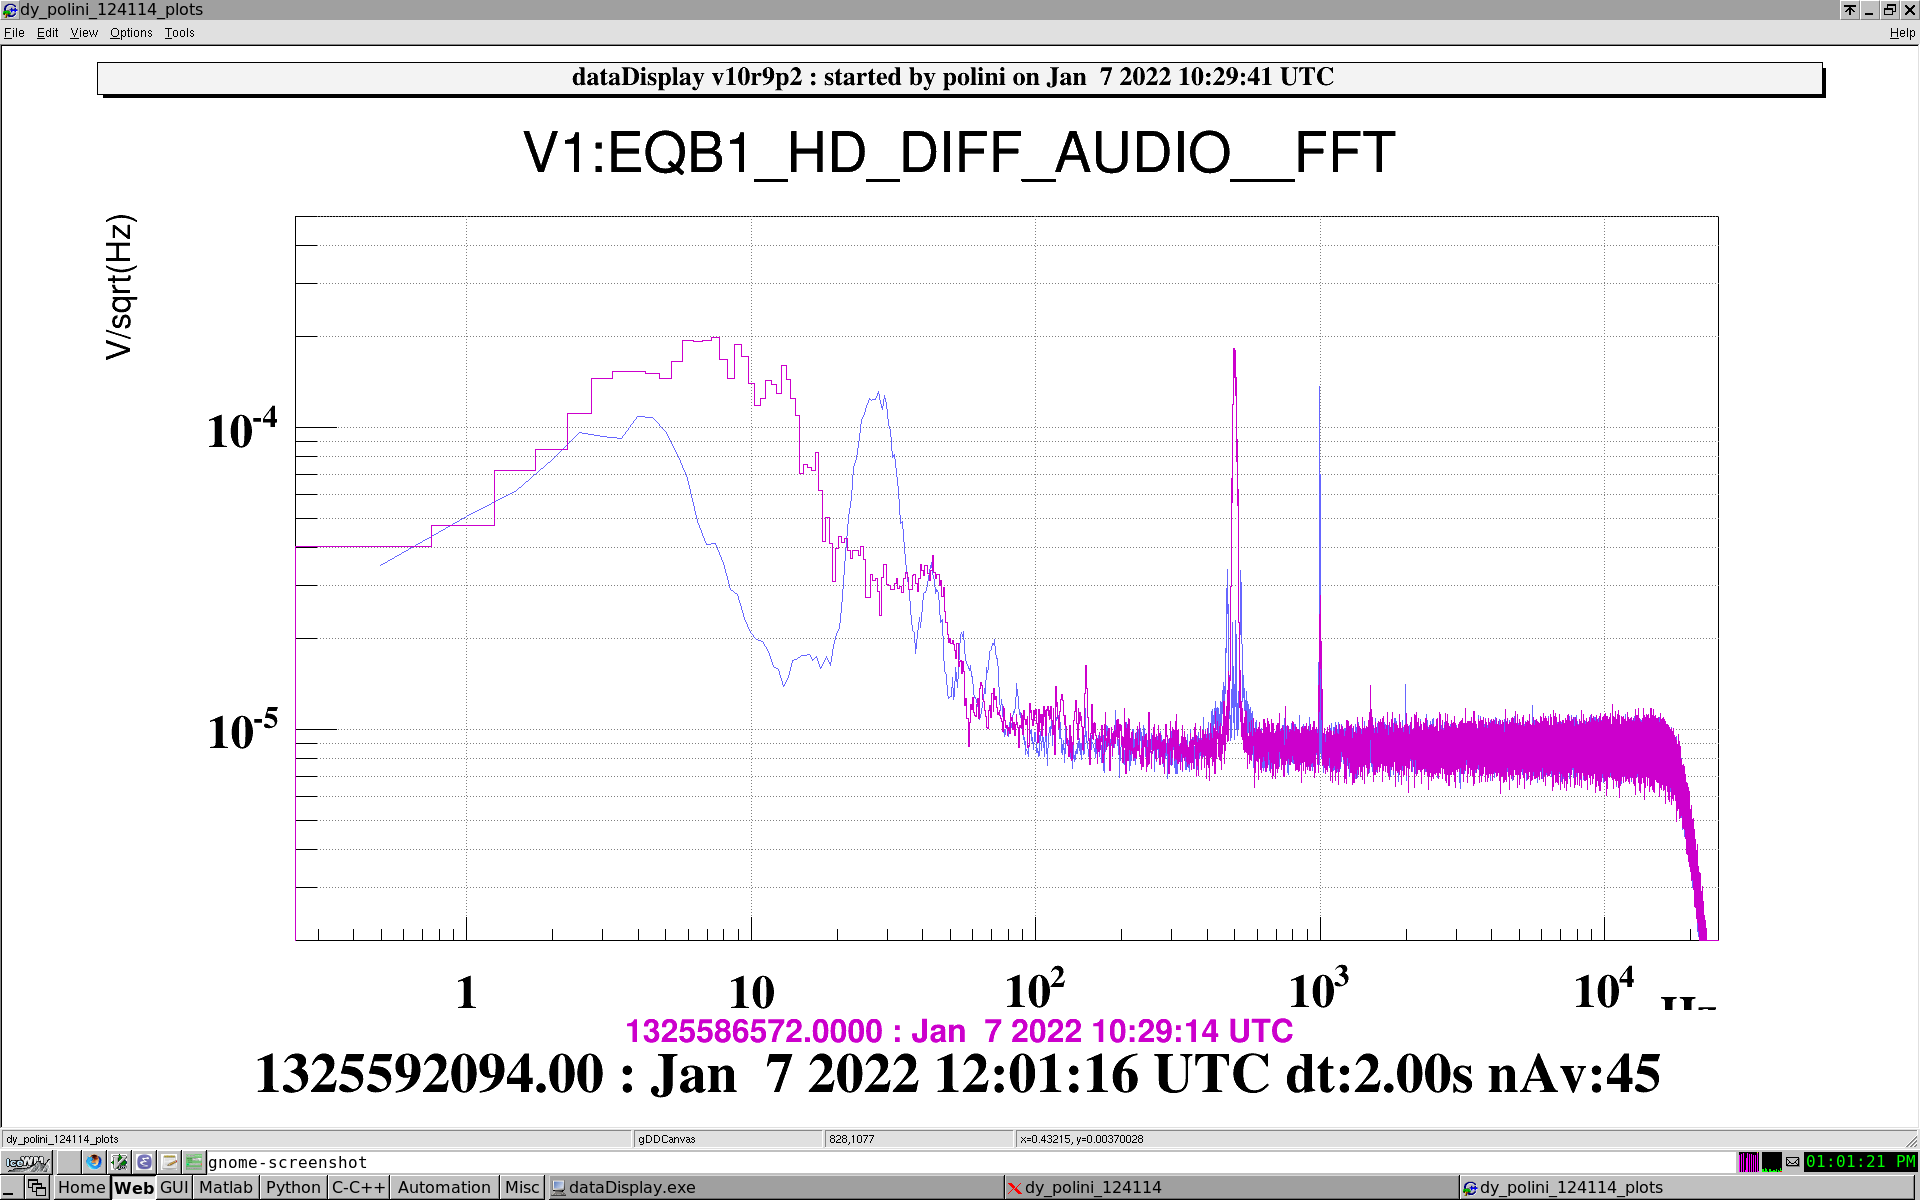
We needed to tune the demodulation phase after the reconfiguration of the DAQ system: phi0 = 2.9 rad.
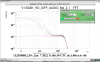
We can close the loop but this time we are not able to completely correct the bump, as shown in Fig. 4. In fact we are correcting only ~15 Hz but it is like if the bump is too large to be entirely corrected.
We tried to modify the correction filter putting a boost or a resonant filter and tuning the gain. We didn't manage to improve the loop in this way.
4. Attempt to close the stray light active loop on the input mirror of the Filter Cavity
Since the mirror M4_Z is used also on the CC coarse loop, we should move one of the actuations of these loops on the input mirror of the filter cavity.
We tried to move the stray light loop actuation on the input mirror and we checked the behavior of the stray light loop in this configuration.
We switched off the weight of the correction on M4_Z and switch on the weight of the correction in FCIM_LC with python:
-
EQB1_HD_AA.HD_M4_Z_cmd.HD_M4_Z_CORR = 0
-
FCIM_LC.MIR_Z_ACT.EQB1_HD_M4_Z_CORR = 1
And we verified that closing the stray light loop on the input mirror, we were sending the actuation on FCIM_LC_MIR_Z_ACT instead of EQB1_HD_M4_Z_cmd.
We were not able to correct the bump in this configuration. We switched back the correction to M4_Z.
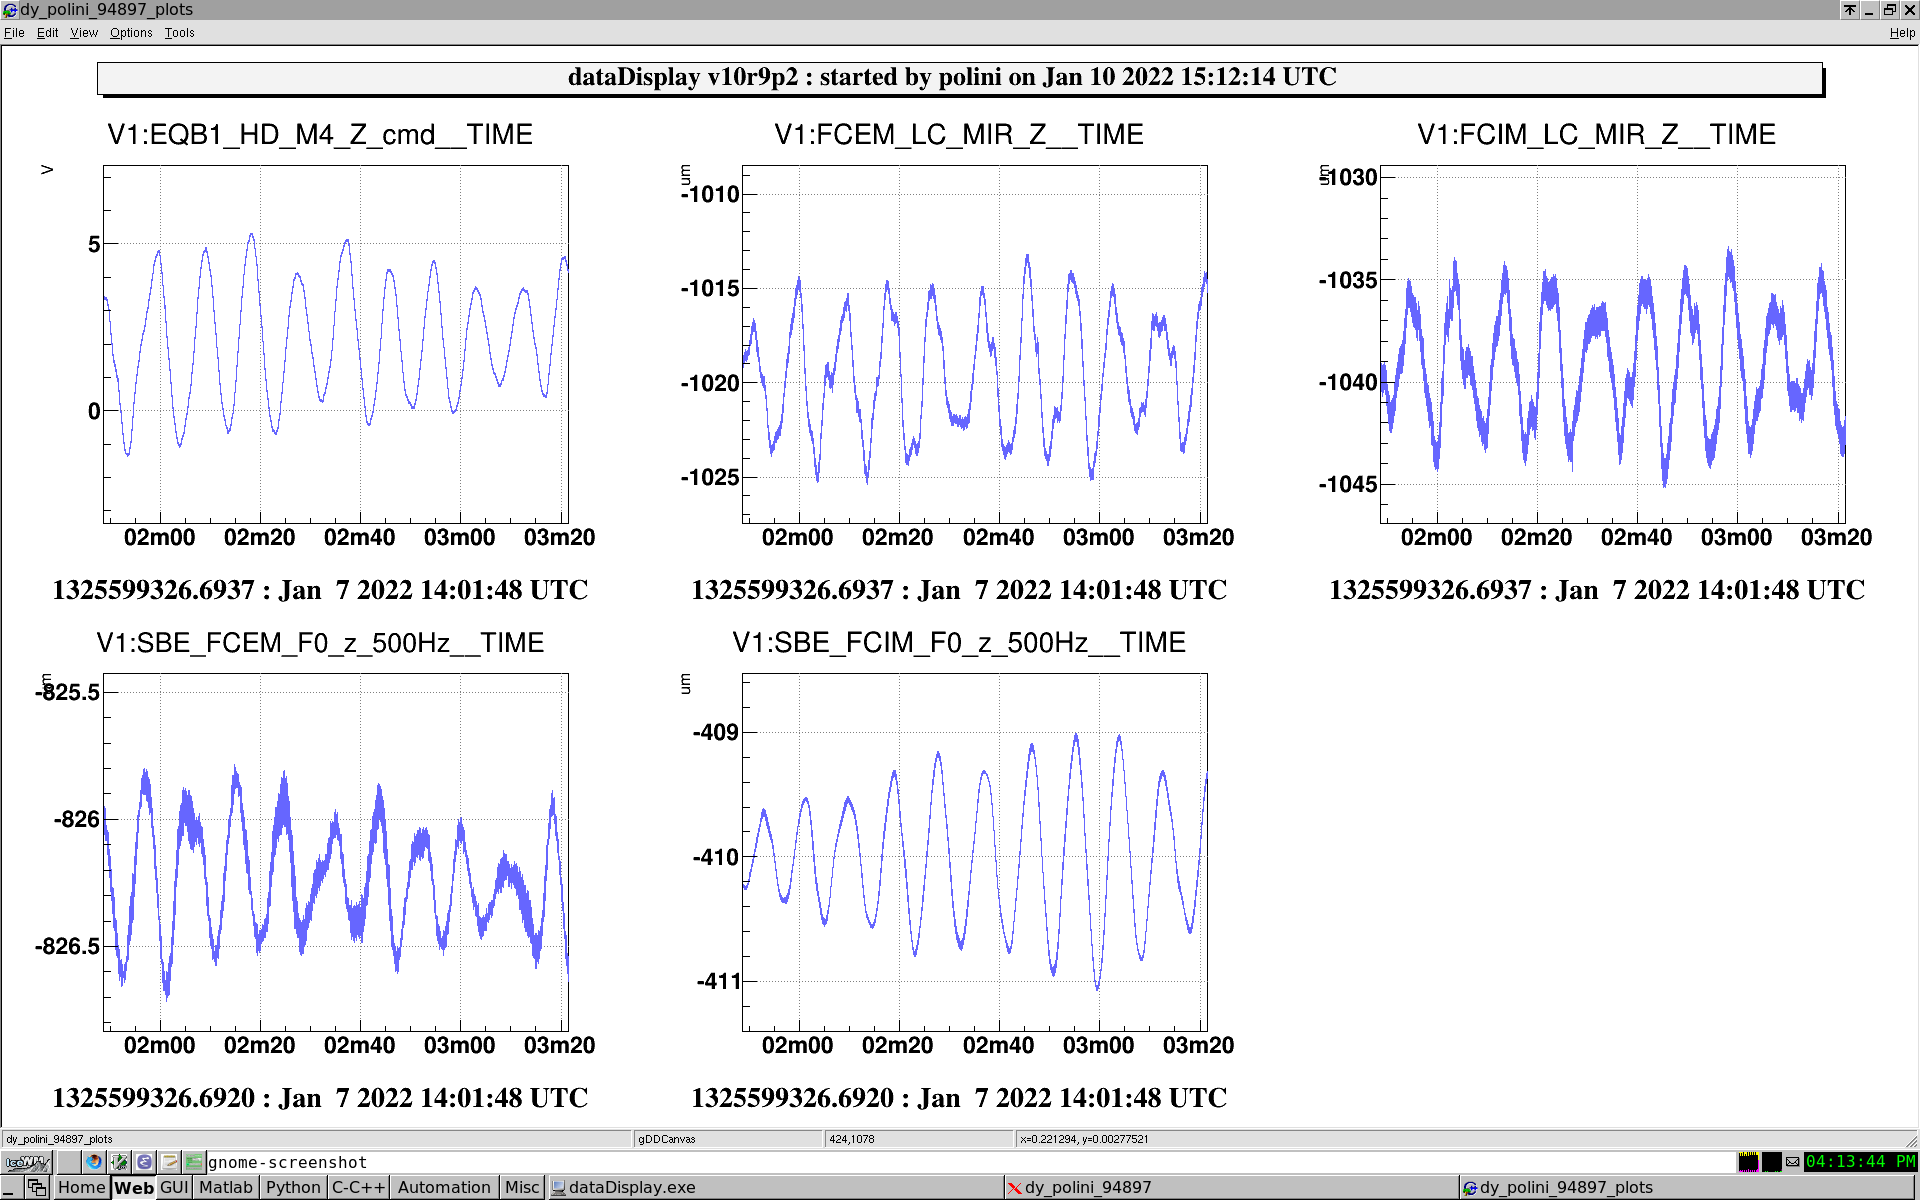
5. Correlation between EQB1_HD_M4_Z_cmd and FCIM_LC_MIR_Z
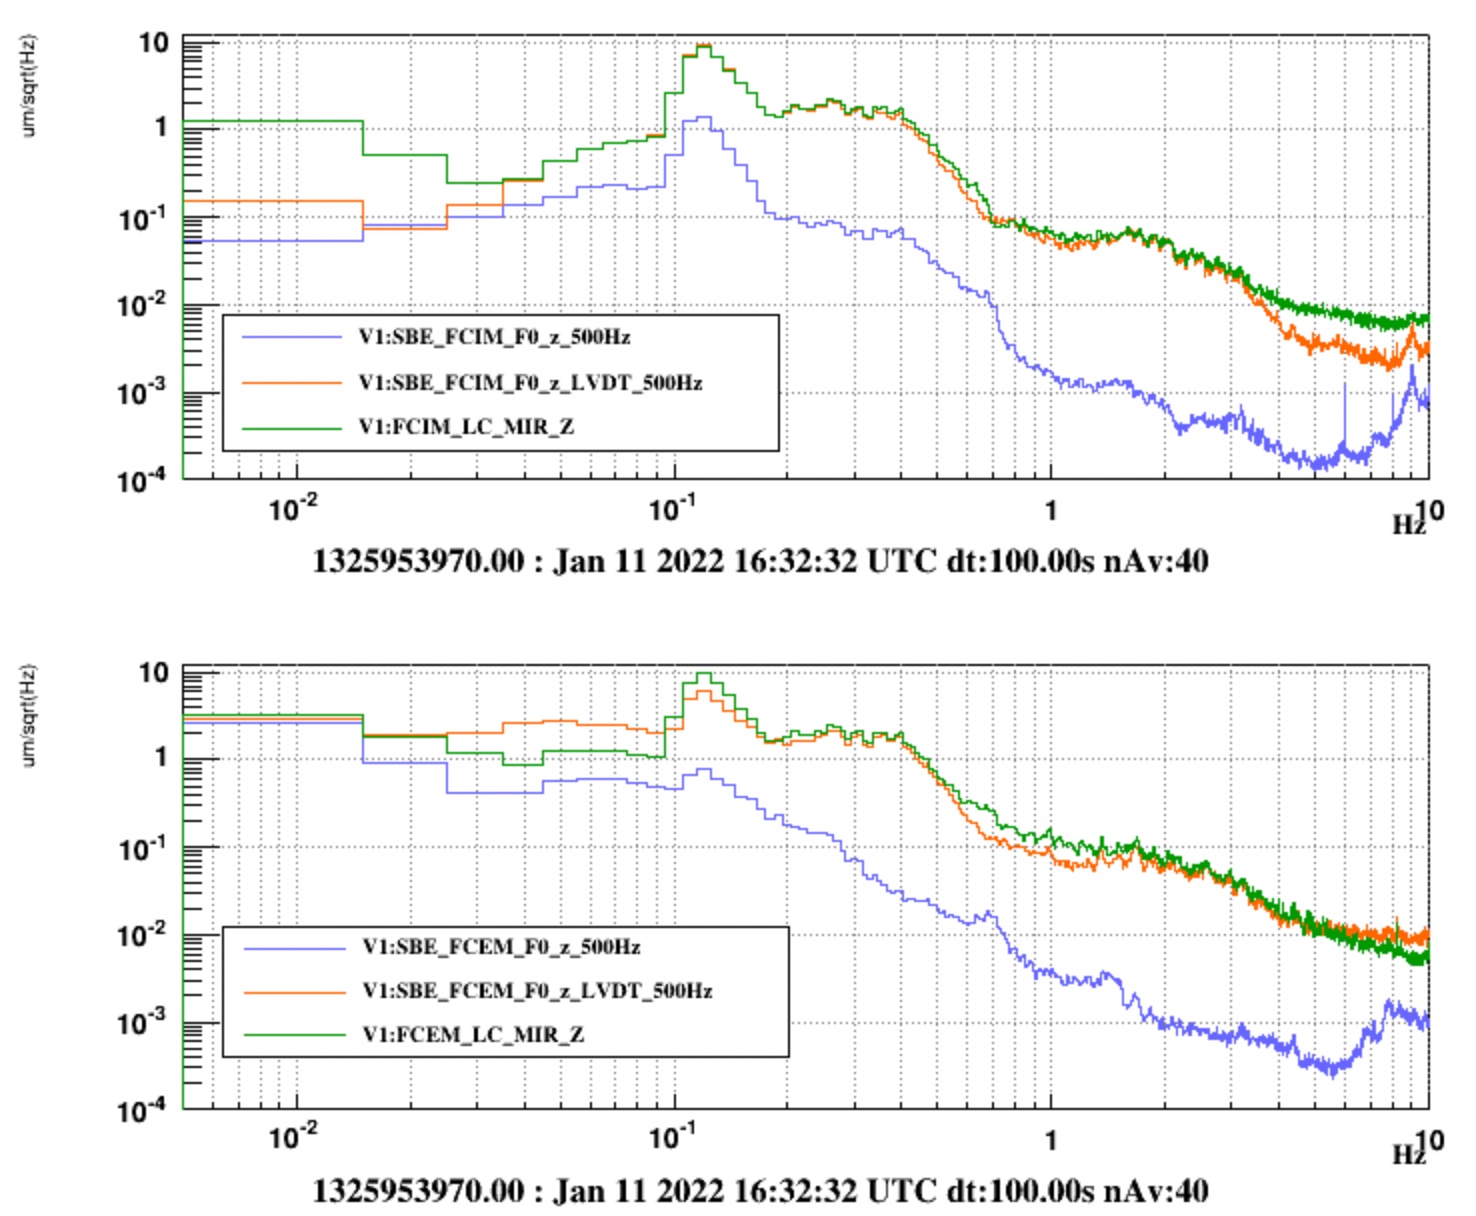
We noticed a correlation between the correction of the stray light loop EQB1_HD_M4_Z_cmd and the movement of the input mirror of the filter cavity, see Fig. 5.
This could suggest that the residual motion of the cavity is generating most of the stray light. We will discuss with SBE expert in order to better investigate this possible issue.
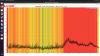
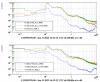
6. Spectrogram of AUDIO DIFF channel during the weekend
In order to better understand the bump behavior, we left the system with the LO during the weekend in order to acquire data of the bump.
In Fig. 6, the seismic activity over the weekend: on Sunday 9th there was more seismic activity wrt to Saturday 8th.
In Fig. 7, the comparison of the AUDIO DIFF channel spectra between Sunday (blue) and Saturday (magenta): the blue bump is bigger.
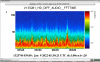
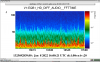
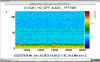
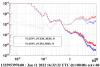
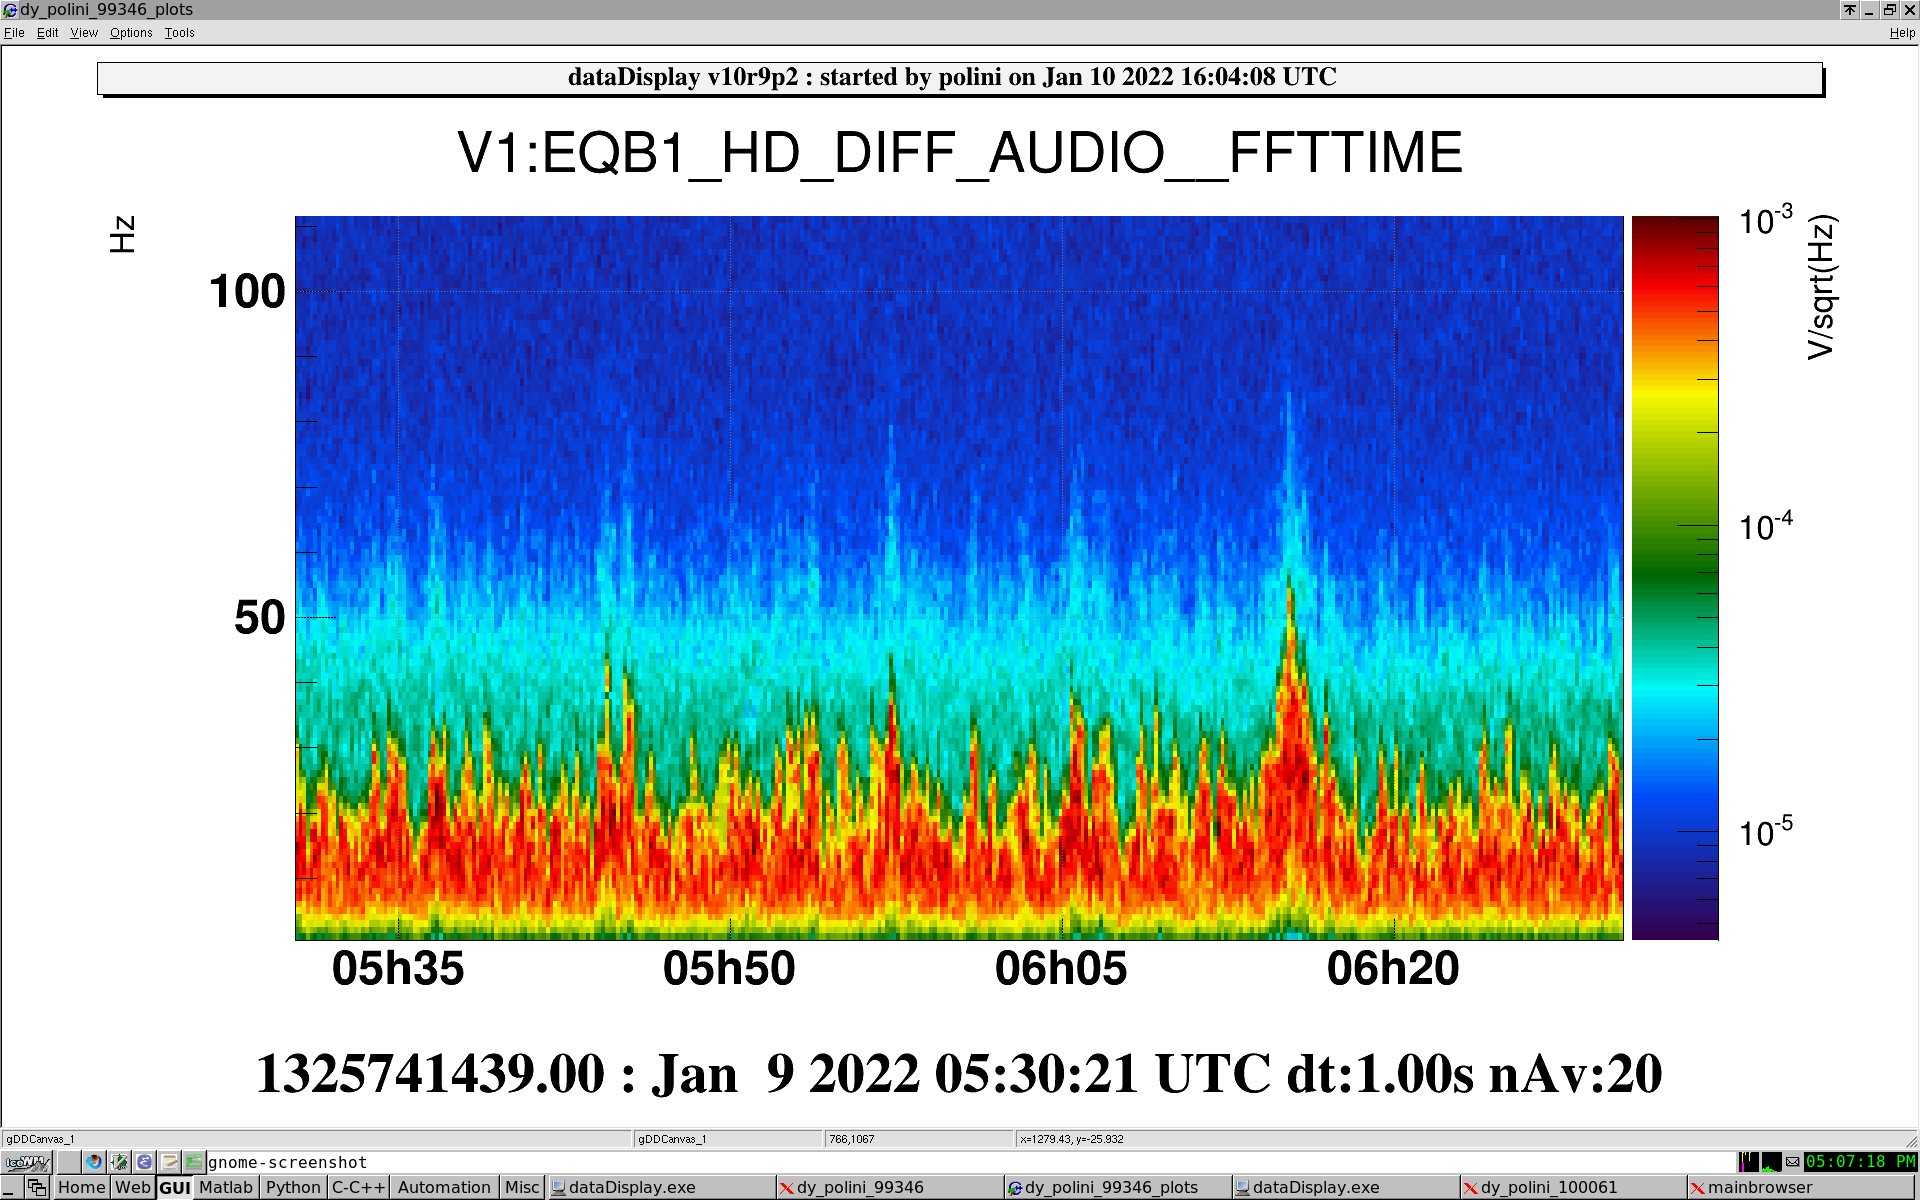
We also analized the spectrograms for different times:
- Jan 9th 2022 @ 5h30 UTC (Fig. 8)
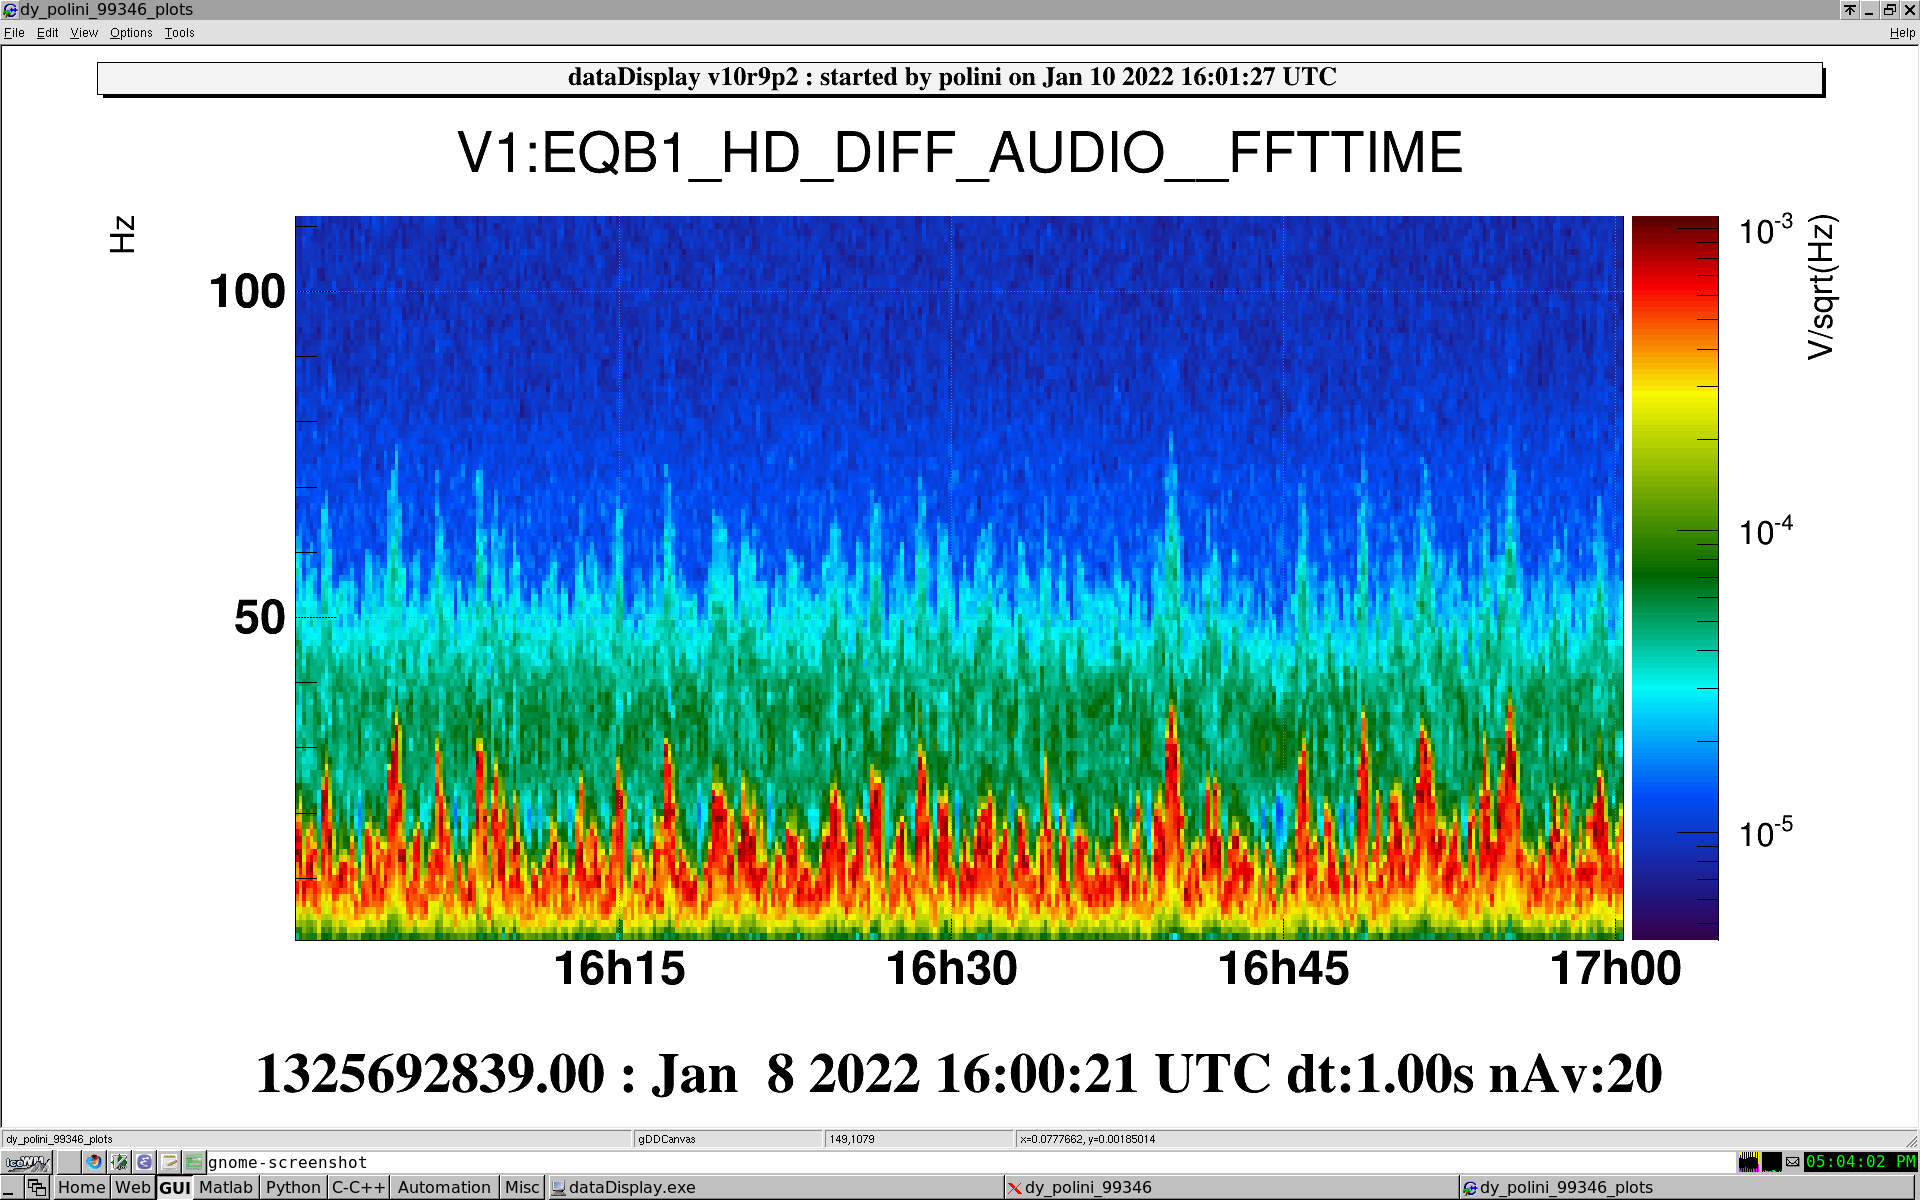
- Jan 8th 2022 @ 16h00 UTC (Fig. 9)
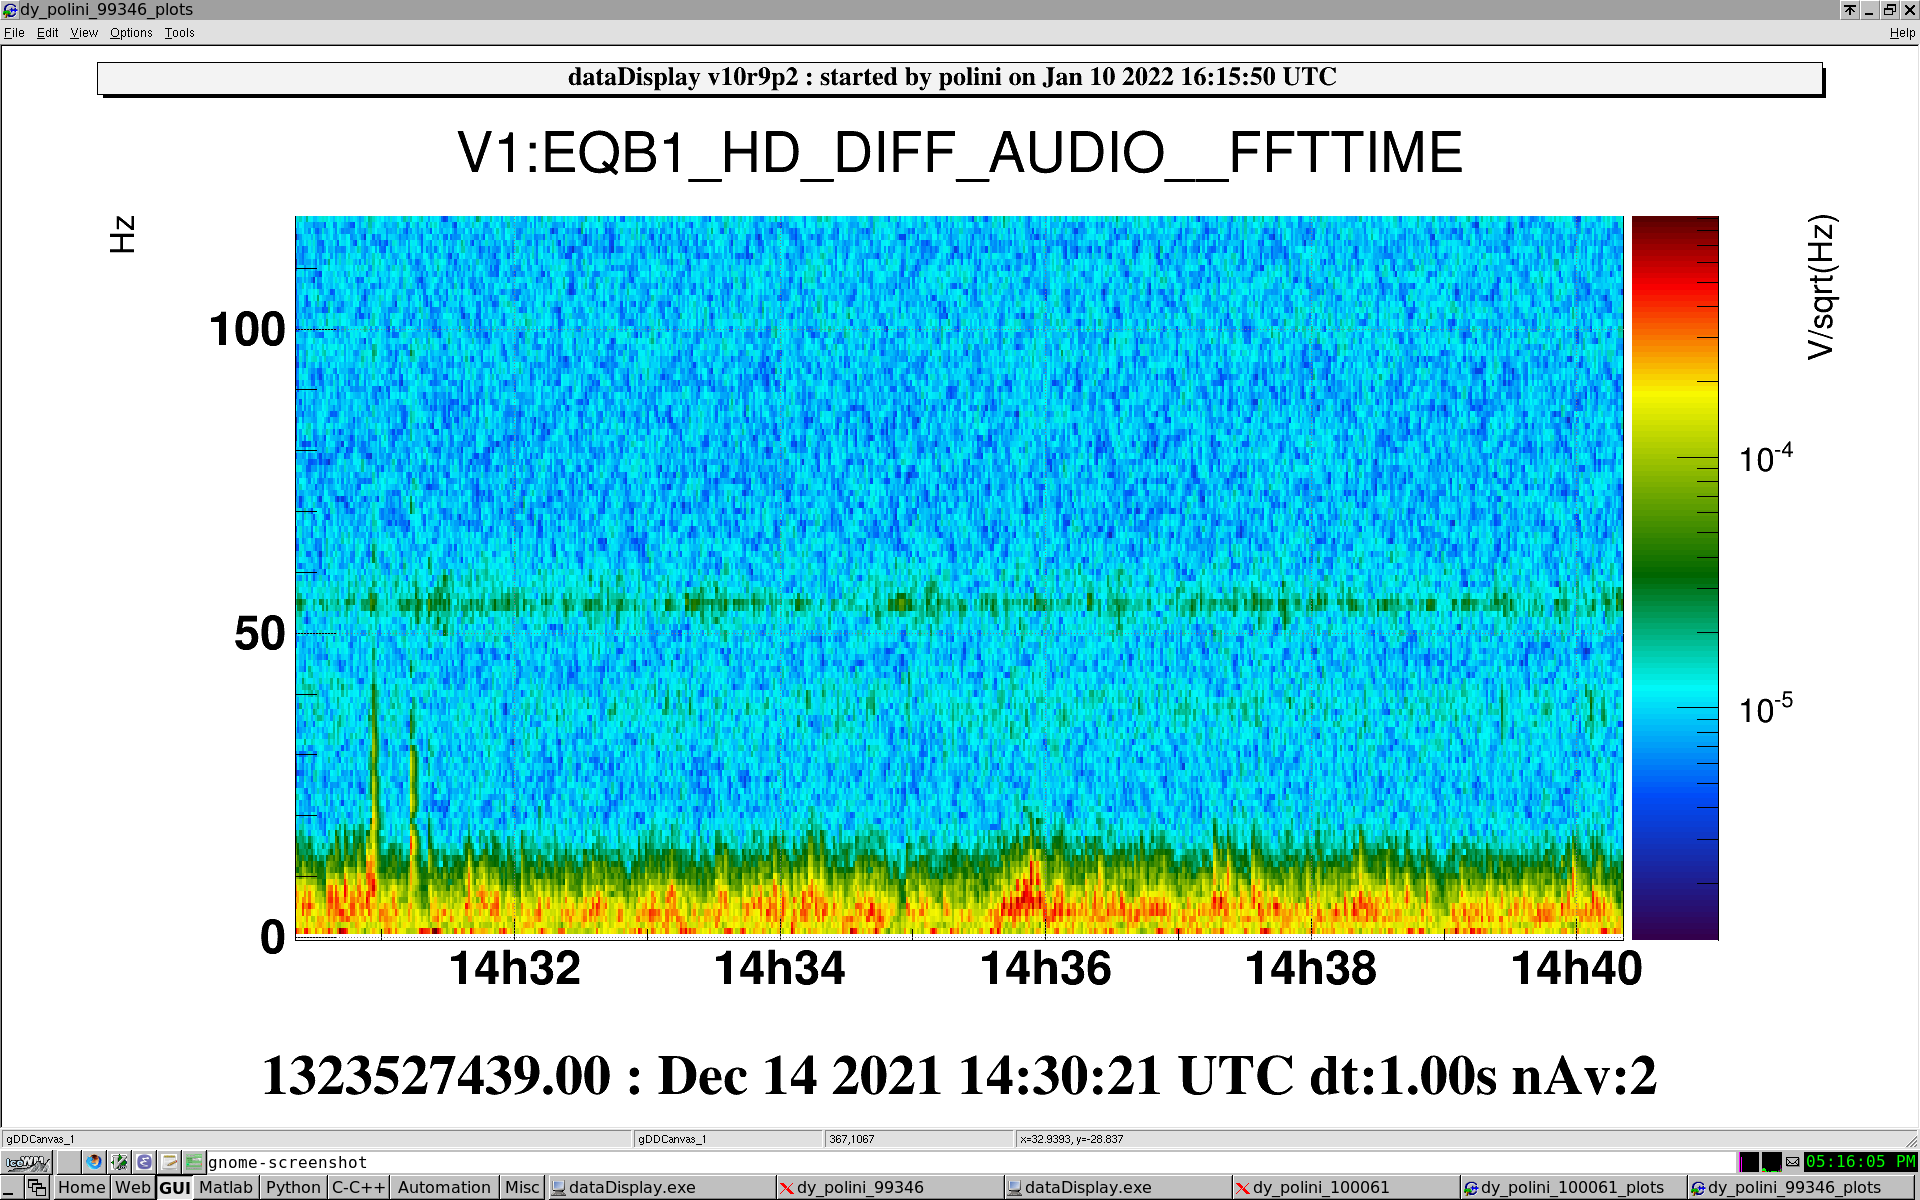
- Dec 14th 2021 @ 14h30 UTC (Fig. 10)
We can see that in December the stray light arches are smaller (and less spead in frequency) wrt to January spectrograms.
We also can see that in Jan 9th the arches are more spead in frequency than in Jan 8th.
As we already expected the bump is strongly influenced by ENV conditions.
----------------------------------------------------------------------------------------------------------------------------------------------------------------------------
We will go on with this activity this week, starting from recovering the optimal alignment of the system.

