The squeezer has been intentionally switched off this morning, this gives some nice data to look at to investigate noise underneath shot noise.
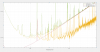
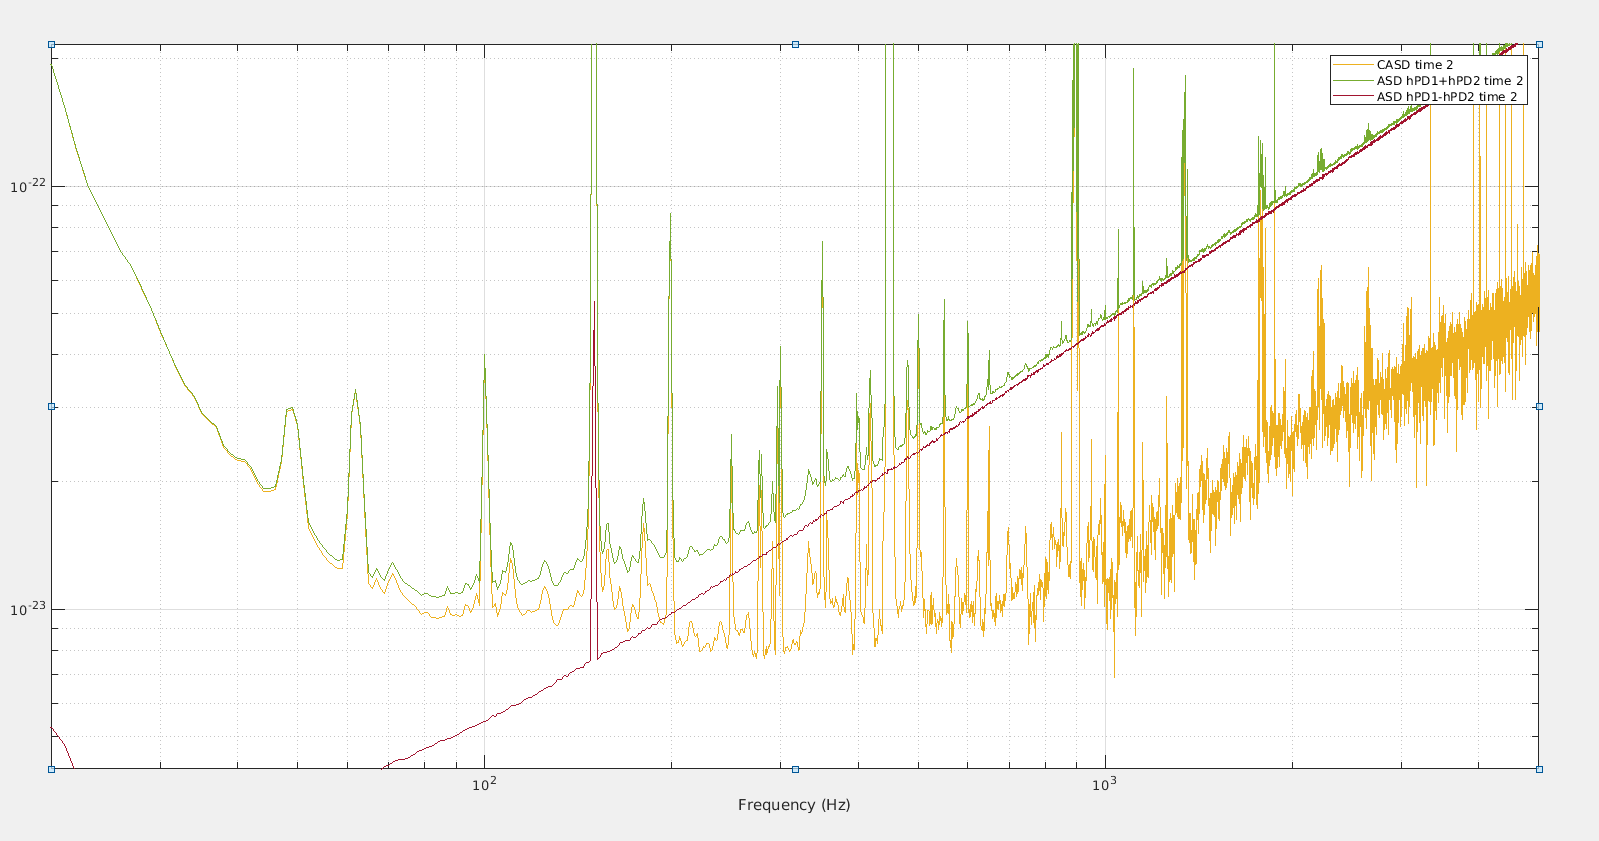
HrecPD1 and HrecPD2 are h(t) recontruction that use only one of the two B1 photodiodes. The average of theses gives the normal h(t) (in green), the difference gives a measure of uncorrelated noise (shot noise + PD electronic noise, in dark red), and the cross-spectrum density gives the correlated noise (in yellow).
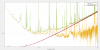
Figure 1 shows this with a 1Hz resolution for 3 hours of data and Figure 2 with a 0.1Hz resolution.
On figure 2 we can see that the sensitivity between 100Hz and 200Hz is covered by many lines and bumps which cover almost all of the spectrum in that band, at higher frequencies there is many bumps too. For example three bumps between 235Hz and 270Hz, and a wider structure between 330Hz and 390Hz.
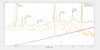
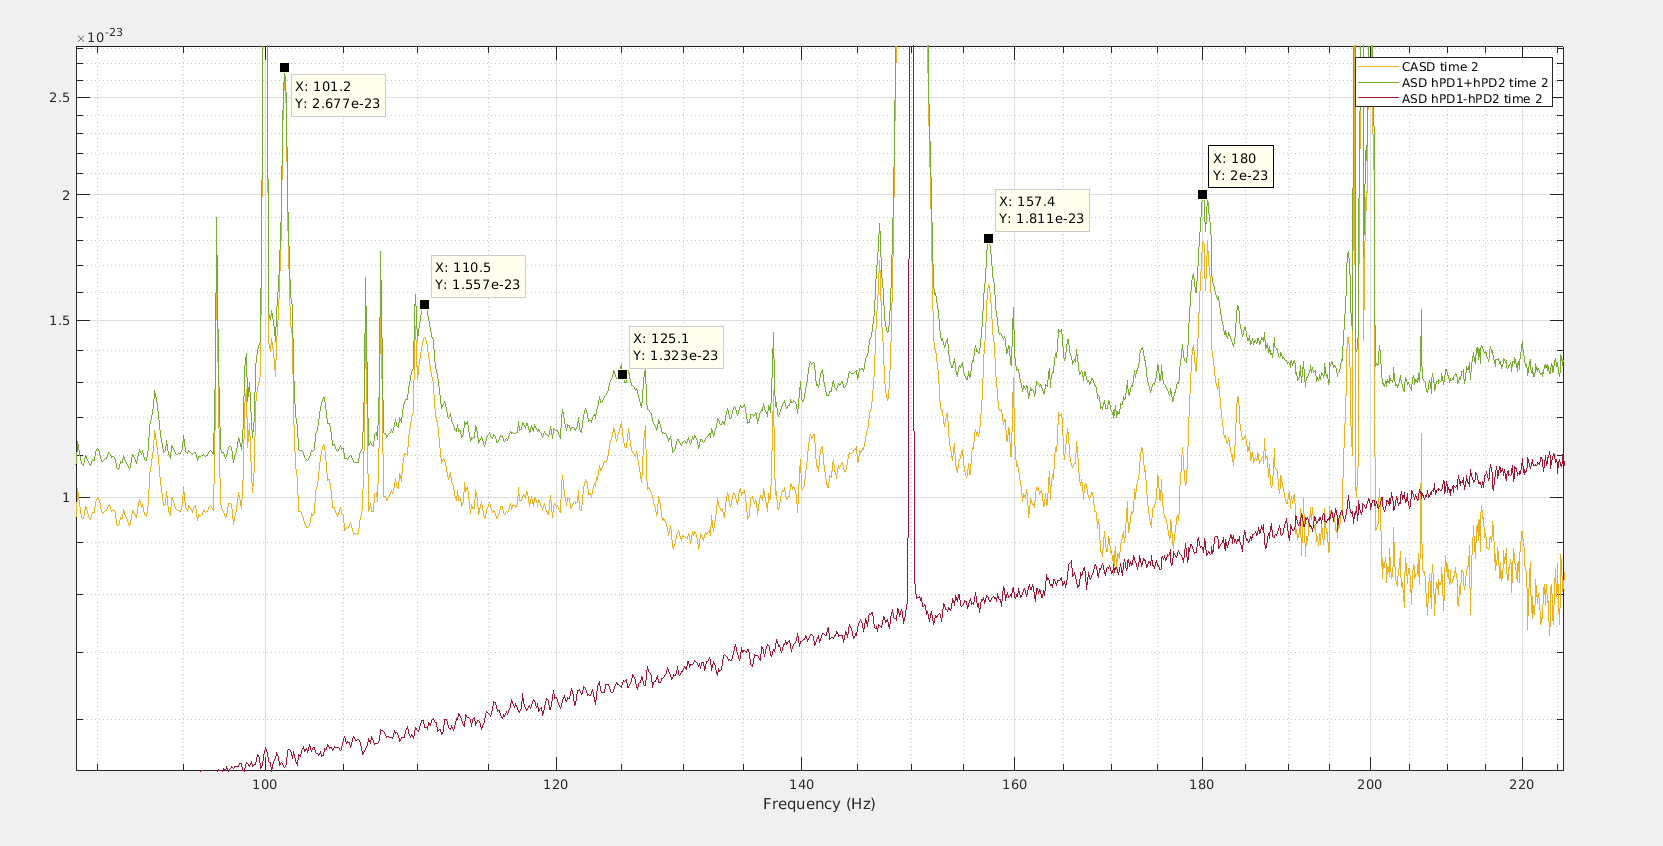
Figure 3 zoom in further in the 100-200Hz band. Some of the peak are known
- 101Hz and 157Hz are related to SIB1, probably to the beam dump receiving light from the Faraday isolator.
- 125Hz bump is related to SWEB and appeared recently
- 110Hz is a line which wanders between 80Hz and 120Hz that we have been seeing since O2
- 180Hz is related to something close to the cryotrap between SR and DT tower, it appeared after the Oct 2019 commissioning break
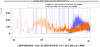
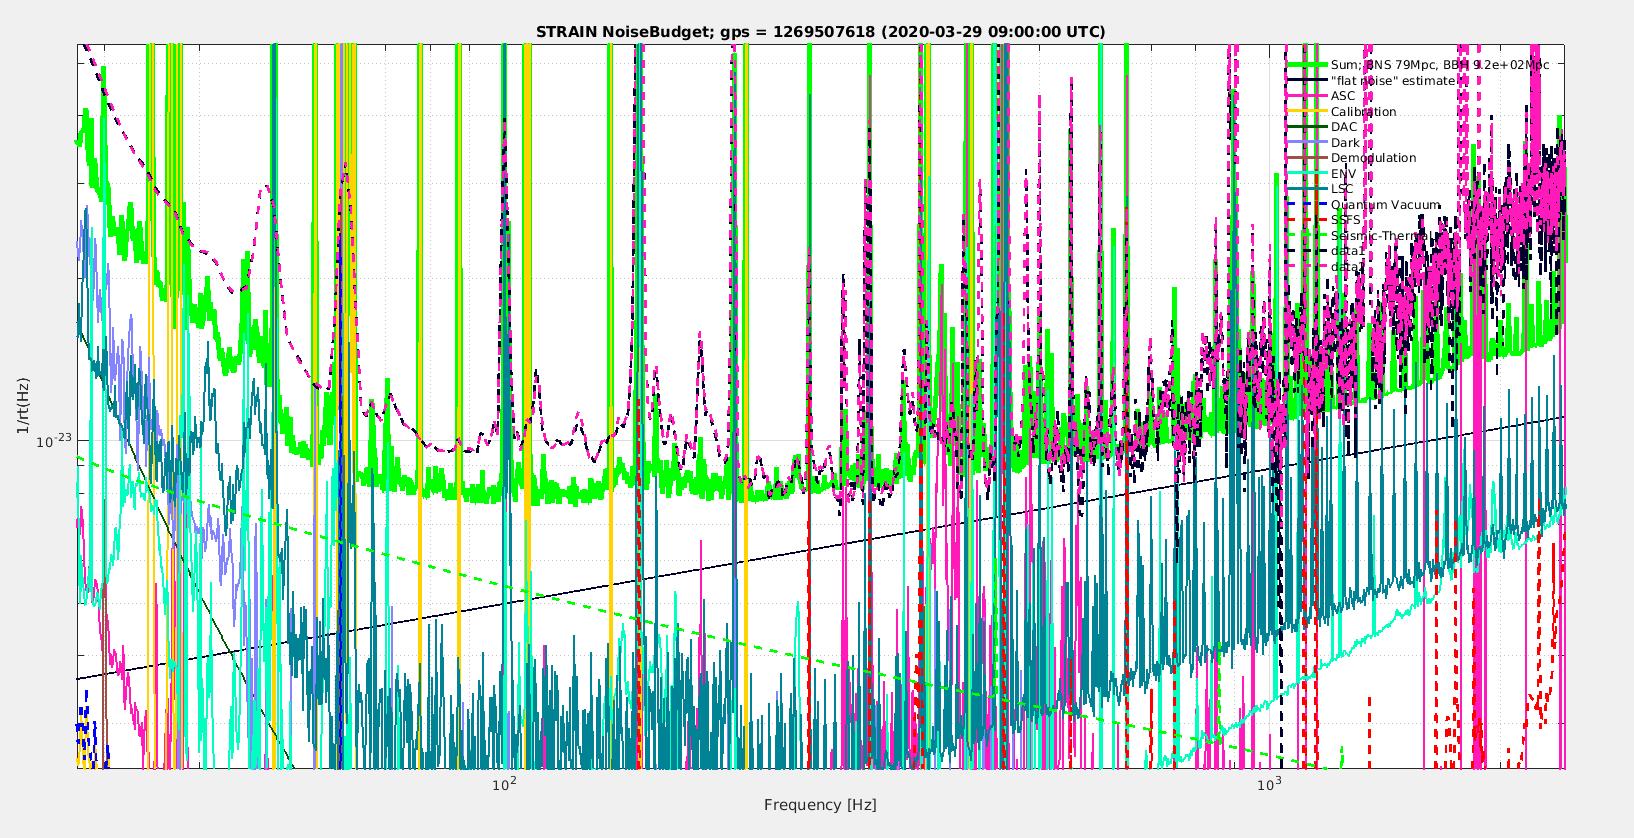
On figure 1 a broad hump between 1kHz and 3kHz is visible. This could be 56MHz RAM noise as there is some increase in coherence with B1s1 in that frequency band, see figure 4, it is not subtracted as there is no change in coherence at 2kHz where the subtraction stops. With 2% coherence it should be a factor 7 below the shot noise of a single B1 PD, ie a factor 5 below the shot noise of two B1 PDs. The frequency noise has a coherence of ~1% (see figure 1) and is not subtracted (no change of coherence at 3.5kHz), so it should be a factor 10 below the shot noise of a single PD, ie a factor 7 below the shot noise shown on figure 1 in dark red. Adding the two in quadrature gives a noise a factor 4.5 below shot noise at 2kHz and a factor 5 at 4kHz, while the ratio is rather 4. So most but not all of the noise above 1kHz can be explained by these two contributions, the remainder could be flat noise if it is at 1e-23 @2kHz as shown on figure 5.
Figure 5 compares this with the noise budget (after removing B1 quantum noise, B1 dark noise, and contrast defect shot noise). The dashed black and dash pink lines are the cross spectrum density with 1Hz resolution estimate using 1h and 3h of data. The bright green is the sum of all the noises. In the dips between bumps at 300Hz and 400Hz, the sum of noises is slightly above the measure cross correlated spectrum. This means that the flat noise estimate of 5e-24 @100Hz is slightly too large, or that the dependce with frequency is flatter than f^0.25 shown here. In the dips between lines in the 100-200Hz frequency range the spectrum is 90% explained by coating thermal noise + flat noise + residual frequency noise after subtraction (the 2% remaining coherence is shown on figure 4 and correspond to a noise a factor 7 below h(t)).
Below 80Hz the cross-spectrum density is not informative as it is the same as the normal h(t) spectrum, B1 PD shot noise is not contributing much to the sensitivity noise floor at low frequency.