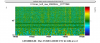
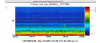
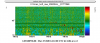
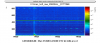
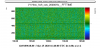
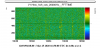
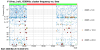
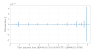
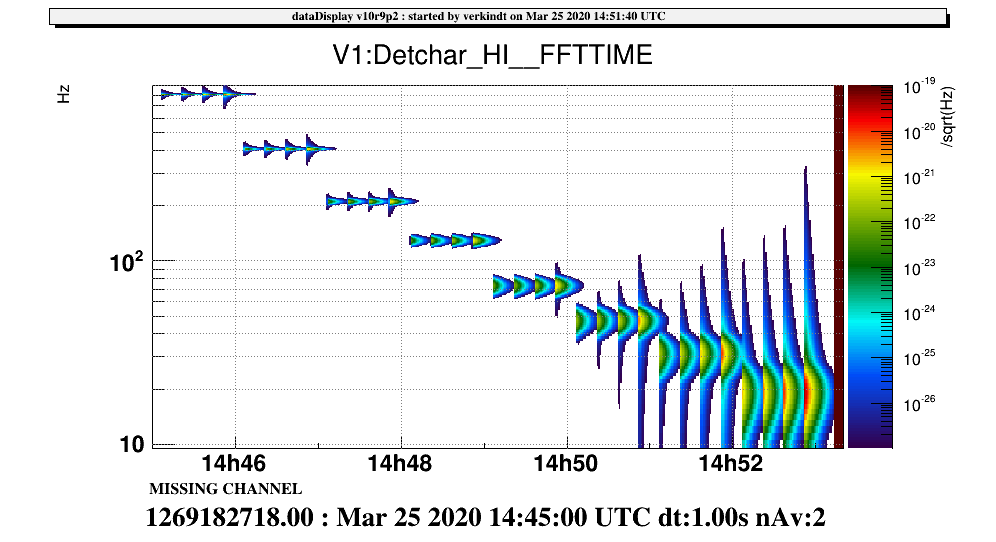
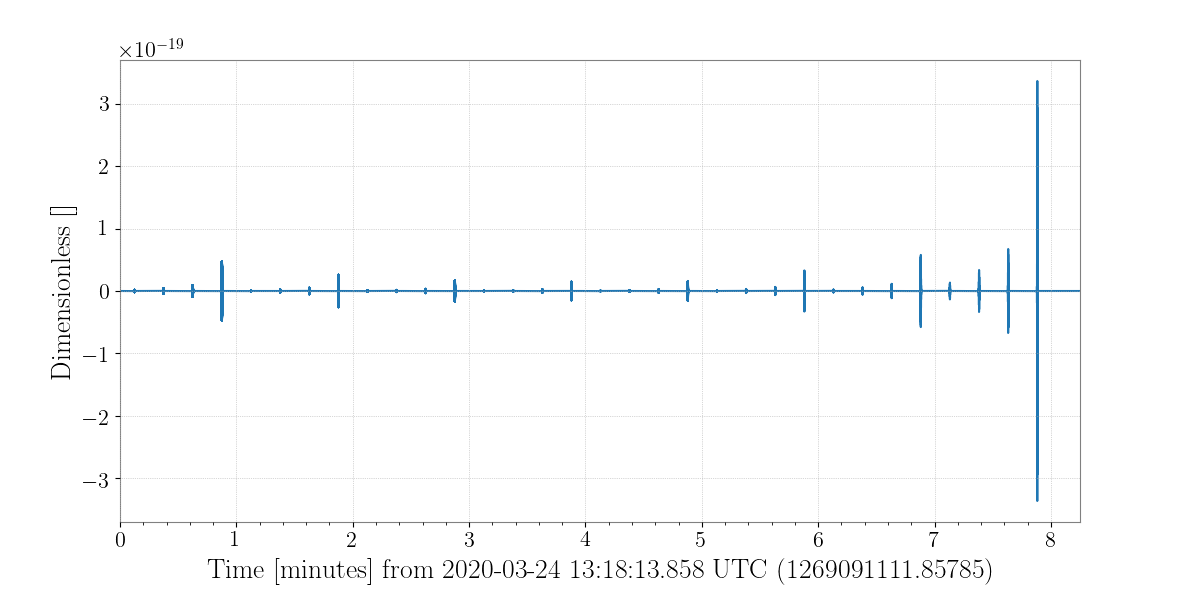
In the original frame file I generated, the injections were separated by 15 seconds and centered, meaning that the Gaussian term of the first injection is maximum at t0=7.5 s from the beginning of the frame file. And so on and so forth every 15 seconds.
=> More information below [the actual GPS times do not matter: they got overwritten by Didier before making the injections] and in the attached plot:
Samping frequency = 10000 Hz => dt = 0.0001 s
Injection gap = 15 s
=> duration = 495 s
# of samples = 4950000
Injection 1 / 32: t0 = 1269091119.36 [2020-03-24 13:18:21.357850+00:00 UTC], f = 811.0 Hz & tau = 0.1 s (Q = 509.57), snr = 20 => a = 1.9074e-21
Injection 2 / 32: t0 = 1269091134.36 [2020-03-24 13:18:36.357850+00:00 UTC], f = 811.0 Hz & tau = 0.1 s (Q = 509.57), snr = 50 => a = 4.7685e-21
Injection 3 / 32: t0 = 1269091149.36 [2020-03-24 13:18:51.357850+00:00 UTC], f = 811.0 Hz & tau = 0.1 s (Q = 509.57), snr = 100 => a = 9.537e-21
Injection 4 / 32: t0 = 1269091164.36 [2020-03-24 13:19:06.357850+00:00 UTC], f = 811.0 Hz & tau = 0.1 s (Q = 509.57), snr = 500 => a = 4.7685e-20
Injection 5 / 32: t0 = 1269091179.36 [2020-03-24 13:19:21.357850+00:00 UTC], f = 409.0 Hz & tau = 0.1 s (Q = 256.98), snr = 20 => a = 1.043e-21
Injection 6 / 32: t0 = 1269091194.36 [2020-03-24 13:19:36.357850+00:00 UTC], f = 409.0 Hz & tau = 0.1 s (Q = 256.98), snr = 50 => a = 2.6075e-21
Injection 7 / 32: t0 = 1269091209.36 [2020-03-24 13:19:51.357850+00:00 UTC], f = 409.0 Hz & tau = 0.1 s (Q = 256.98), snr = 100 => a = 5.215e-21
Injection 8 / 32: t0 = 1269091224.36 [2020-03-24 13:20:06.357850+00:00 UTC], f = 409.0 Hz & tau = 0.1 s (Q = 256.98), snr = 500 => a = 2.6075e-20
Injection 9 / 32: t0 = 1269091239.36 [2020-03-24 13:20:21.357850+00:00 UTC], f = 211.0 Hz & tau = 0.1 s (Q = 132.58), snr = 20 => a = 6.888e-22
Injection 10 / 32: t0 = 1269091254.36 [2020-03-24 13:20:36.357850+00:00 UTC], f = 211.0 Hz & tau = 0.1 s (Q = 132.58), snr = 50 => a = 1.722e-21
Injection 11 / 32: t0 = 1269091269.36 [2020-03-24 13:20:51.357850+00:00 UTC], f = 211.0 Hz & tau = 0.1 s (Q = 132.58), snr = 100 => a = 3.444e-21
Injection 12 / 32: t0 = 1269091284.36 [2020-03-24 13:21:06.357850+00:00 UTC], f = 211.0 Hz & tau = 0.1 s (Q = 132.58), snr = 500 => a = 1.722e-20
Injection 13 / 32: t0 = 1269091299.36 [2020-03-24 13:21:21.357850+00:00 UTC], f = 129.0 Hz & tau = 0.1 s (Q = 81.05), snr = 20 => a = 6.022e-22
Injection 14 / 32: t0 = 1269091314.36 [2020-03-24 13:21:36.357850+00:00 UTC], f = 129.0 Hz & tau = 0.1 s (Q = 81.05), snr = 50 => a = 1.5055e-21
Injection 15 / 32: t0 = 1269091329.36 [2020-03-24 13:21:51.357850+00:00 UTC], f = 129.0 Hz & tau = 0.1 s (Q = 81.05), snr = 100 => a = 3.011e-21
Injection 16 / 32: t0 = 1269091344.36 [2020-03-24 13:22:06.357850+00:00 UTC], f = 129.0 Hz & tau = 0.1 s (Q = 81.05), snr = 500 => a = 1.5055e-20
Injection 17 / 32: t0 = 1269091359.36 [2020-03-24 13:22:21.357850+00:00 UTC], f = 73.0 Hz & tau = 0.1 s (Q = 45.87), snr = 20 => a = 6.438e-22
Injection 18 / 32: t0 = 1269091374.36 [2020-03-24 13:22:36.357850+00:00 UTC], f = 73.0 Hz & tau = 0.1 s (Q = 45.87), snr = 50 => a = 1.6095e-21
Injection 19 / 32: t0 = 1269091389.36 [2020-03-24 13:22:51.357850+00:00 UTC], f = 73.0 Hz & tau = 0.1 s (Q = 45.87), snr = 100 => a = 3.219e-21
Injection 20 / 32: t0 = 1269091404.36 [2020-03-24 13:23:06.357850+00:00 UTC], f = 73.0 Hz & tau = 0.1 s (Q = 45.87), snr = 500 => a = 1.6095e-20
Injection 21 / 32: t0 = 1269091419.36 [2020-03-24 13:23:21.357850+00:00 UTC], f = 47.0 Hz & tau = 0.1 s (Q = 29.53), snr = 20 => a = 1.3204e-21
Injection 22 / 32: t0 = 1269091434.36 [2020-03-24 13:23:36.357850+00:00 UTC], f = 47.0 Hz & tau = 0.1 s (Q = 29.53), snr = 50 => a = 3.301e-21
Injection 23 / 32: t0 = 1269091449.36 [2020-03-24 13:23:51.357850+00:00 UTC], f = 47.0 Hz & tau = 0.1 s (Q = 29.53), snr = 100 => a = 6.602e-21
Injection 24 / 32: t0 = 1269091464.36 [2020-03-24 13:24:06.357850+00:00 UTC], f = 47.0 Hz & tau = 0.1 s (Q = 29.53), snr = 500 => a = 3.301e-20
Injection 25 / 32: t0 = 1269091479.36 [2020-03-24 13:24:21.357850+00:00 UTC], f = 31.0 Hz & tau = 0.1 s (Q = 19.48), snr = 20 => a = 2.328e-21
Injection 26 / 32: t0 = 1269091494.36 [2020-03-24 13:24:36.357850+00:00 UTC], f = 31.0 Hz & tau = 0.1 s (Q = 19.48), snr = 50 => a = 5.82e-21
Injection 27 / 32: t0 = 1269091509.36 [2020-03-24 13:24:51.357850+00:00 UTC], f = 31.0 Hz & tau = 0.1 s (Q = 19.48), snr = 100 => a = 1.164e-20
Injection 28 / 32: t0 = 1269091524.36 [2020-03-24 13:25:06.357850+00:00 UTC], f = 31.0 Hz & tau = 0.1 s (Q = 19.48), snr = 500 => a = 5.82e-20
Injection 29 / 32: t0 = 1269091539.36 [2020-03-24 13:25:21.357850+00:00 UTC], f = 19.0 Hz & tau = 0.1 s (Q = 11.94), snr = 20 => a = 1.3694e-20
Injection 30 / 32: t0 = 1269091554.36 [2020-03-24 13:25:36.357850+00:00 UTC], f = 19.0 Hz & tau = 0.1 s (Q = 11.94), snr = 50 => a = 3.4235e-20
Injection 31 / 32: t0 = 1269091569.36 [2020-03-24 13:25:51.357850+00:00 UTC], f = 19.0 Hz & tau = 0.1 s (Q = 11.94), snr = 100 => a = 6.847e-20
Injection 32 / 32: t0 = 1269091584.36 [2020-03-24 13:26:06.357850+00:00 UTC], f = 19.0 Hz & tau = 0.1 s (Q = 11.94), snr = 500 => a = 3.4235e-19
