Reports 1-1 of 1 Clear search Modify search
Detector Characterisation (Spectral lines)
janssens - 10:50 Thursday 19 March 2020 (48743) Print this report
Noise lines 440-455 Hz

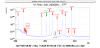
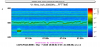
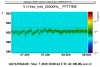
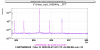
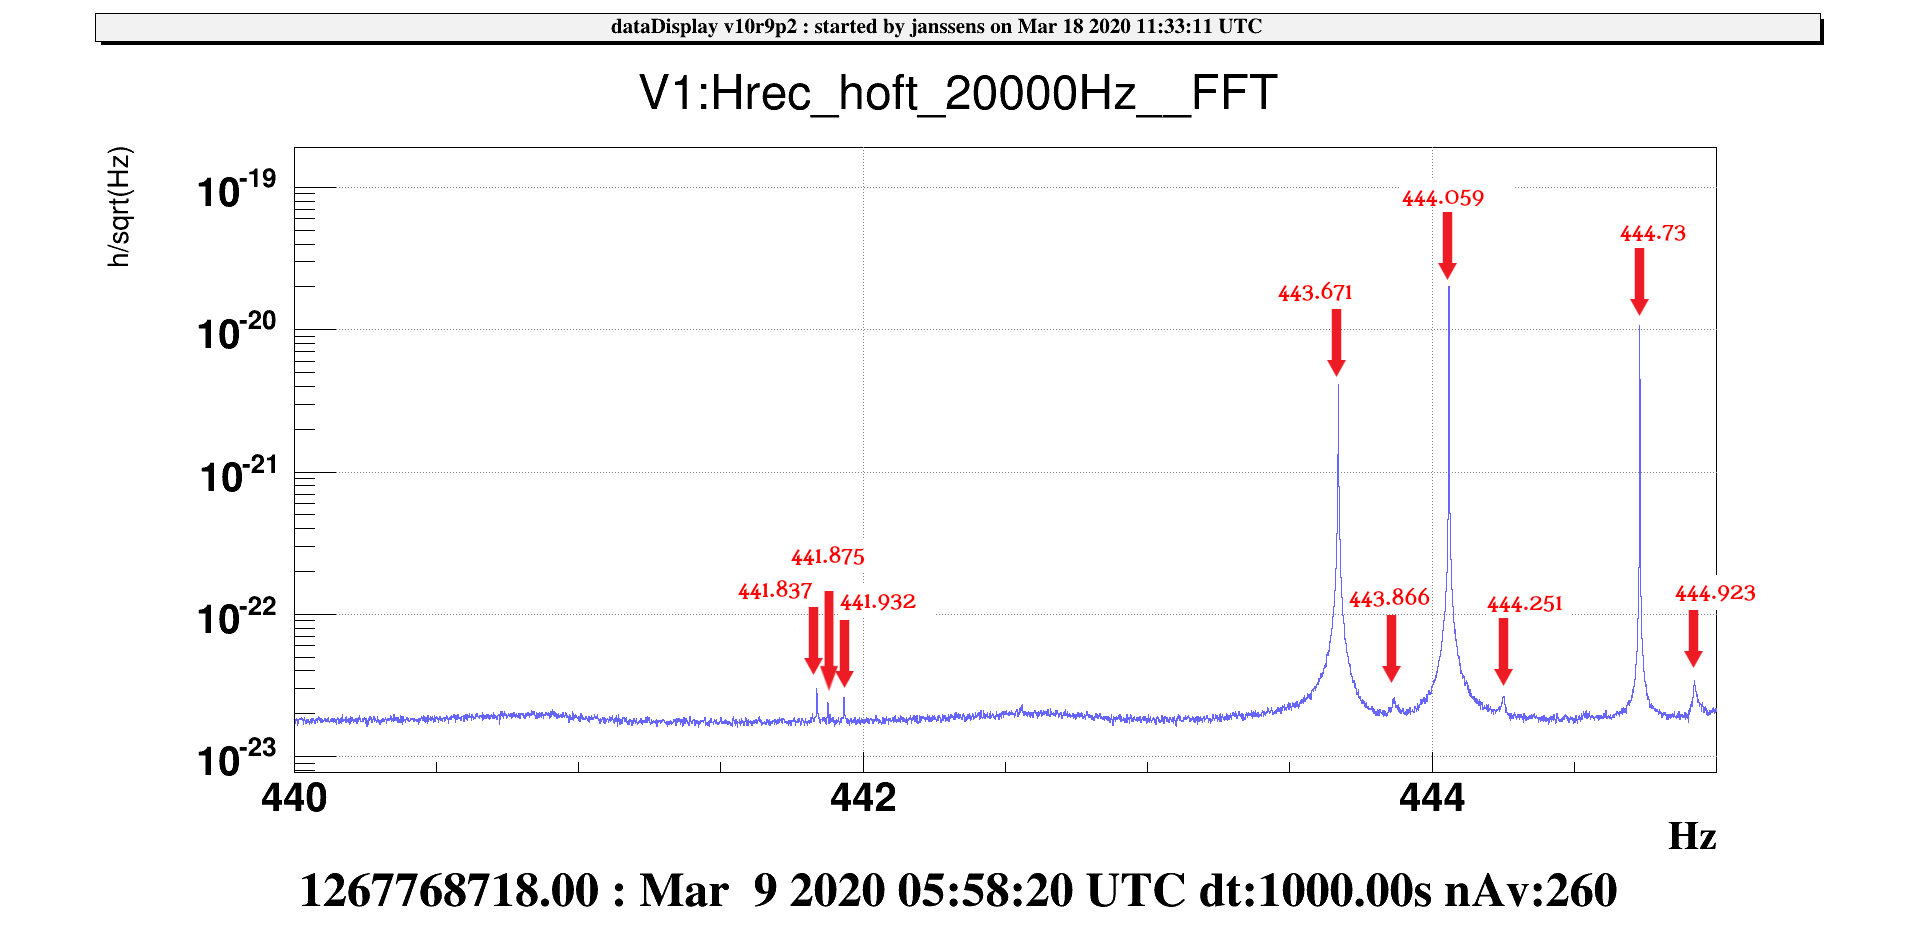
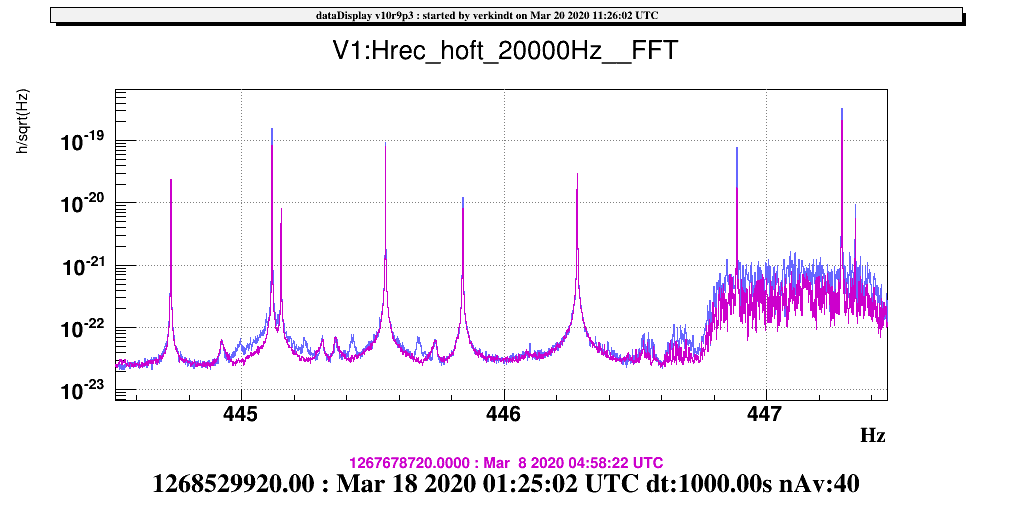
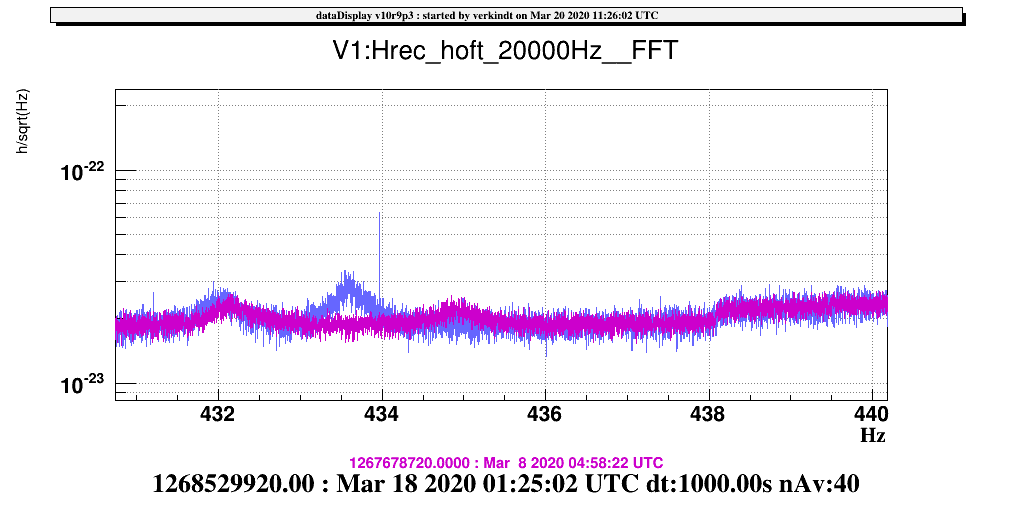
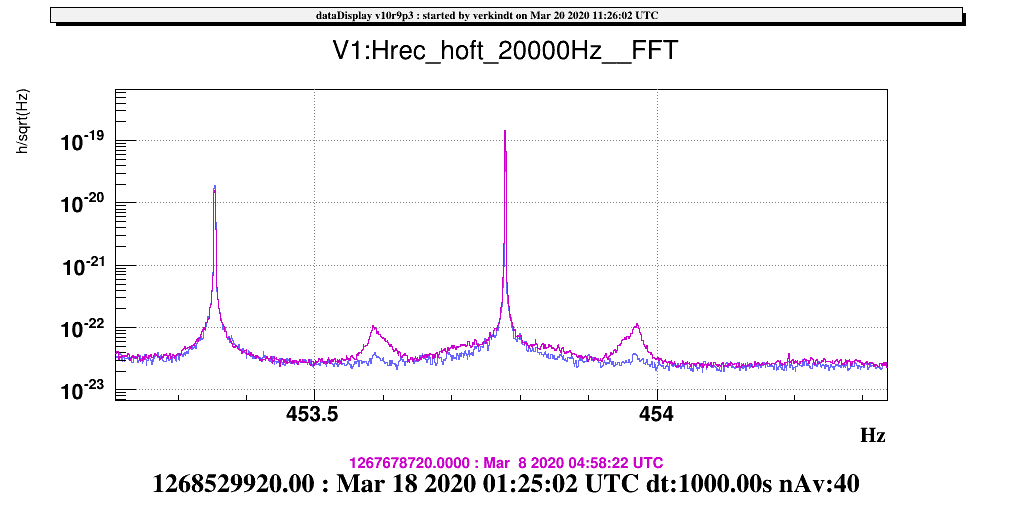
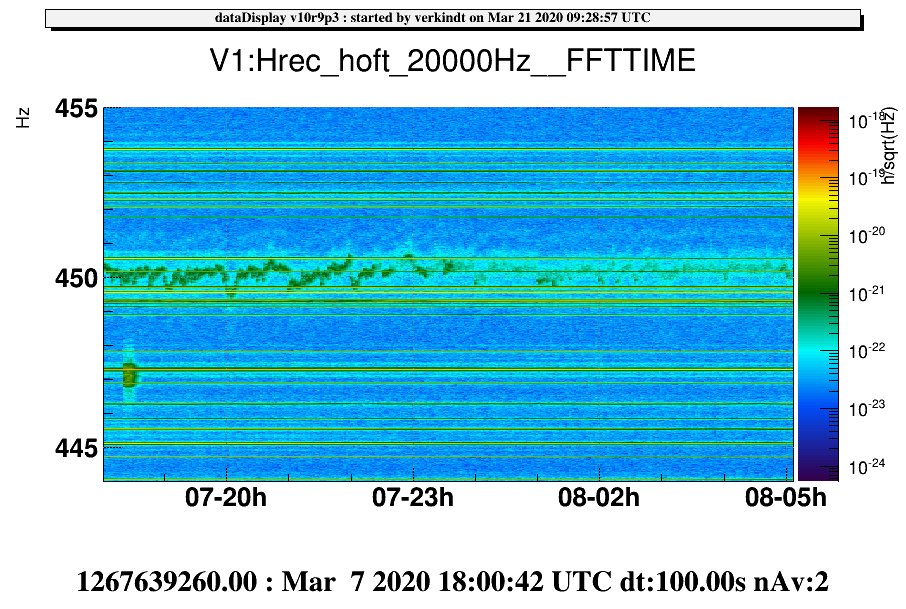
There are many lines between 440-455 Hz. Some of them are possibly unidentified Violin modes.

Investigation is continuing, but here already a summary of all lines.

Notes: - a few lines are not detected by NoEMi.

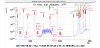
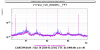
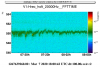
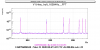
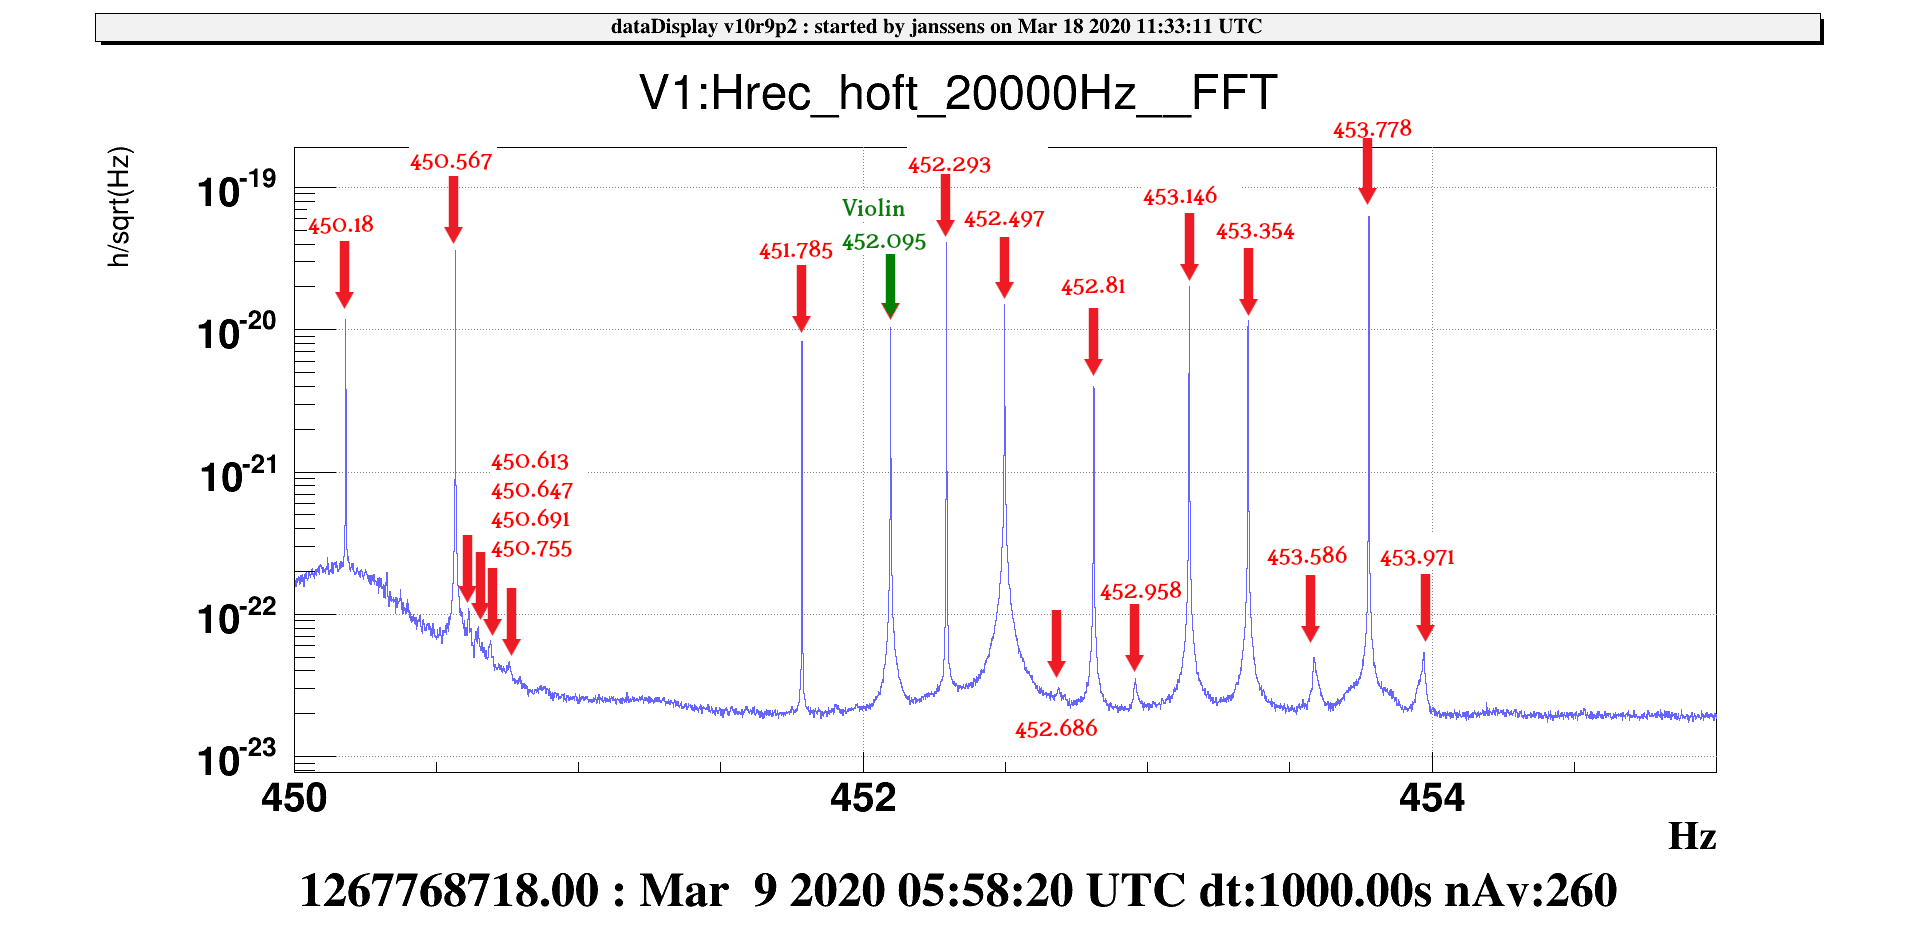
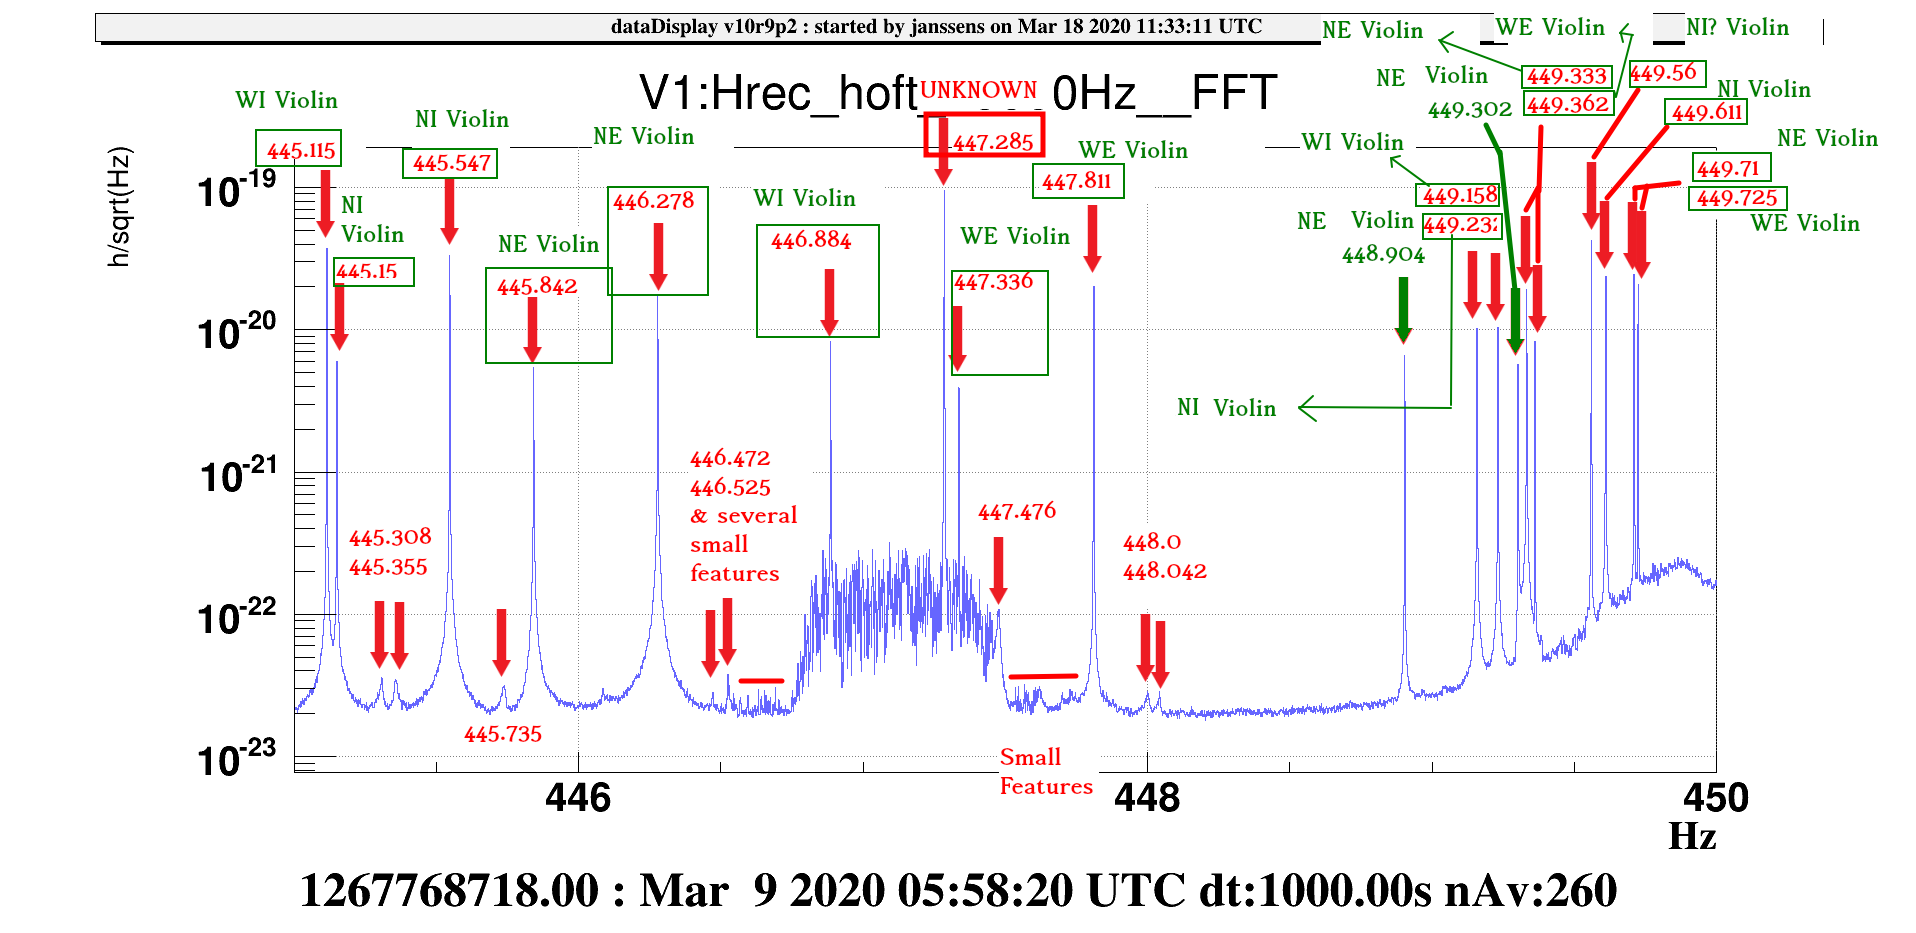
           - Often NoEMi groups together several lines and identifies them as 1 line. A good example are the lines 449.56Hz, 449.611Hz, 449.71Hz and 449.725Hz, which in NoEMi only has 1 line with frequency range from 449.530-450.130 with peak value at 450.124.

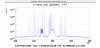
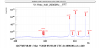
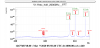
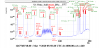
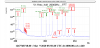
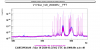
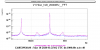
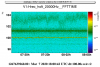
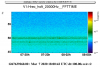
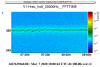
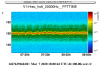
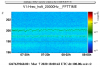
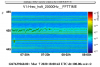
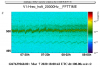
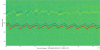
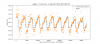
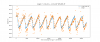
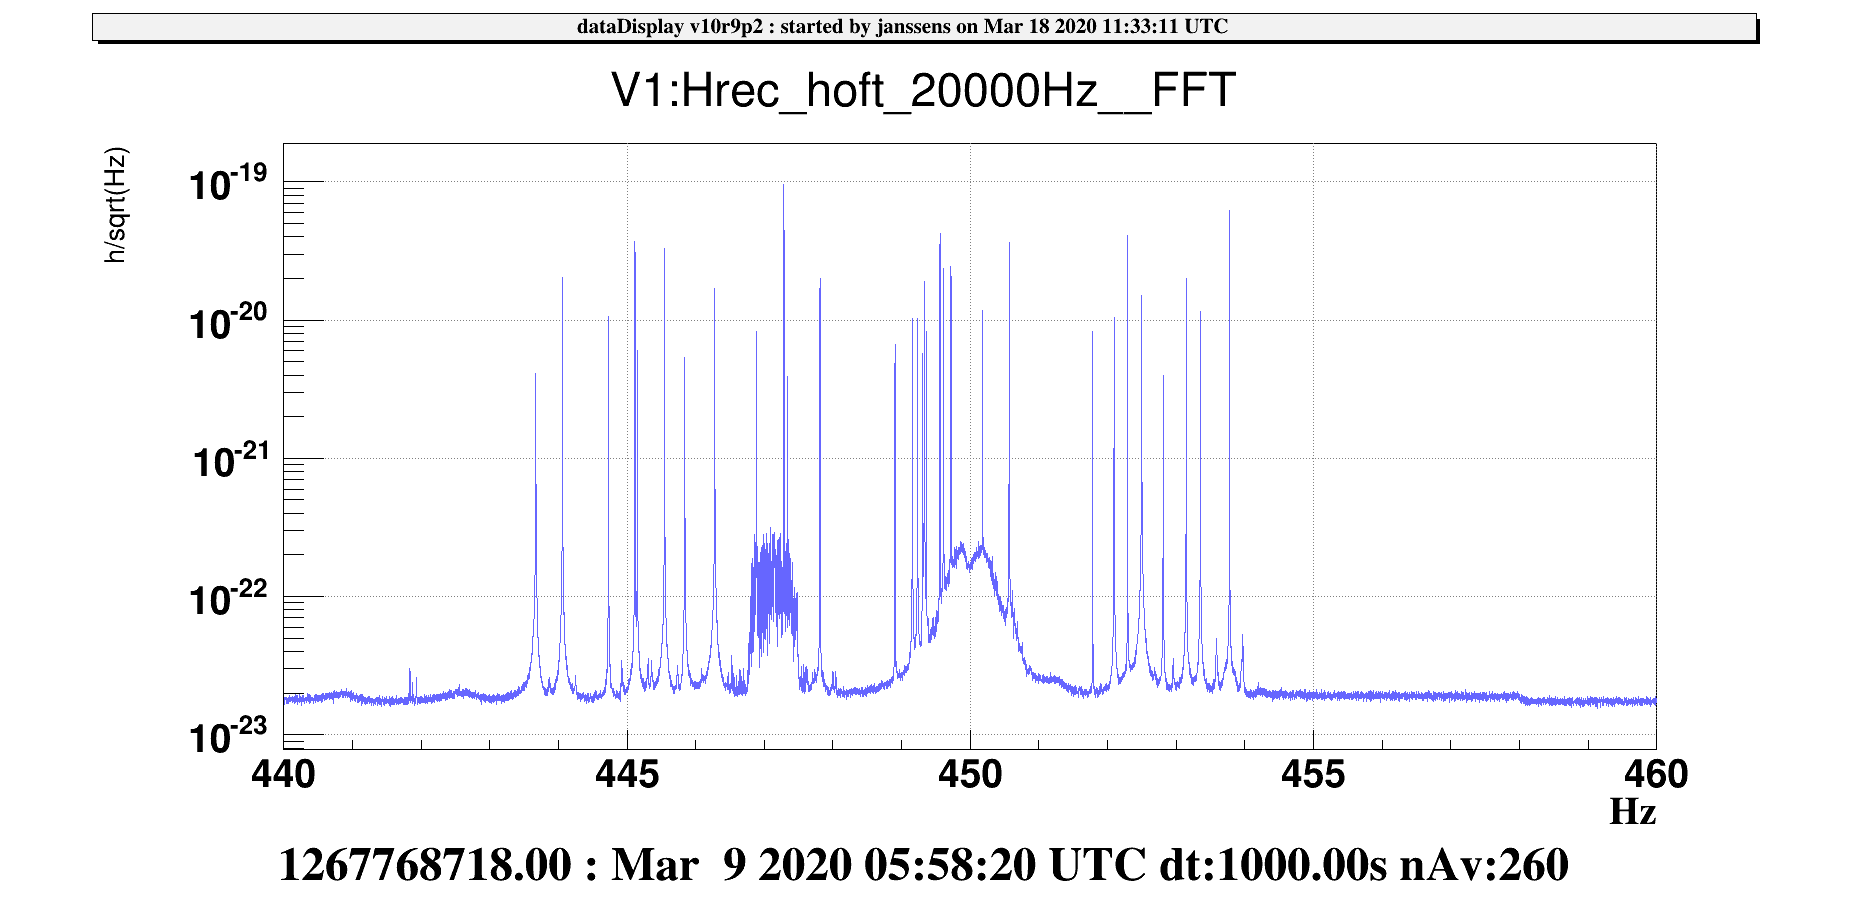
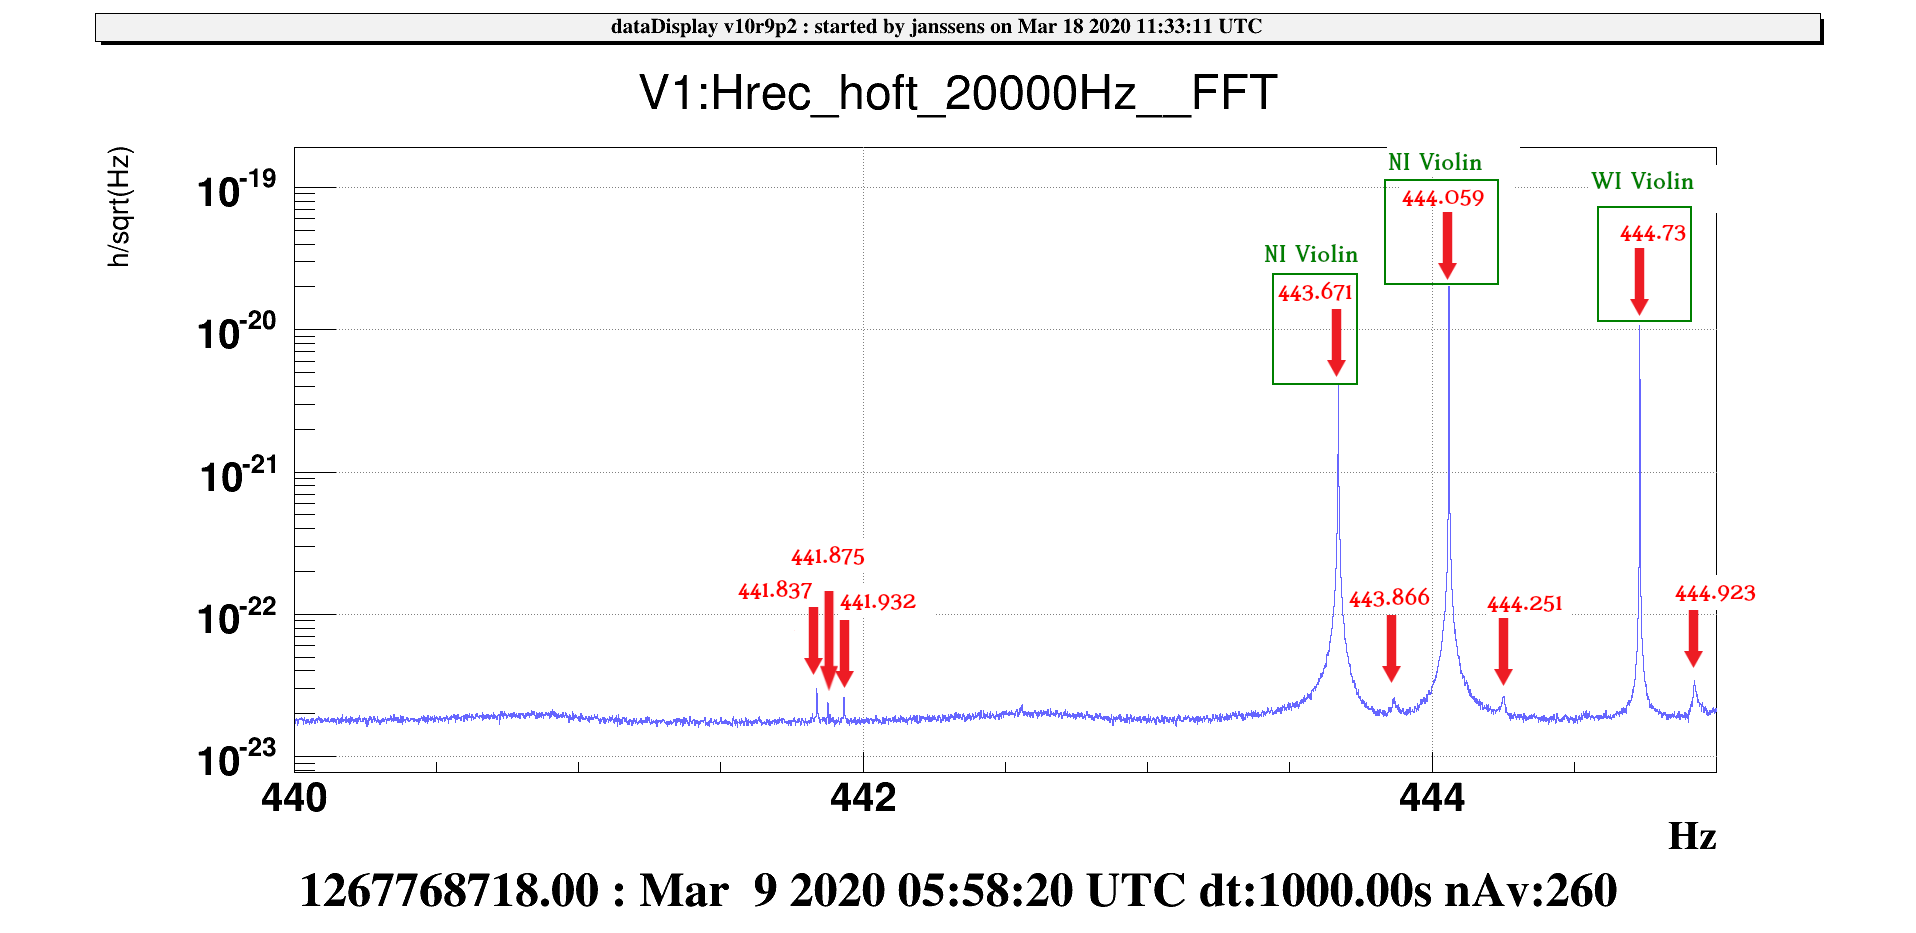
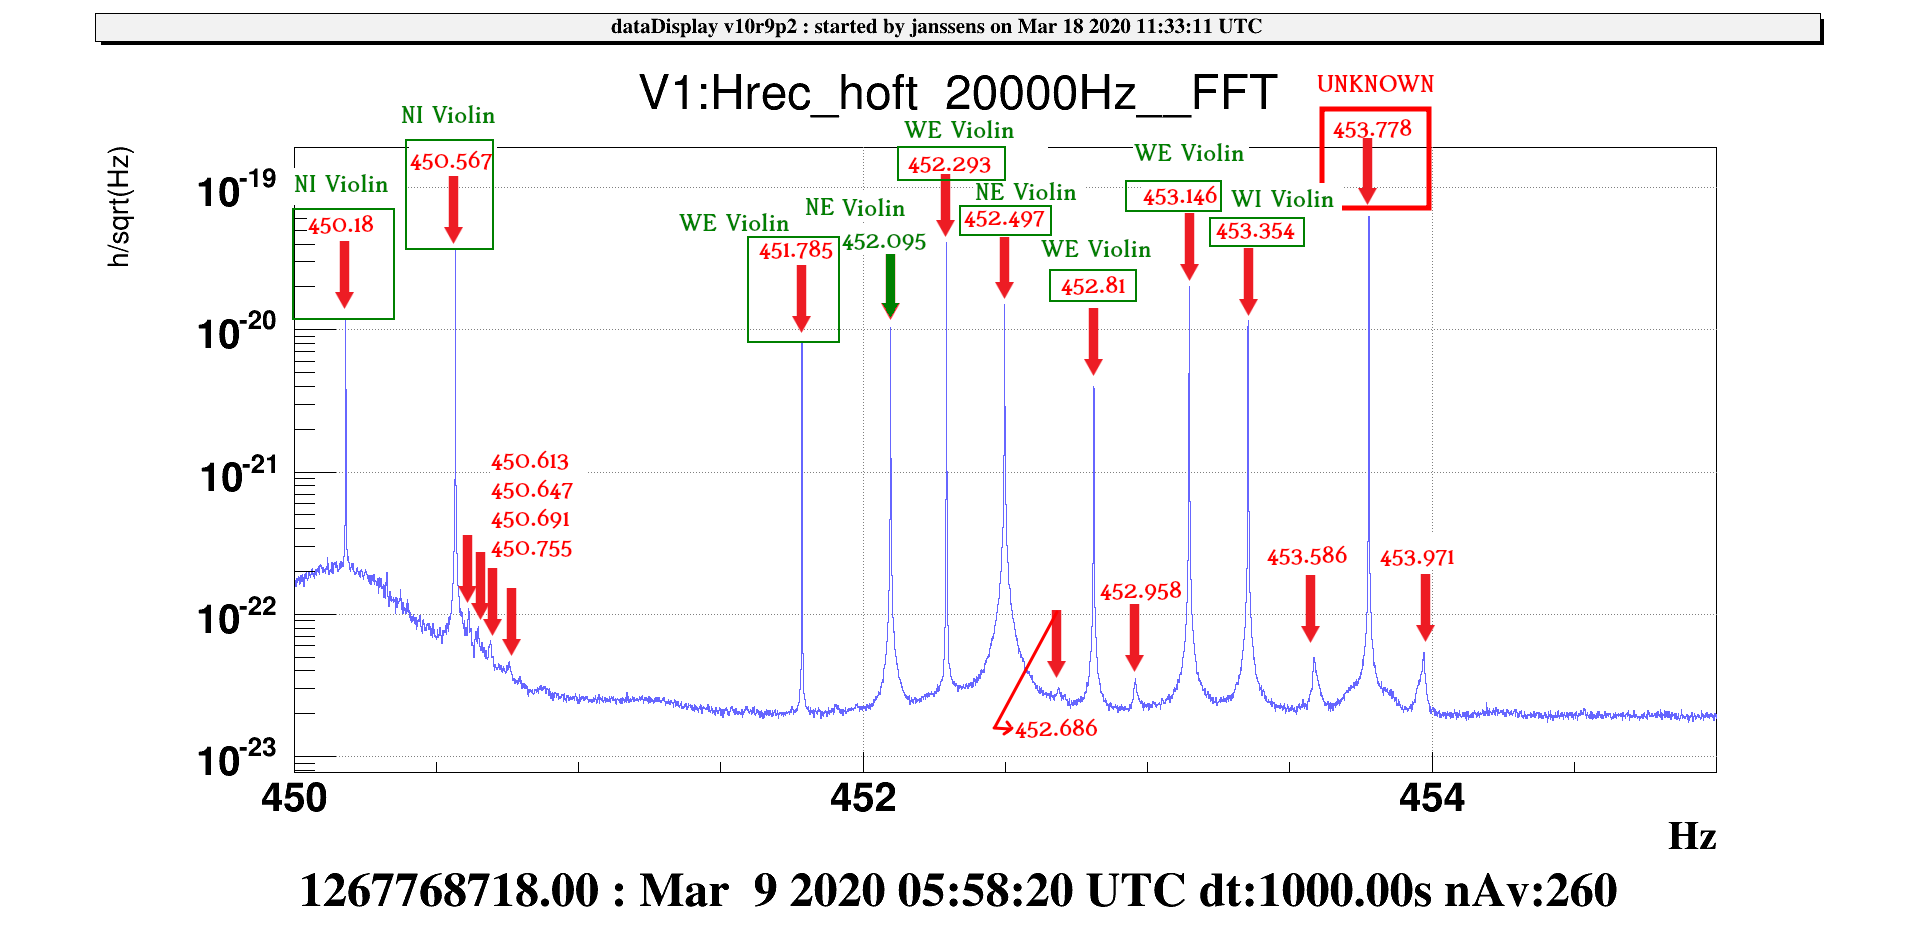
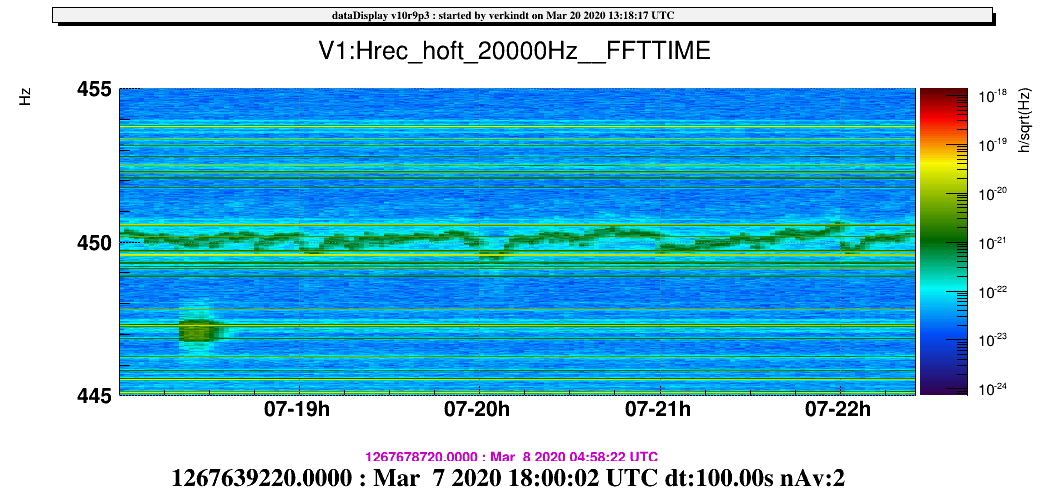
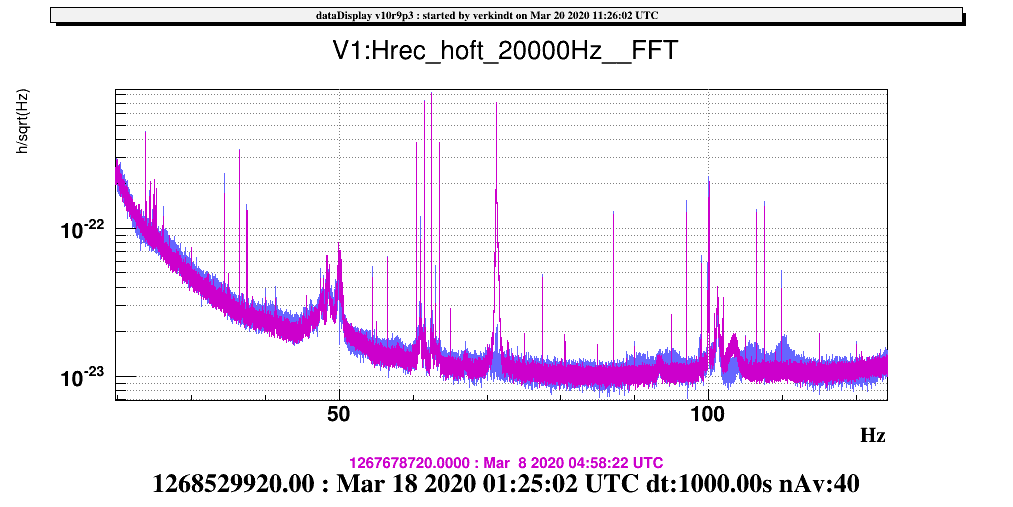
Included figures are an overview of the range 440-460Hz (Fig 1) and details of the regions 440-445 Hz (Fig 2), 445-450 Hz (Fig 3) and 450-455 Hz (Fig 4). No detail of 455-460 Hz is given due to no lines present.

In the (almost) all lines and features are labeled with there frequency, apart from maybe some very small lines or features.

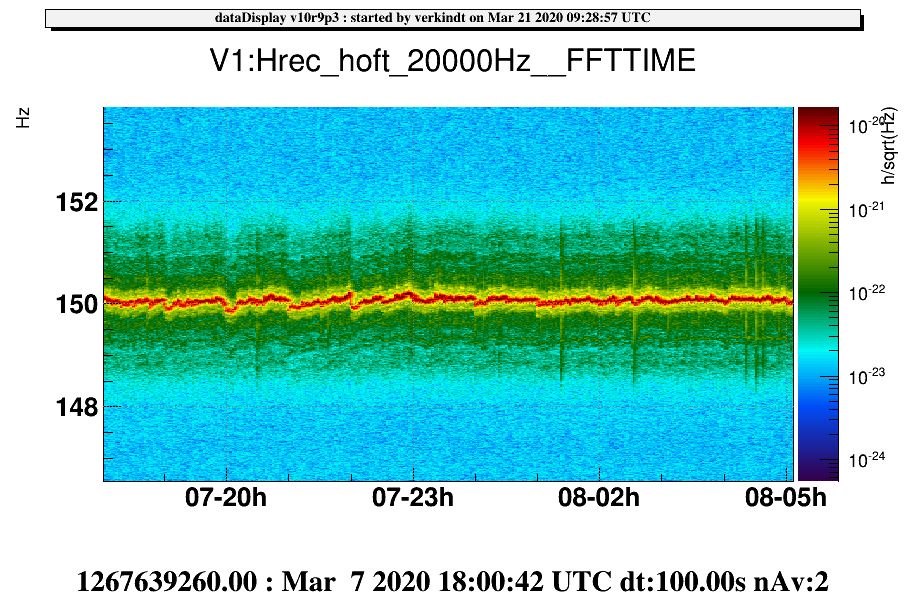
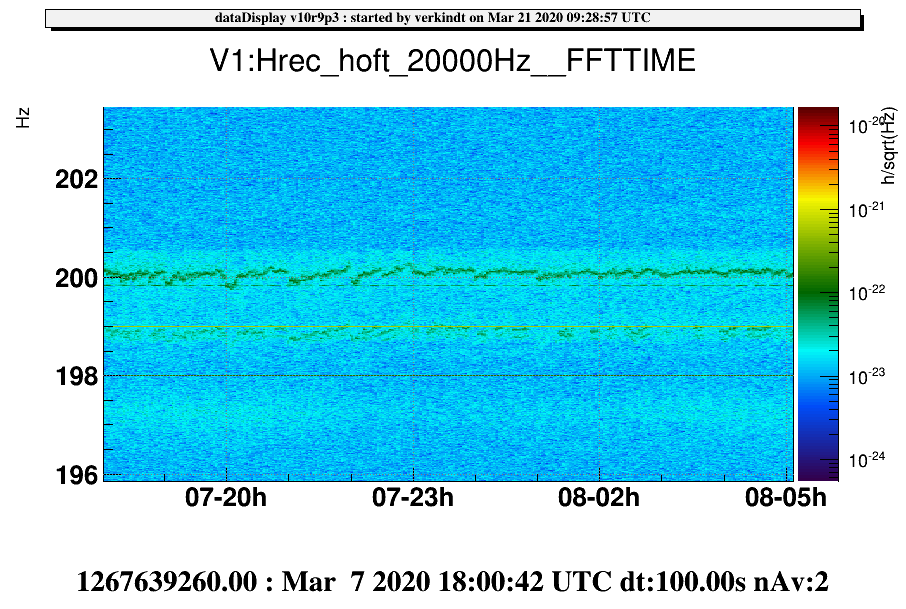
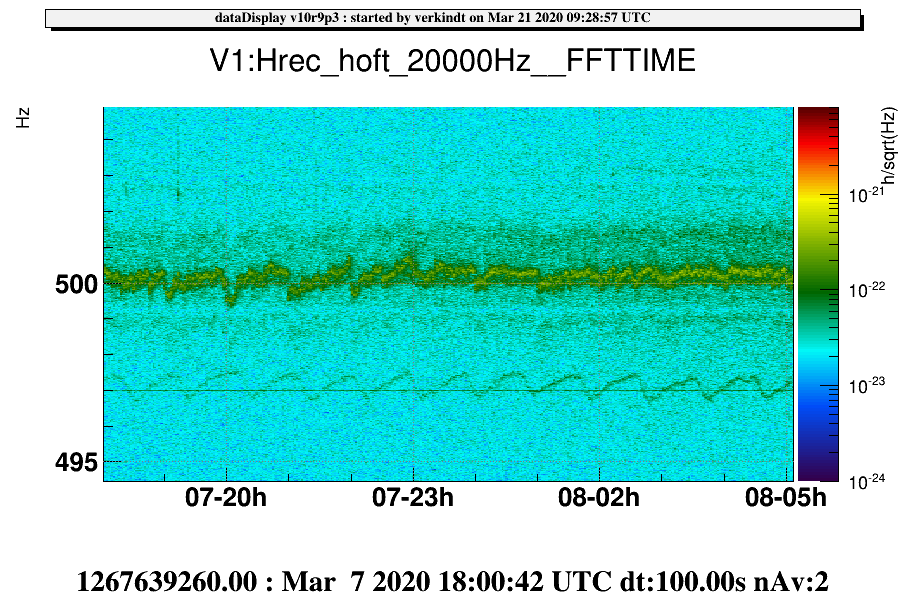
All figures have a 1mHz resolution and are taken over 36 hours of data starting on 7/03/2020 18:00:00 UTC


Images attached to this report
Comments to this report:
janssens - 17:16 Thursday 19 March 2020 (48750) Print this report

In the past many of the Violin modes were identified. See comments to logbook entry https://logbook.virgo-gw.eu/virgo/?r=41775 (Thanks to Bas to point it out).

Apart from 2 all major lines are identified in this previous investigation.

After checking they are reported in the LineDB, but not linked to NoEMi (where I was checking).

Here are the updated figures containing the identifications.

Images attached to this comment
verkindt - 15:12 Friday 20 March 2020 (48757) Print this report

The two bumps visible within the violin modes lines forest are non-stationary bumps. Plot 1 is a spectrogram
which shows that the 450 Hz bump is a non-stationary line while the 447 Hz bump is an intermittent noise.

In addition, I made plot 2 which shows the changes in this frequency region between the quiet period (low glitchiness, good BNS range)
in the night of March 7 - March 8 and an equivalent period in the night of March 17 - March 18.
Plots 3,4 and 5 are a zoom of plot 2, where are clearly visible the changes around 445 Hz , 434 Hz and 453 Hz (where is an unknown line, not referenced as violin mode)
We see that around 434 Hz a line is present on Mar 18 but not on March 8.
We see that around 453 Hz, the small lines are absent on March 18 but present on March 8.

To add some information: plot 5 shows also the changes in the frequency range 20-120 Hz, where we can see disappearance of a peak around 71 Hz
and the non-stationarity of the bumps around 103 Hz and 110 Hz.
Plot 6 show the changes around the calibration lines, where we see the presence of beating peaks around 61 Hz and 62.5 Hz on March 18.

Images attached to this comment
verkindt - 11:48 Saturday 21 March 2020 (48766) Print this report

The following plots shows spectrograms with 0.01 Hz resolution showing the structure of the 50 Hz harmonics wandering lines in h(t).
We can observe a decrease of the amplitude of the 450 Hz line around March 8 00:00 UTC. This decrease is not visible for the other 50 Hz harmonics
We can observe also a periodicity of 1 hour of the lines wandering. This periodicity is visible for all the 50 Hz harmonics.

Images attached to this comment
swinkels - 14:06 Saturday 21 March 2020 (48767) Print this report
Didier's plot of the 500 Hz line shows another wandering line at 497 Hz, which was seen earlier by Irene. Tracing the line and doing a brute-force correlation of its frequency shows a decent (but not perfect) correlation with some signals related to the temperature of the detection electronic room (DER), see attached images and the list of winning channels. The line might be caused by the air-conditioning itself, or by some piece of electronics located in this room, which is modulated by temperature.
Images attached to this comment
Non-image files attached to this comment
verkindt - 17:41 Saturday 21 March 2020 (48770) Print this report

While comparing spectra in an unglitchy period (March 20 12:00 to 18:00 UTC) to a glitchy one (March 20 21:00 to 23:59 UTC), I have seen that the two lines
marked UNKNOWN by Kamiel wen he looked at the violin modes around 450 Hz in elog 48750
have no harmonics around 900 Hz and are thus for sure not forgotten and unlisted violin modes.
Their origin is elsewhere.
The two unkown lines are: 447.285 Hz and 453.778 Hz
Plots 1 and 2 show the absence of lines at the expected harmonic frequencies 894.57 Hz and 907.56 Hz

Images attached to this comment
mwas - 10:47 Sunday 22 March 2020 (48775) Print this report

Harmonics of the violin mode are not exact multiples of the first mode frequency. So one cannot just take the frequency of a line at multiply it by 2 to look for the second harmanic. For example the 3 lines between 896.2Hz and 896.6Hz, do not have corresponding lines between 448.1Hz and 448.3Hz (there is no significant line between 448Hz and 448.5Hz in Kamiel's plot).

I do not know what is the relation between the 1st and 2nd harmonic of violin mode, there might be an impact of gravity across the fiber (the top part of the fiber has a higher tension than the bottom, because of the weight of the fiber) and/or of the not infinitely small size of the bending points of the fiber near the anchors.

coulon - 15:30 Sunday 22 March 2020 (48778) Print this report
If a string behaves a bit like a rod its "harmonics" are not exactly multiples of the fundamental frequency. They are then called "partials" of "overtones".
Search Help
×

Warning

×