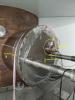
This morning we performed some tapping tests and noise injections on the east flange of the IB tower, where the beam dump to dump the light coming from the IPC2 on SIB1 is located (it was not installed on the suspended bench because it is water cooled).
Here a list of the performed tests:
| type of noise | parameters | where | GPS start | GPS end | observations |
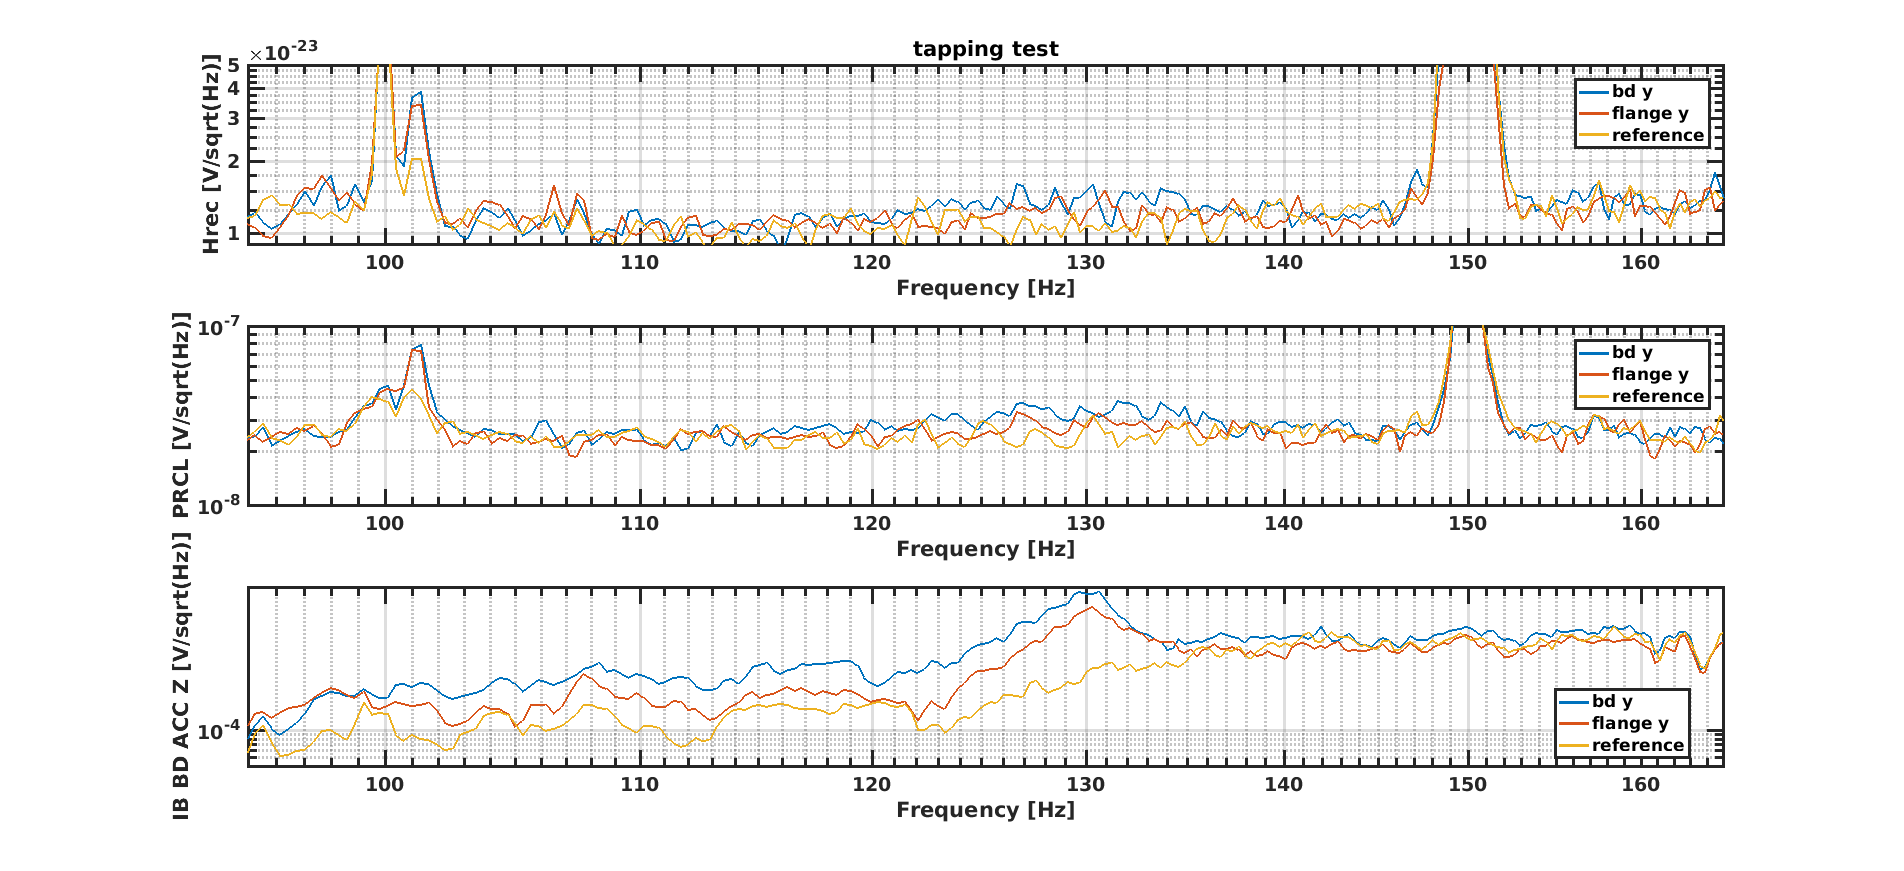
| tapping | alog Y (vertical) direction | beam dump | 1266915123 | 1266915165 | |
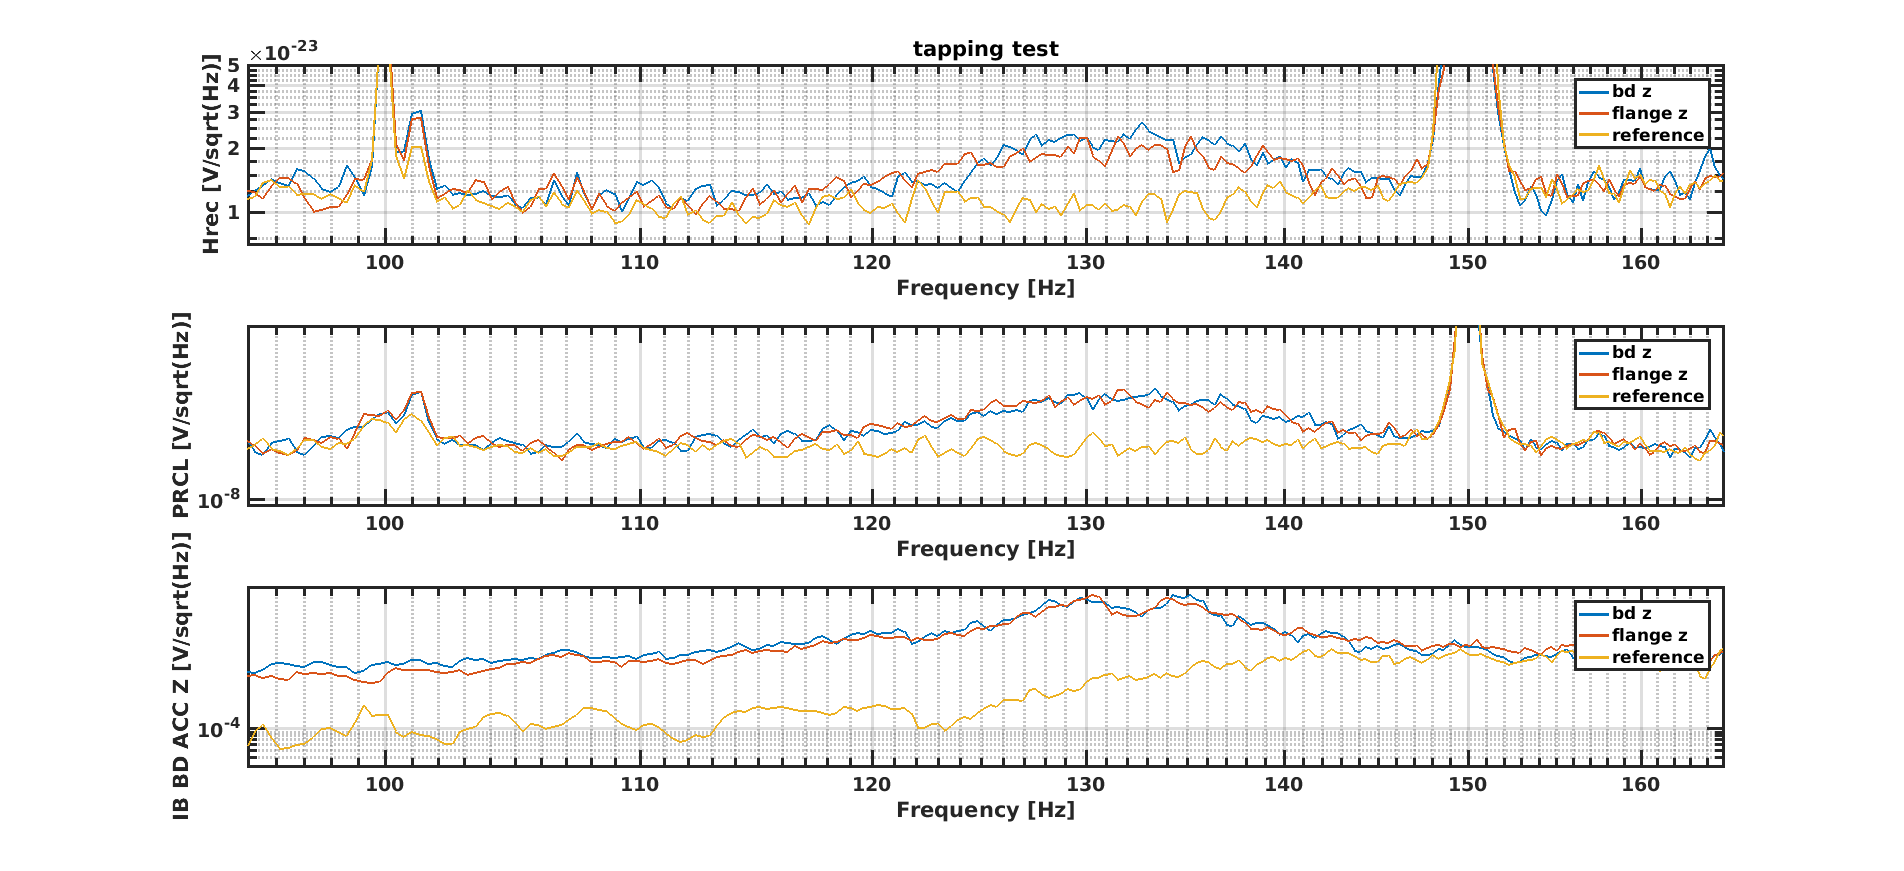
| tapping | along z (beam) direction | beam dump | 1266915312 | unlock (PRCL oscillation?) | |
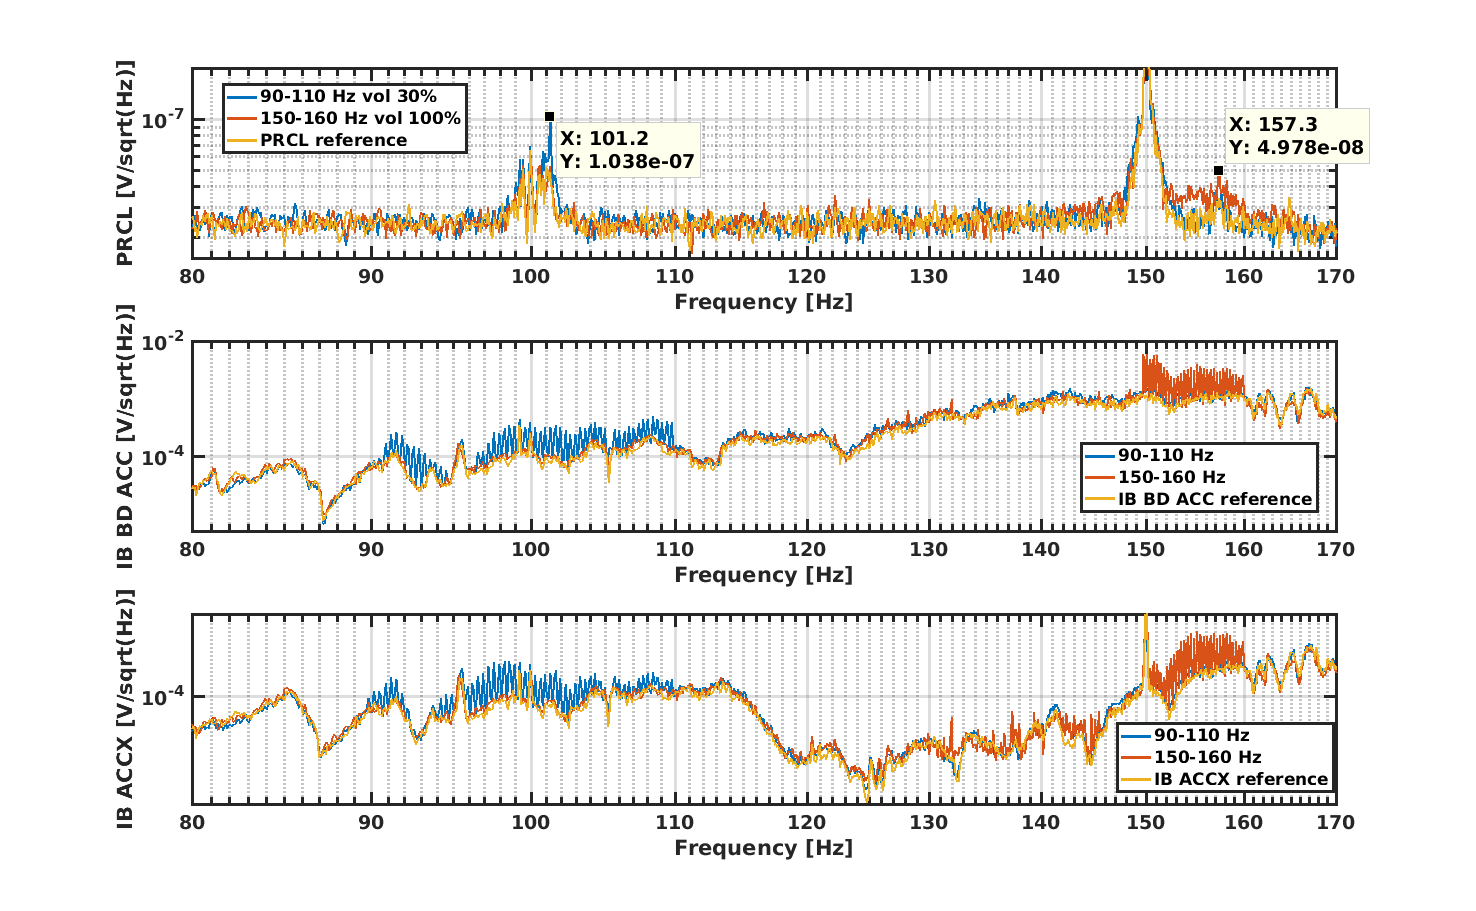
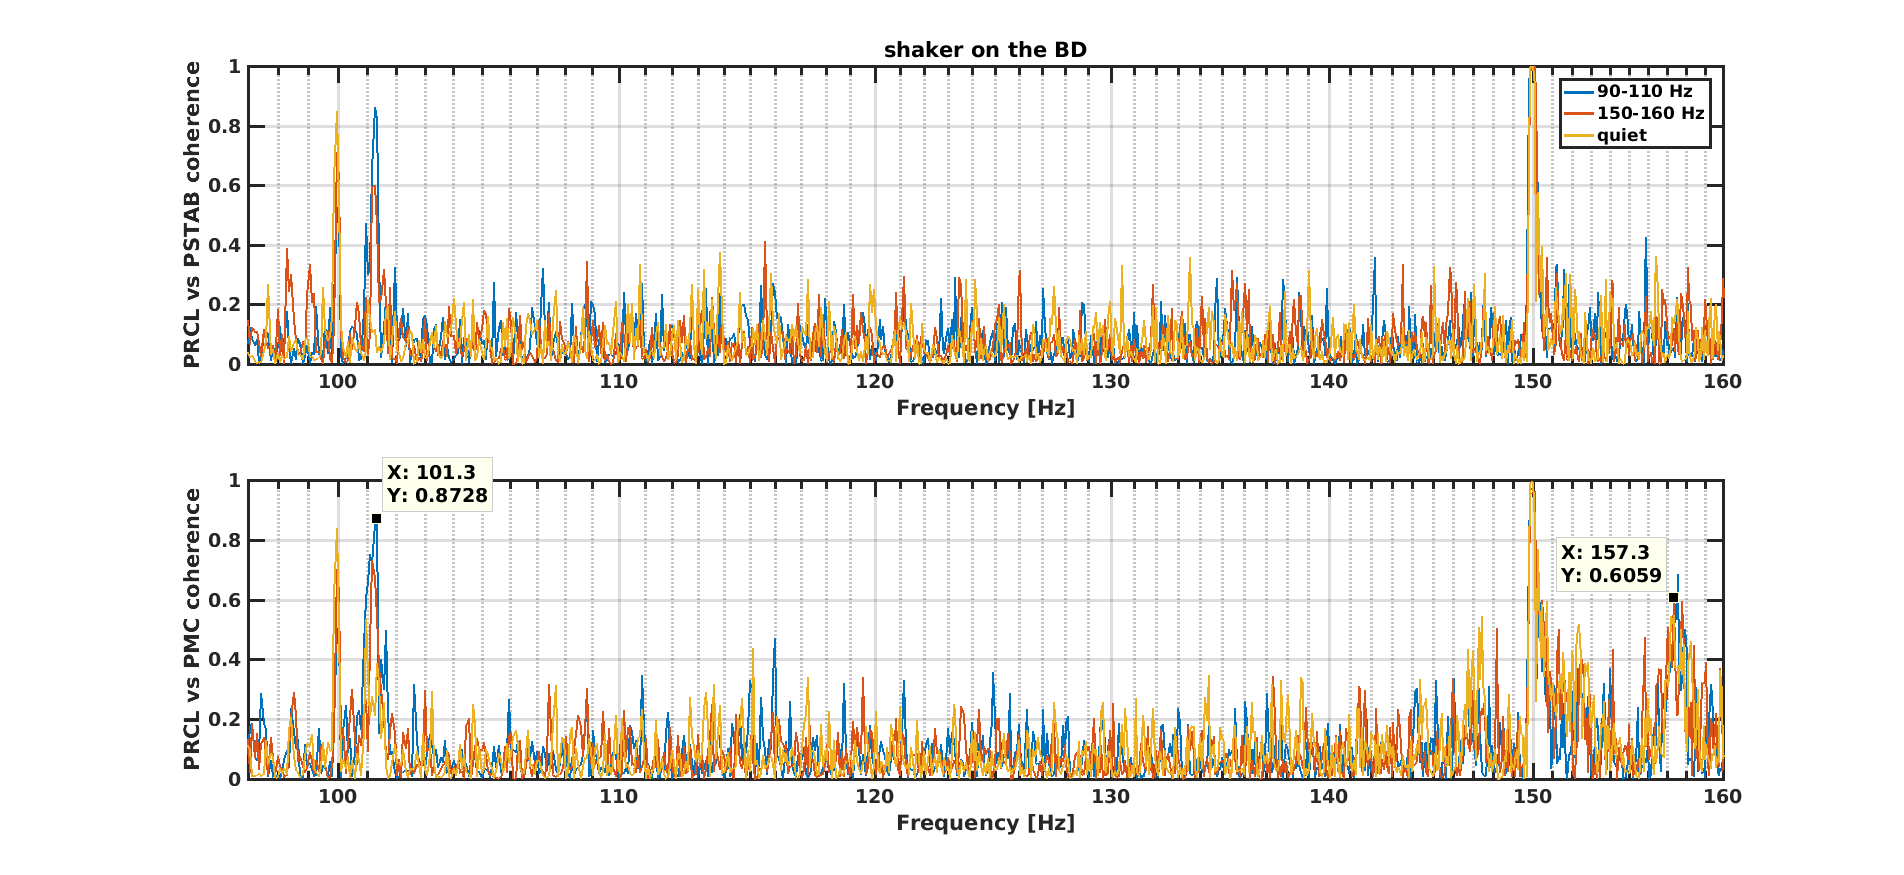
| shaker - noise generator app: brown noise 90-110 Hz | volume = 20% | beam dump flange | 1266916656 | 1266916762 | |
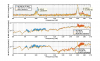
| - | volume = 30% | - | 1266916762 | 1266916996 | see x2 in BD ACC, and Hrec 101Hz peak goes up x3 about |
| 150-170 Hz | volume = 20% | - | 1266917056 | 1266917170 | |
| - | volume = 40% | - | 1266917170 | 1266917302 | |
| - | volume = 60% | - | 1266917302 | 1266917379 | see 163Hz in Hrec |
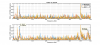
| - | volume = 80% | - | 1266917379 | 1266917561 | nice: see seismic noise in SIB2_Z and little on IB_BS_ACC_Z |
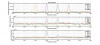
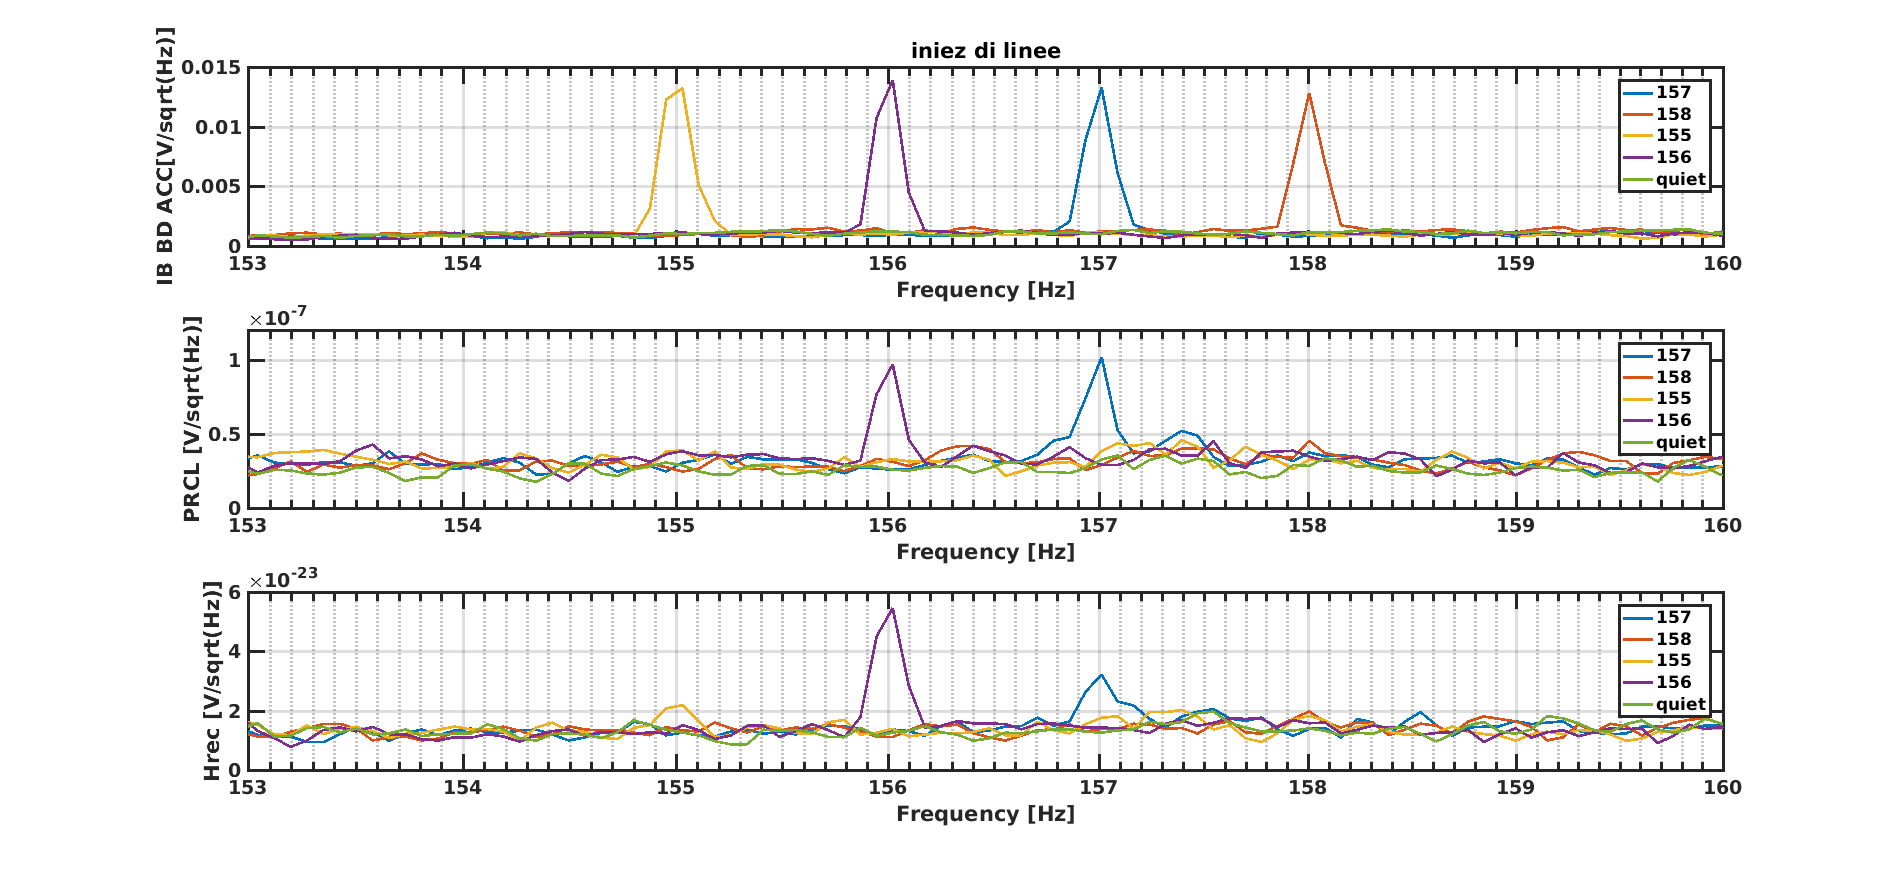
| sine at 157 Hz | 1266917778 | 1266917882 | see line in accelerometers, but not in Hrec | ||
| increased (about half of volume range) | 1266917882 | 1266918006 | no see little in Hrec (SNR 2) while accelerometers see SNR x5 (BD) and x20 (SIB2) | ||
| increased to 3/4 of full range | 1266918006 | 1266918149 | |||
| sine at 158 Hz | same volume | 1266918165 | 1266918284 | ||
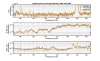
| sine at 156 Hz | same volume | 1266918316 | 2 min duration | see nice in Hrec: SNR of 4? | |
| sine at 155 Hz | same volume | 1266918470 | 1266918580 | little in Hrec (x2?) | |
| brown noise 150-160 Hz | max volume 100% | 1266918627 | 1266918965 | see x3 in DB acc, x10 in SIB2 acc, and something in Hrec... | |
| brown noise 90-110 Hz | max volume 100% | 1266919101 | we unlocked | ||
| tapping | z direction | flange | 1266921506 | 1266921580 | |
| - | z direction | beam dump | 1266921622 | 1266921680 | |
| - | x direction | flange | 1266921846 | 1266921927 | |
| - | x direction | BD | 1266921984 | 1266922057 | |
| y | flange | 1266922154 | 1266922234 | ||
| y | BD | 1266922306 | 1266922377 | ||
| brown 40-60 Hz | 50% | 1266922877 | 1266923057 | see in BD ACC, but not in Hrec | |
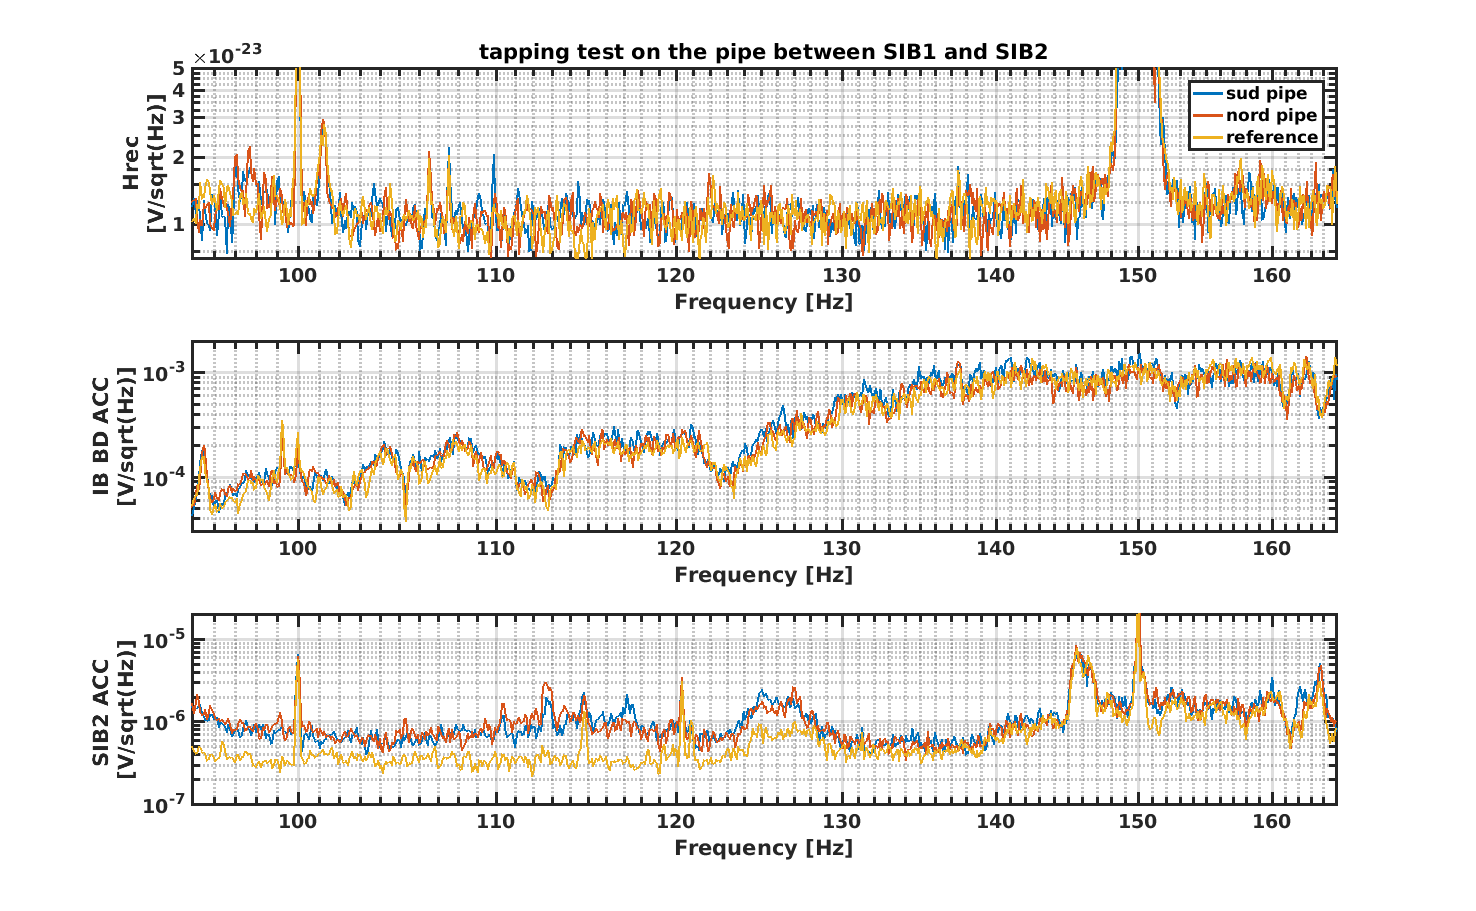
| tapping | sud pipe between IB tower and SIB2 | middle | 1266923353 | 1266923415 | no effect in Hrec |
| - | nord | - | 1266923440 | 1266923499 | no effect in Hrec |
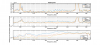
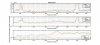
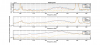
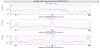
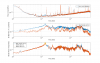
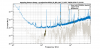
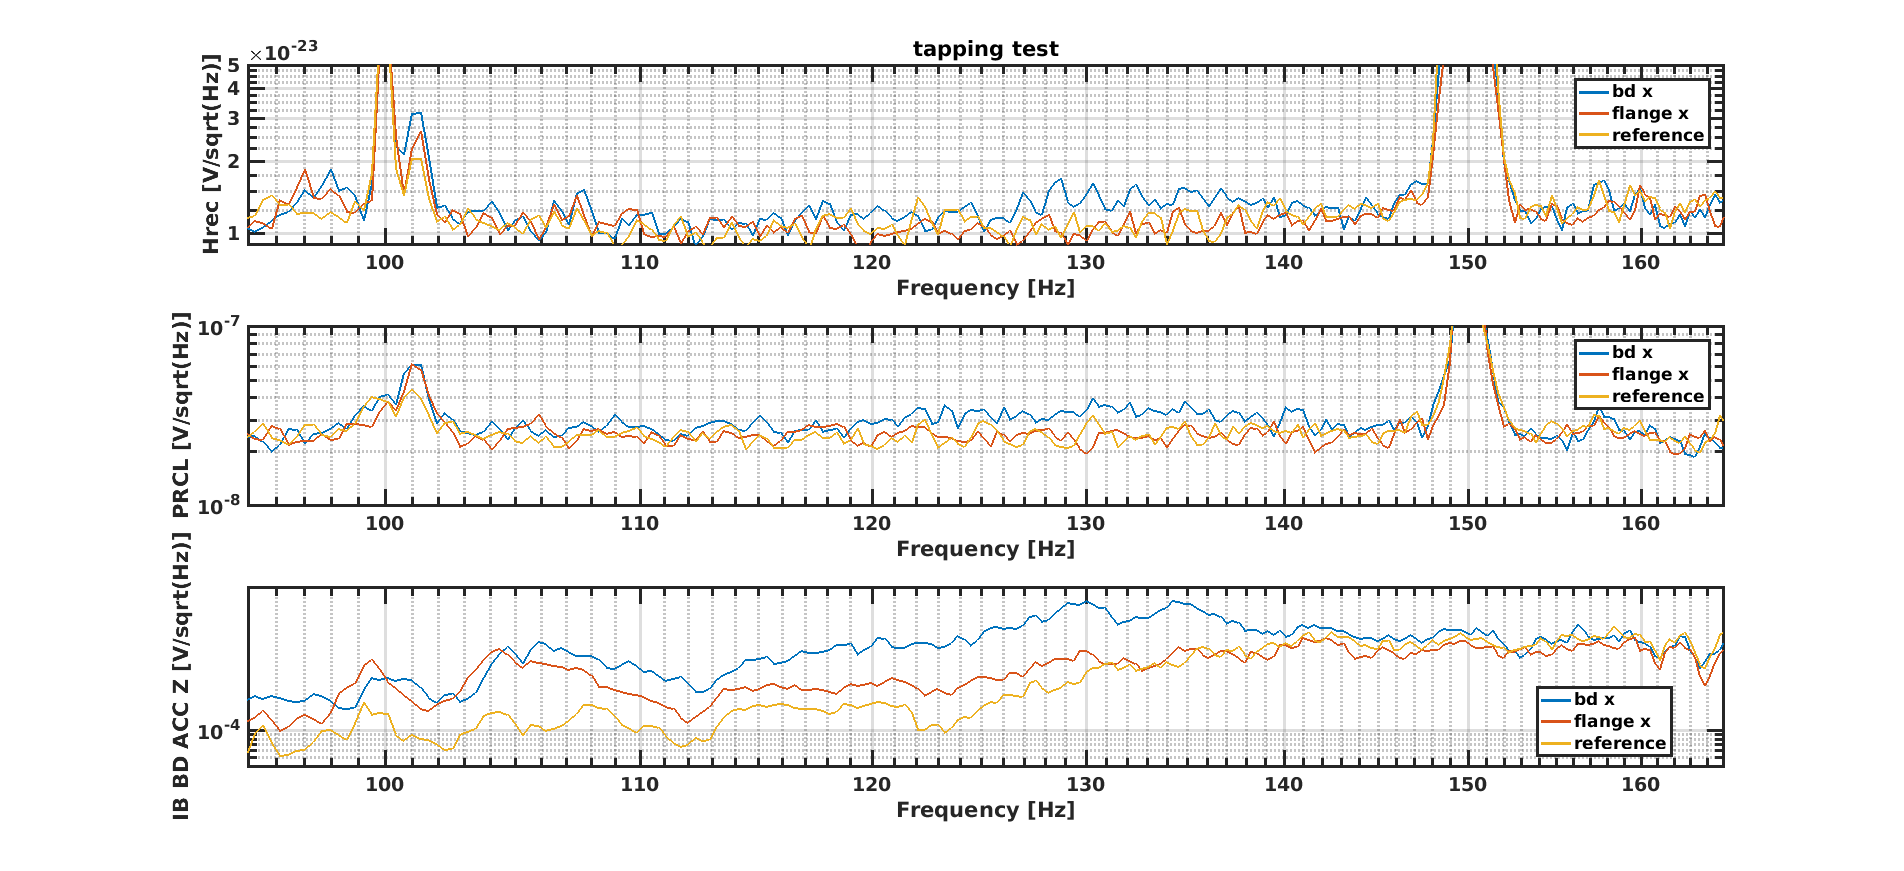
We will post more details and the analysis as soon as possible, but for the moment what we observed is that:
- it is difficult to state where it is the origin of the peaks because when we do tapping we excite both the flange and the beam dump
- the 101 Hz seems to be more sensitive to the noise injection (we unlocked when we put the same kind of noise than around 157 Hz)
- when we tapped on the pipes we did't see anything, but maybe we should have tapped also on both sides of the bellows