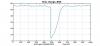
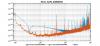
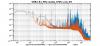
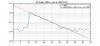
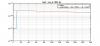
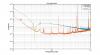
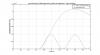
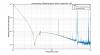
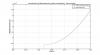
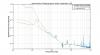
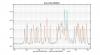
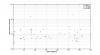
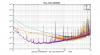
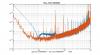
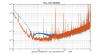
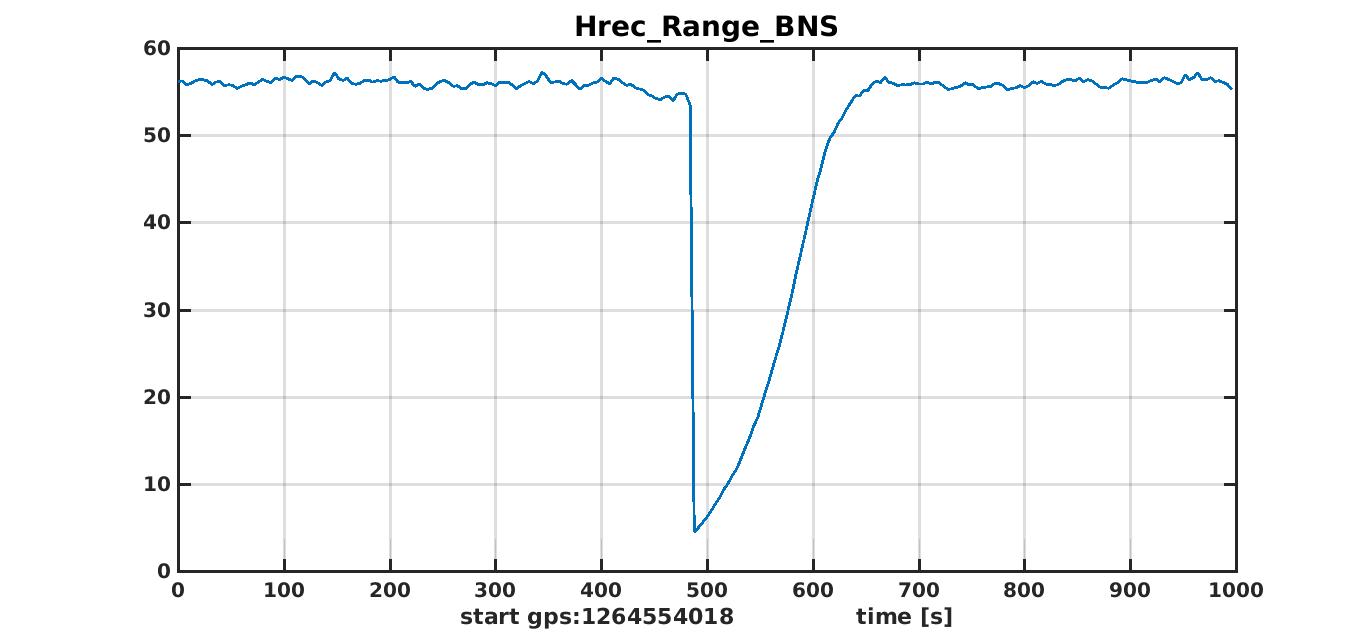
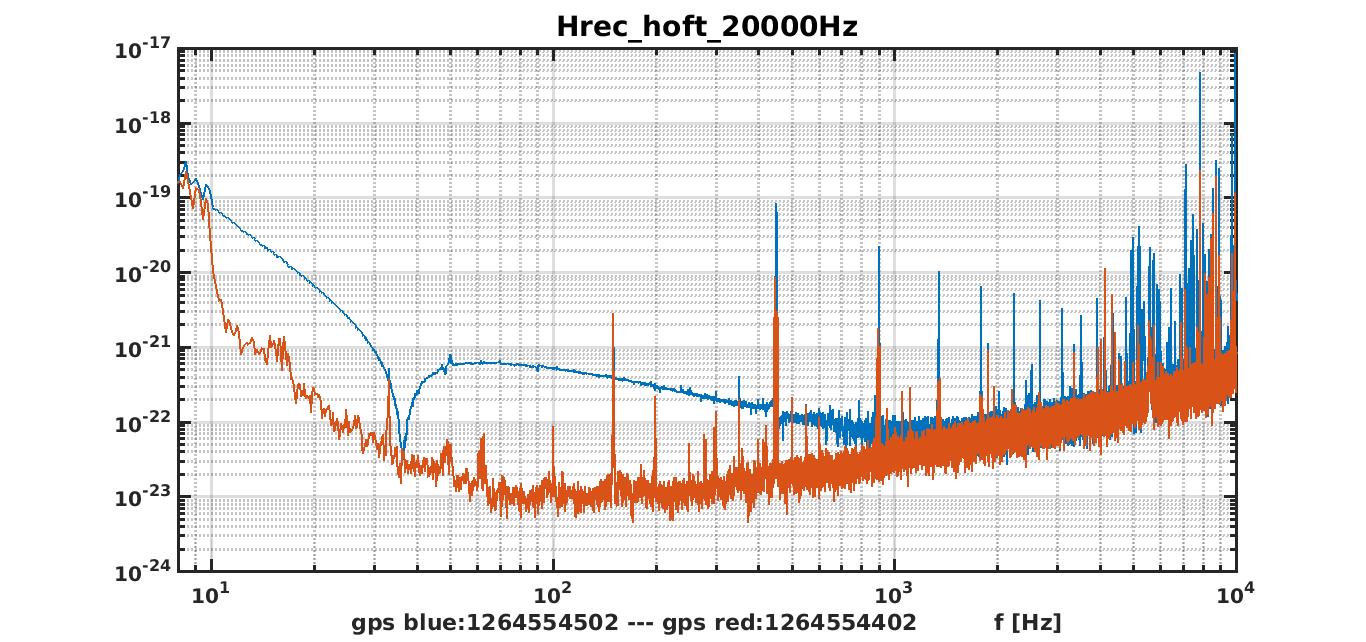
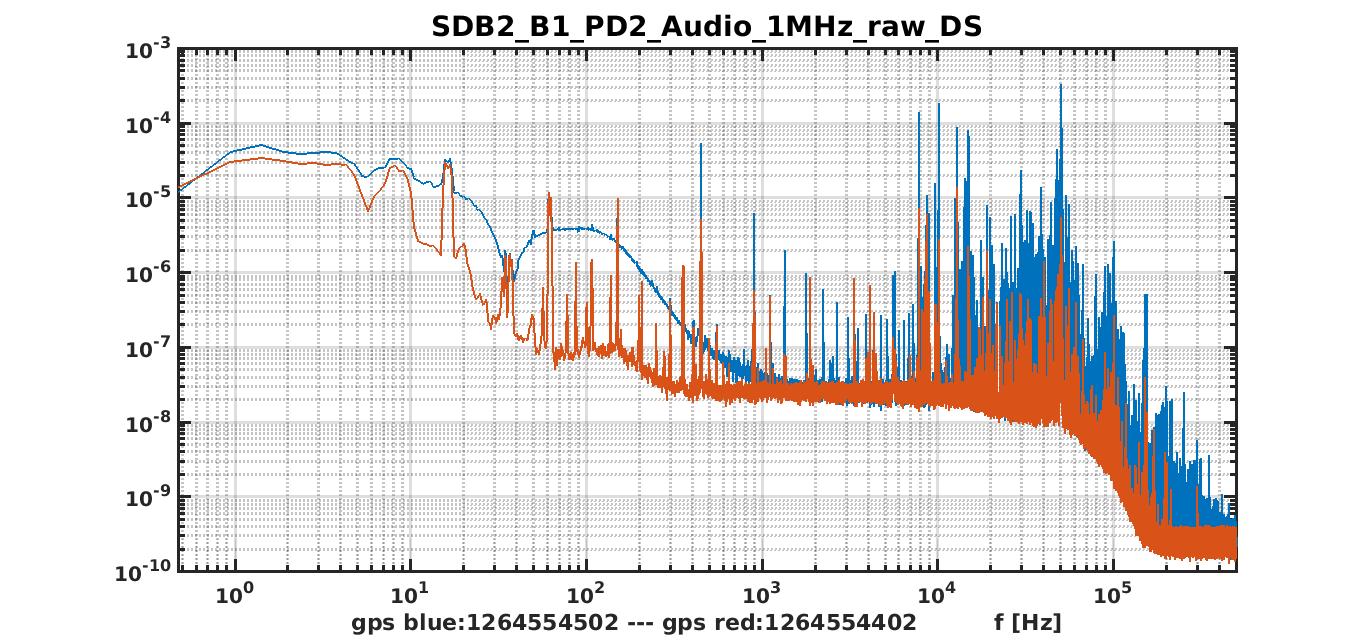
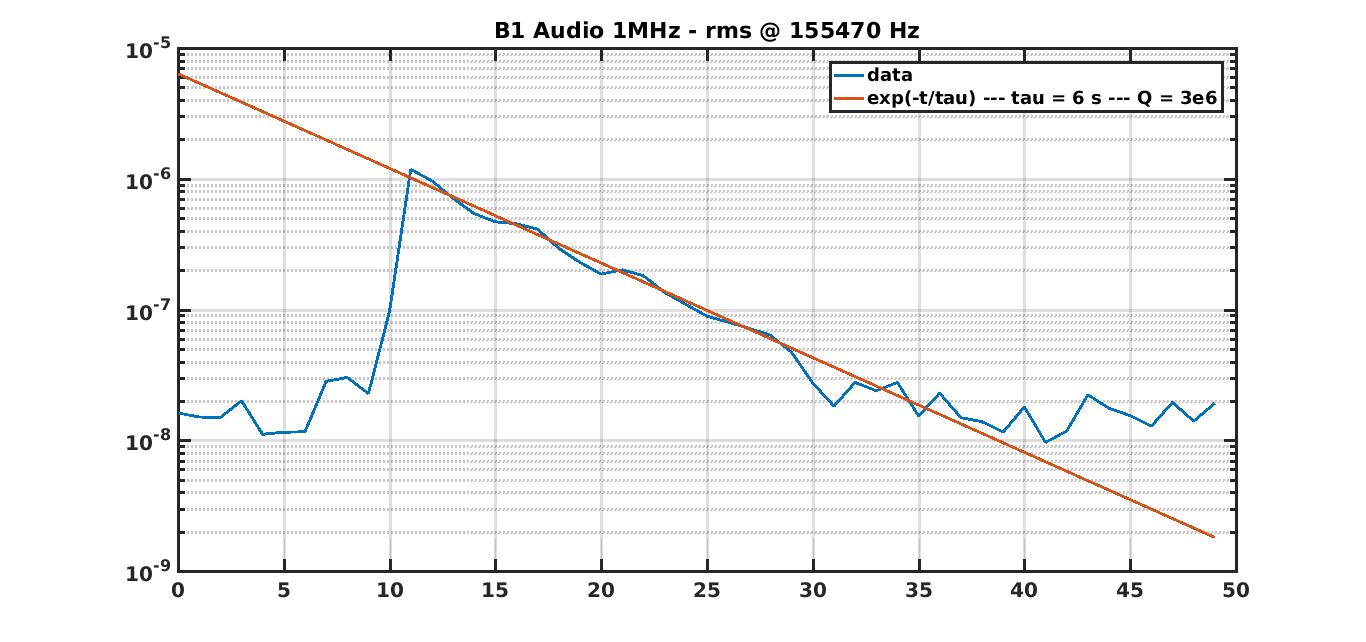
The glitch at gps=1264554506 (fig 1) was due to the excitation of a test mass. All the modes, violins and bulk, got excited, and a very nice profile appeared in hrec (fig 2). For people interested in high frequency mode classification, the event is perfect (fig 3 - may be the high samplig data have to be saved soon). For example, it is possible to identify a mode at 155470 Hz with Q = 3e6 (fig 4).
Raw_full data archiving has been requested during the weekend by the PI group. Archival is in progress this morning.
As the previous time, there is some holes on the raw_full stream during raw_full data archiving period
2020-02-03-10h20m32-UTC>ERROR..-GPS> File /data/rawdata/rawfull//V-rawfull-1264759960-40.gwf, since 1264760020 miss 60 frames
2020-02-03-10h20m49-UTC>ERROR..-GPS> File /data/rawdata/rawfull//V-rawfull-1264760060-20.gwf, since 1264760100 miss 20 frames
2020-02-03-10h24m02-UTC>ERROR..-GPS> File /data/rawdata/rawfull//V-rawfull-1264760160-20.gwf, since 1264760200 miss 20 frames
2020-02-03-10h24m51-UTC>ERROR..-GPS> File /data/rawdata/rawfull//V-rawfull-1264760200-20.gwf, since 1264760240 miss 100 frames
2020-02-03-10h25m07-UTC>ERROR..-GPS> File /data/rawdata/rawfull//V-rawfull-1264760320-40.gwf, since 1264760380 miss 20 frames
2020-02-03-10h28m20-UTC>ERROR..-GPS> File /data/rawdata/rawfull//V-rawfull-1264760440-40.gwf, since 1264760500 miss 100 frames
2020-02-03-10h29m28-UTC>ERROR..-GPS> File /data/rawdata/rawfull//V-rawfull-1264760600-20.gwf, since 1264760640 miss 20 frames
2020-02-03-10h32m24-UTC>ERROR..-GPS> File /data/rawdata/rawfull//V-rawfull-1264760680-40.gwf, since 1264760740 miss 20 frames
2020-02-03-10h32m41-UTC>ERROR..-GPS> File /data/rawdata/rawfull//V-rawfull-1264760740-20.gwf, since 1264760780 miss 40 frames
2020-02-03-10h33m29-UTC>ERROR..-GPS> File /data/rawdata/rawfull//V-rawfull-1264760800-20.gwf, since 1264760840 miss 20 frames
2020-02-03-10h34m04-UTC>ERROR..-GPS> File /data/rawdata/rawfull//V-rawfull-1264760840-40.gwf, since 1264760900 miss 20 frames
2020-02-03-10h35m24-UTC>ERROR..-GPS> File /data/rawdata/rawfull//V-rawfull-1264760960-20.gwf, since 1264761000 miss 80 frames
2020-02-03-10h37m32-UTC>ERROR..-GPS> File /data/rawdata/rawfull//V-rawfull-1264761060-20.gwf, since 1264761100 miss 40 frames
2020-02-03-10h39m24-UTC>ERROR..-GPS> File /data/rawdata/rawfull//V-rawfull-1264761200-40.gwf, since 1264761260 miss 20 frames
2020-02-03-10h41m00-UTC>ERROR..-GPS> File /data/rawdata/rawfull//V-rawfull-1264761320-20.gwf, since 1264761360 miss 60 frames
2020-02-03-10h41m32-UTC>ERROR..-GPS> File /data/rawdata/rawfull//V-rawfull-1264761400-40.gwf, since 1264761460 miss 20 frames
2020-02-03-10h41m48-UTC>ERROR..-GPS> File /data/rawdata/rawfull//V-rawfull-1264761460-20.gwf, since 1264761500 miss 20 frames
About the fit to the data picture 4, even if the background seems very small, the formula to be fitted is likely a*exp(-t/tau)+b, and then the result for tau is around 5.3 s instead of 6.
With the formula Q=w0*tau/2, the result is Q=2.6E6.
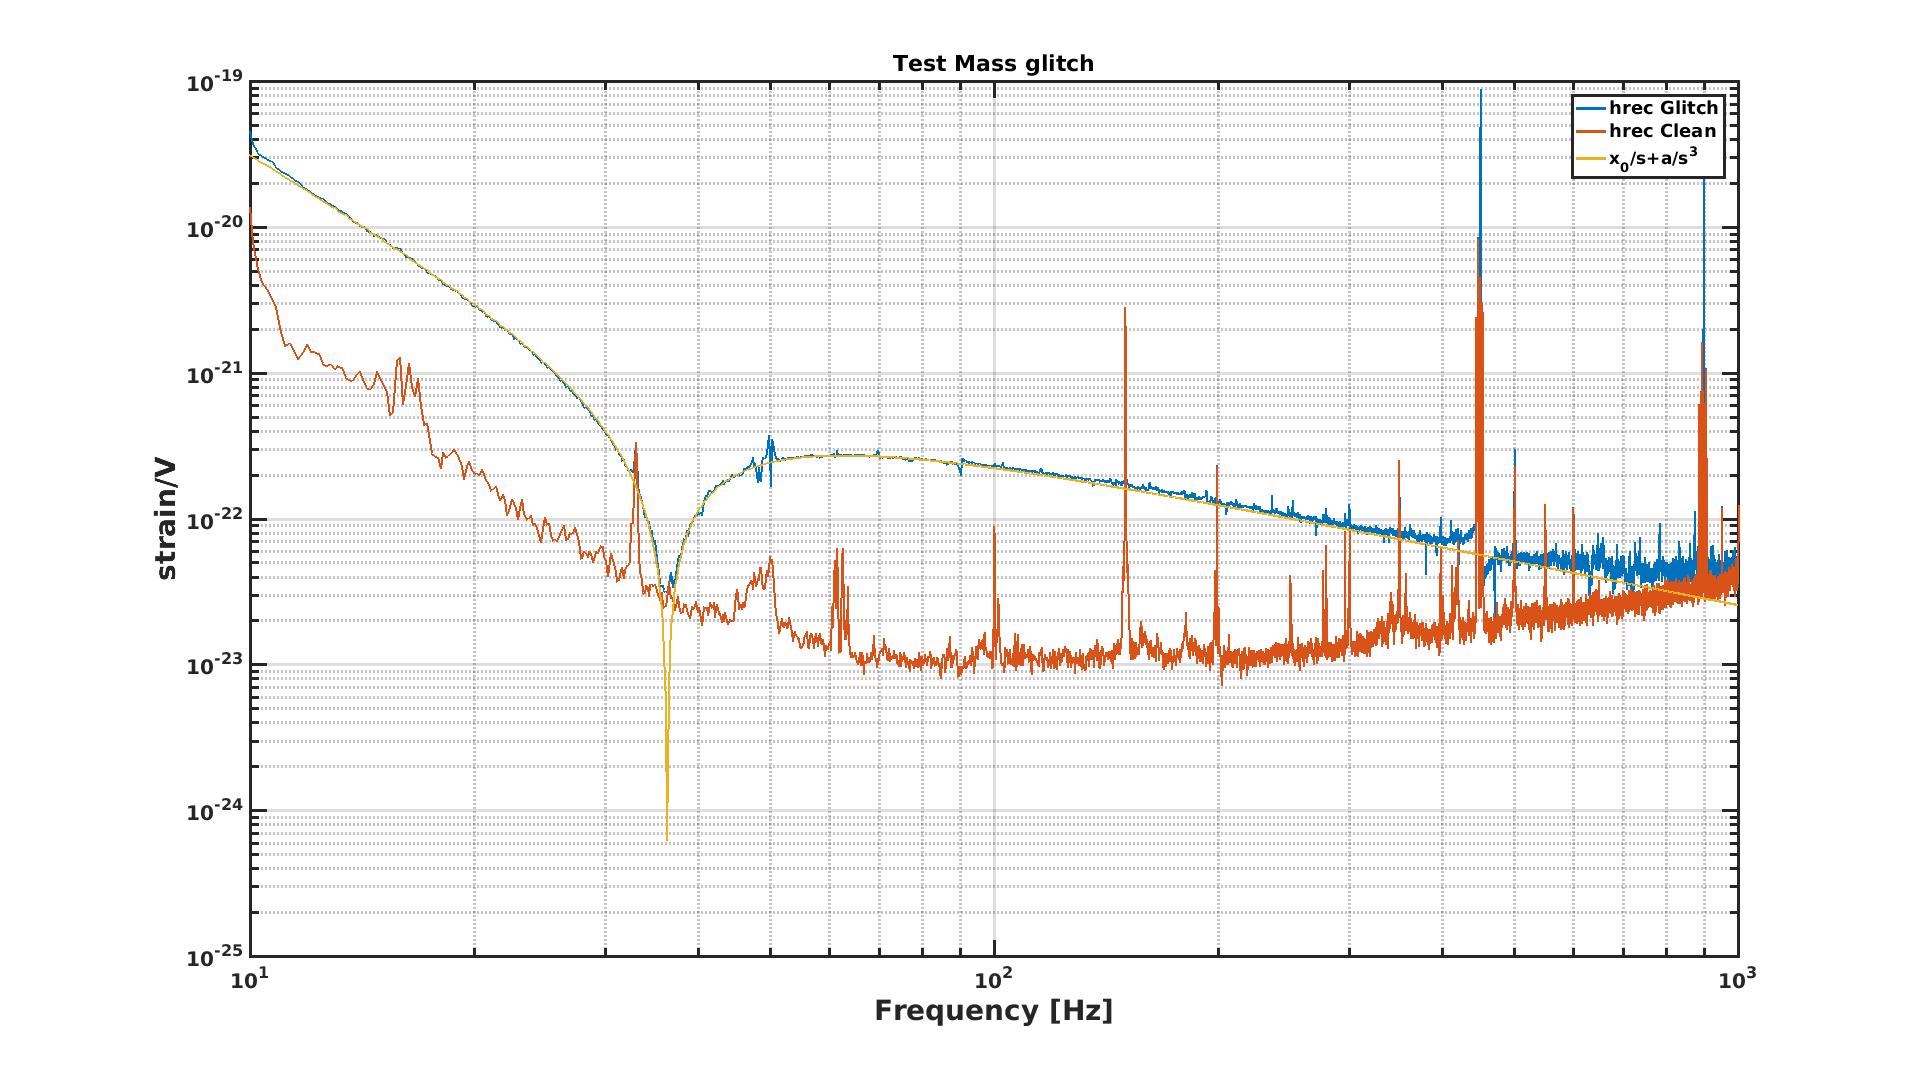
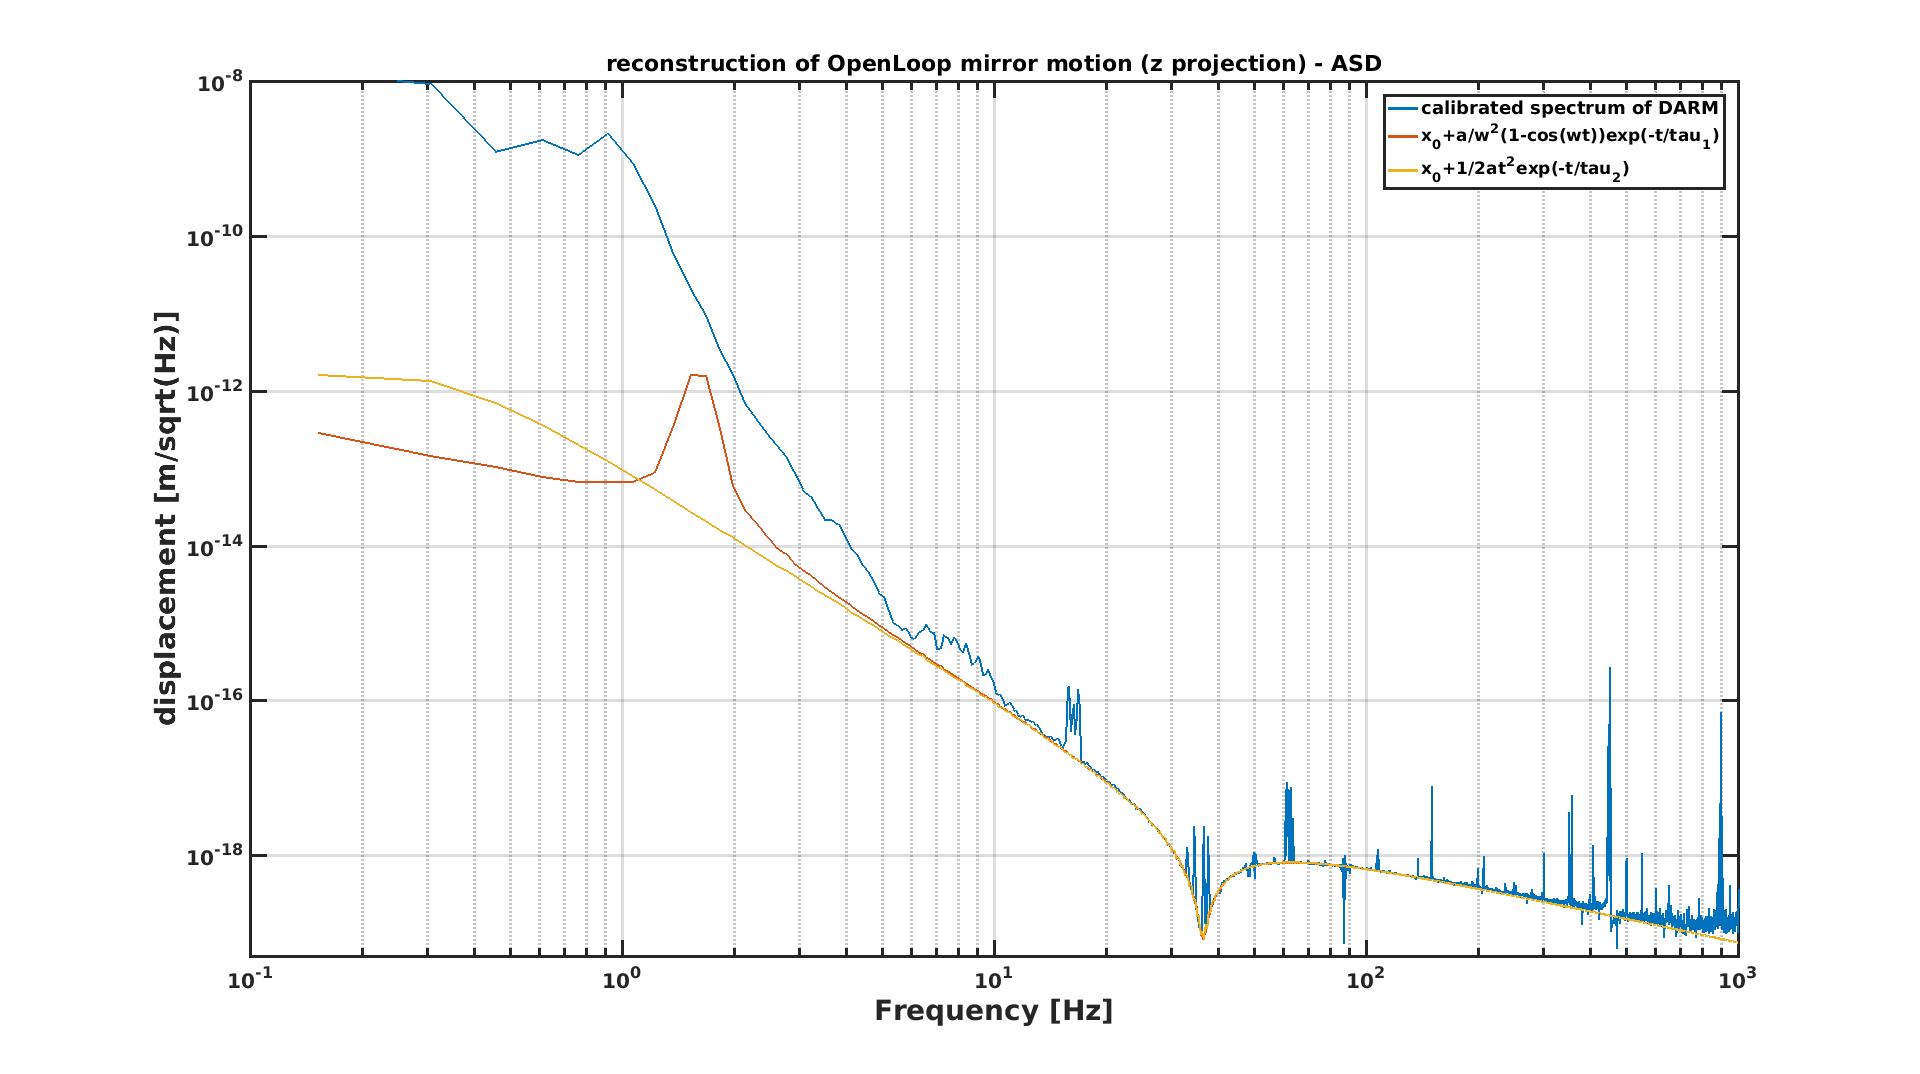
The spectrum of hrec during the glitch seems to contain interesting informations about the dynamic of the event.
In fig 1, one can see that hrec is almost perfectly fitted by a very simple curve:
which is the Laplace transform of:
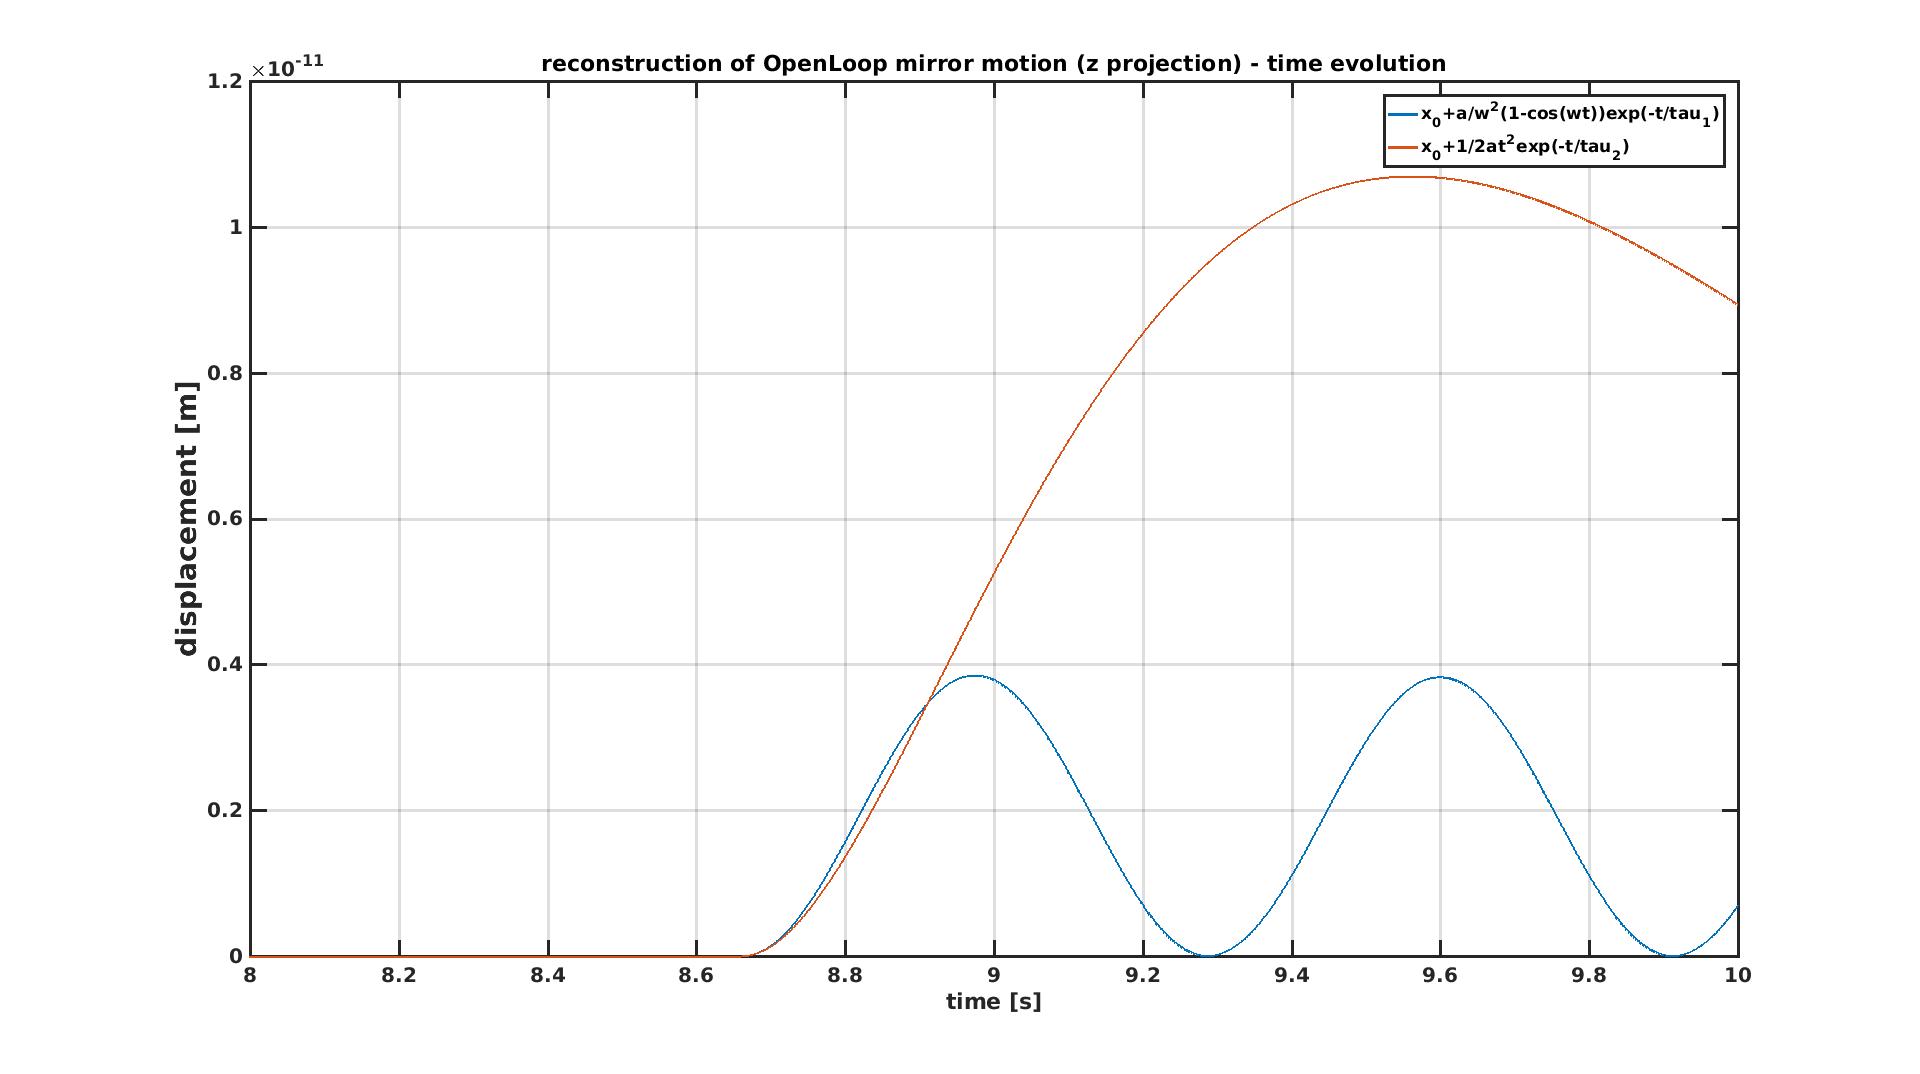
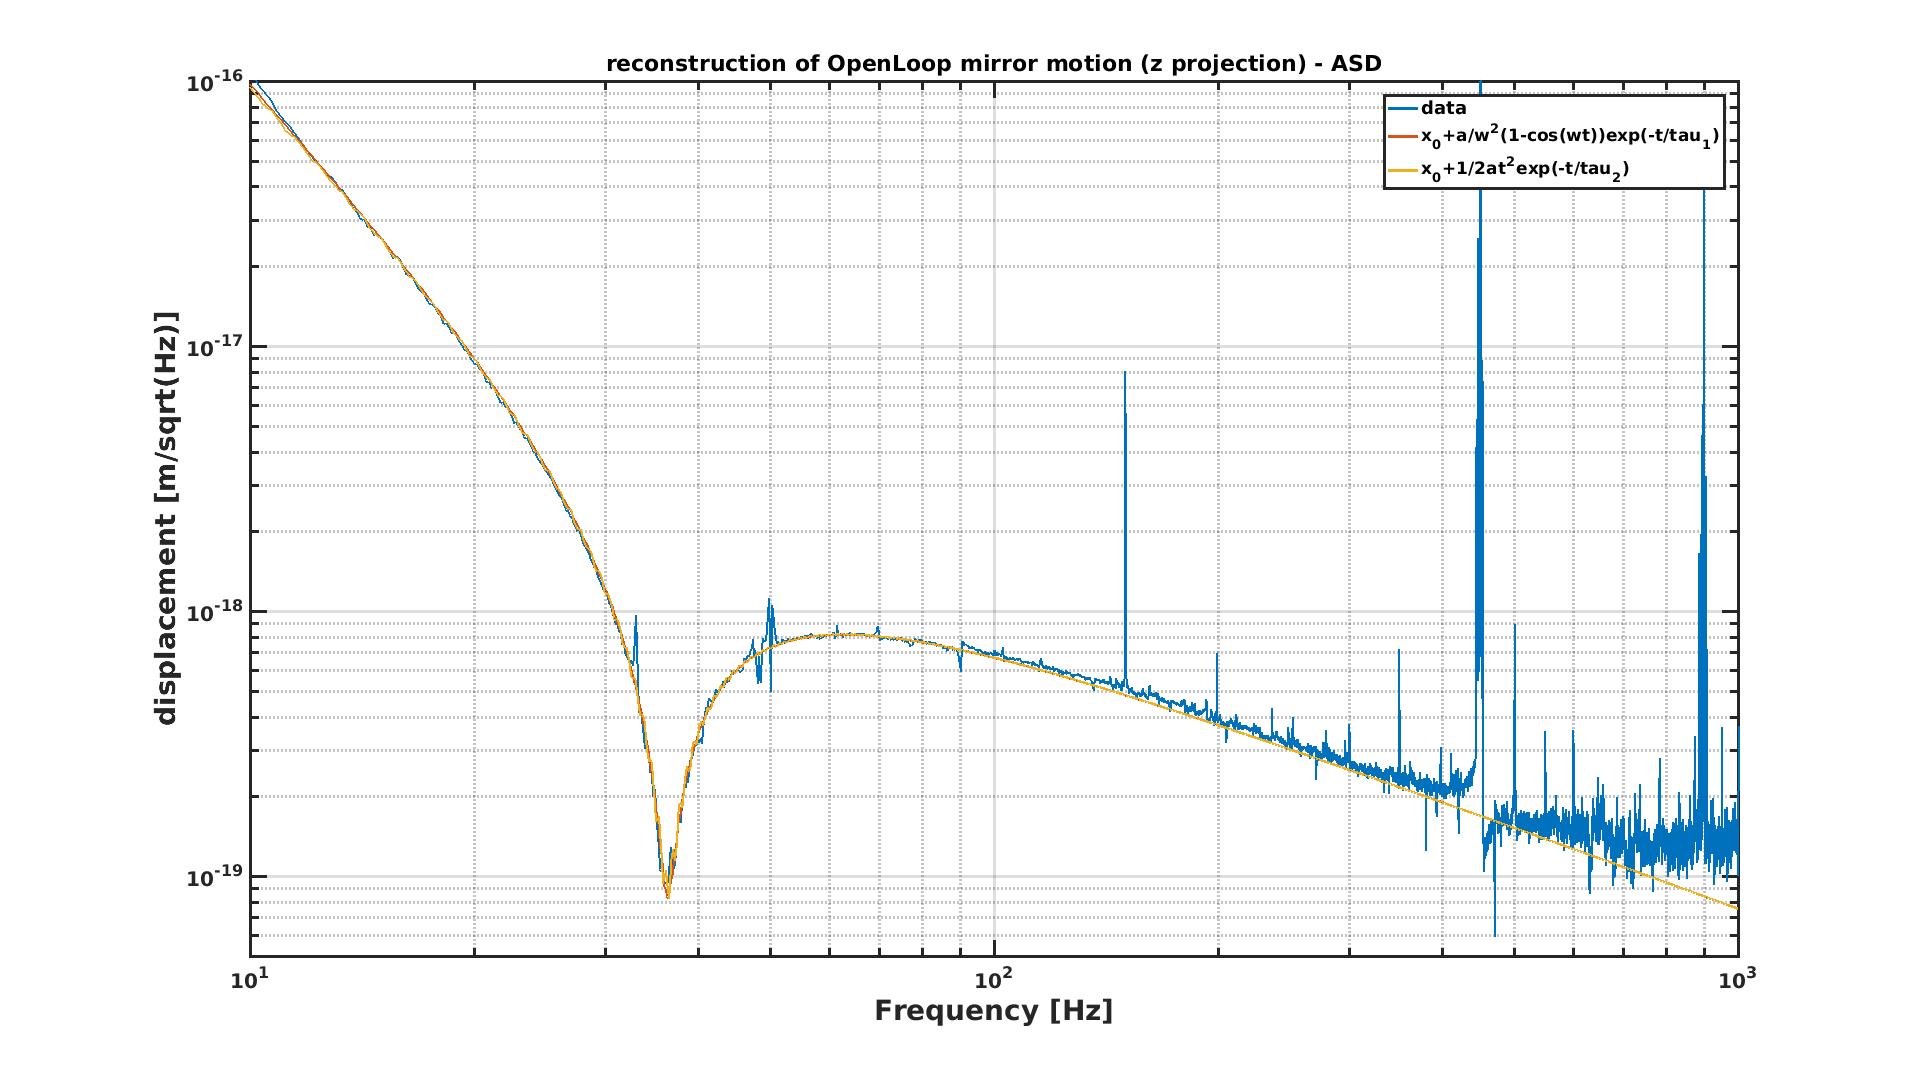
This is not the only equation of motion compatible with that spectrum, because in the data any information about the low frequency content is missing. For example, the two time series shown in fig 2:
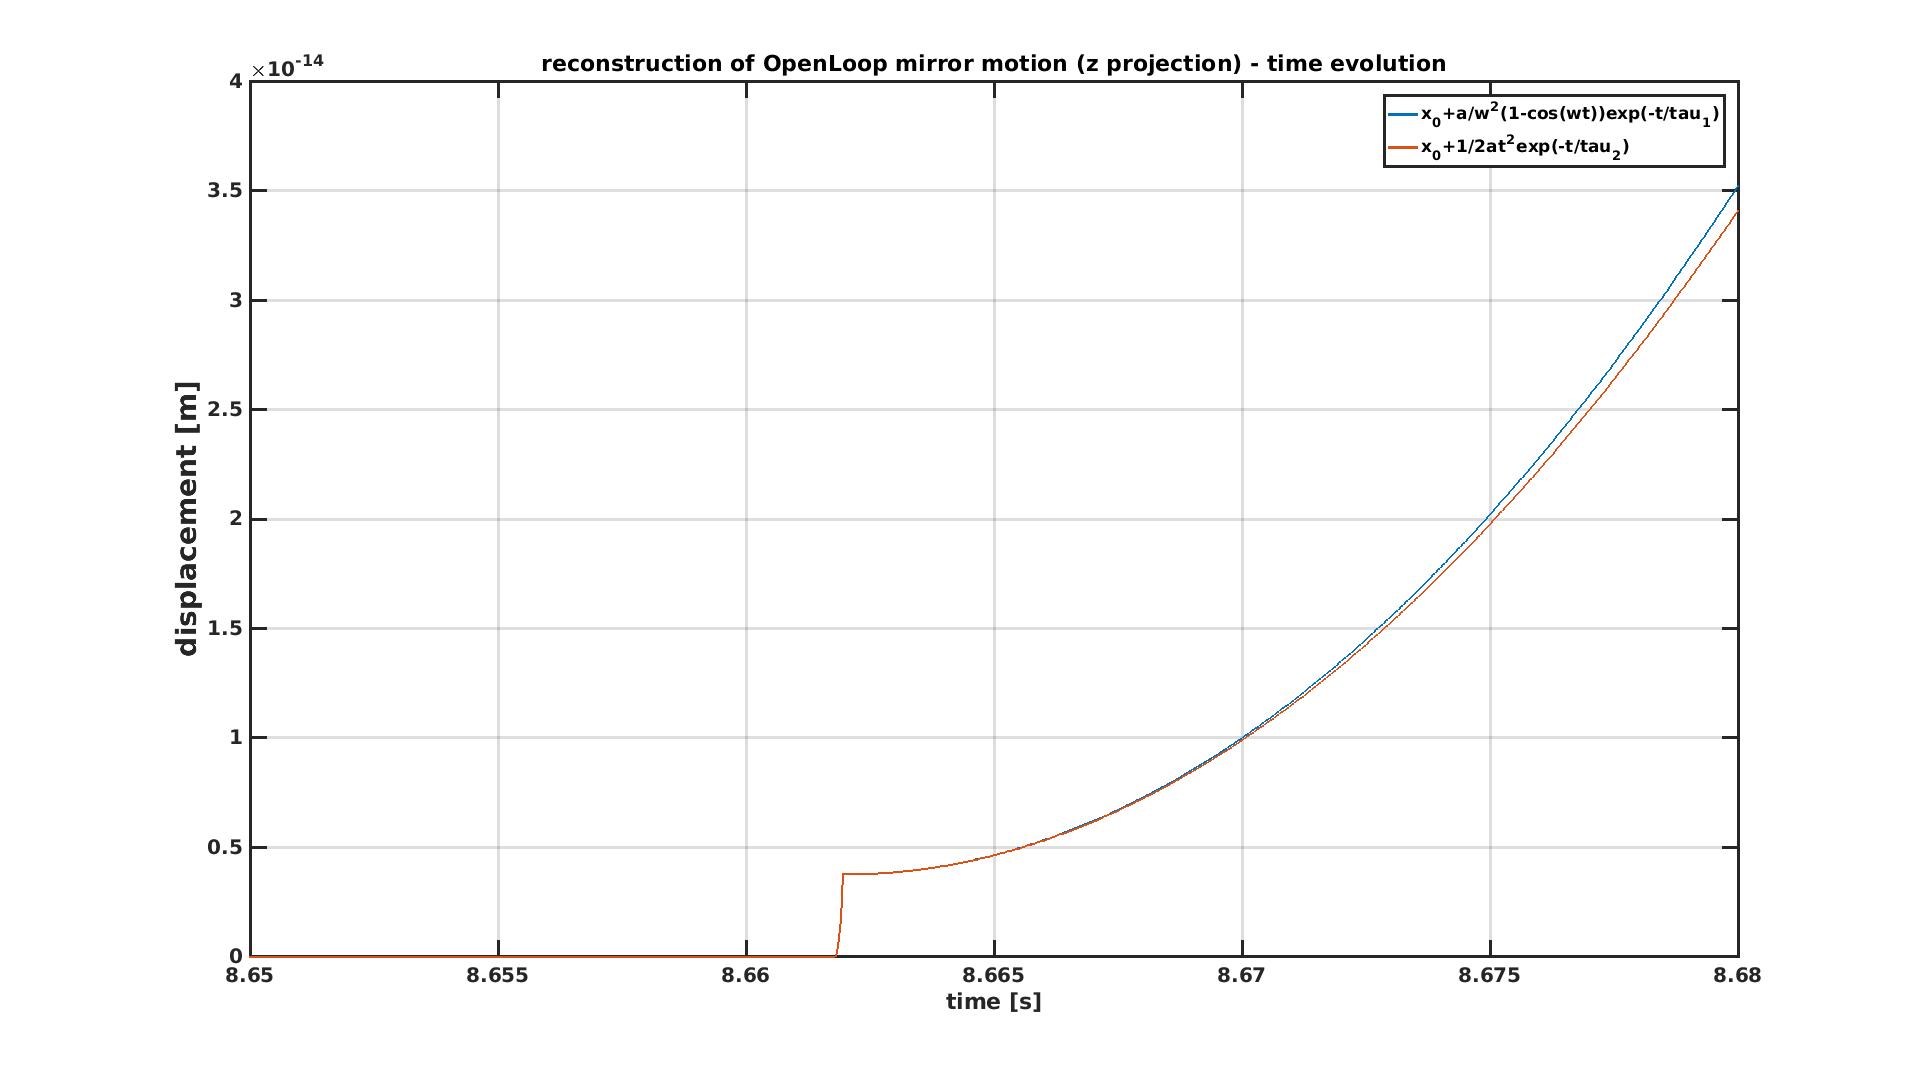
are both compatible with the data (fig 3). The two curves have in common the amplitude x0 of the step at t0, and the acceleration a at t0 (fig 4). The difference in the spectrum is visible only looking at the low frequencies (fig 5), but it is clear that the sensitivity of DARM is not enough to appreciate it in the data. In practice, the level of the 1/s shape at high frequency defines uniquely the amplitude of the step (and moreover put an upper limit to its duration); the frequency fN of the notch defines uniquely the inititial acceleration (just after the step) a=x0*(2*pi*fN)^2. The depth of the notch can put some constraint to the following evolution, but the arbitrariness remains high, even because the measured depth is cut by the noise floor of hrec.
Now, let's try to give a dynamical interpretation of the supposed time evolutions, in particular the one with the oscillation following the step. It seems to me that it is compatible with a fast and tiny yielding, or sliding, or adjustment, at the level of one fiber edge (anchor?). During this event the edge of the fiber goes up, while the mirror goes down (the center of mass stays still). The mirror displacement, projected along the cavity axis, is the step x0.
When the connection is restored, the fiber is a little bit uncharged, because of the displacement of its edge, so the weight of the mirror is not perfectly compensated by its elastic reaction. The residual force is the reason of the initial acceleration seen in hrec. The center of the following oscillation is neither the old zero nor the initial x0, but is shifted by the amount of the total sliding between the mirror and the fiber edge (see again fig 2).
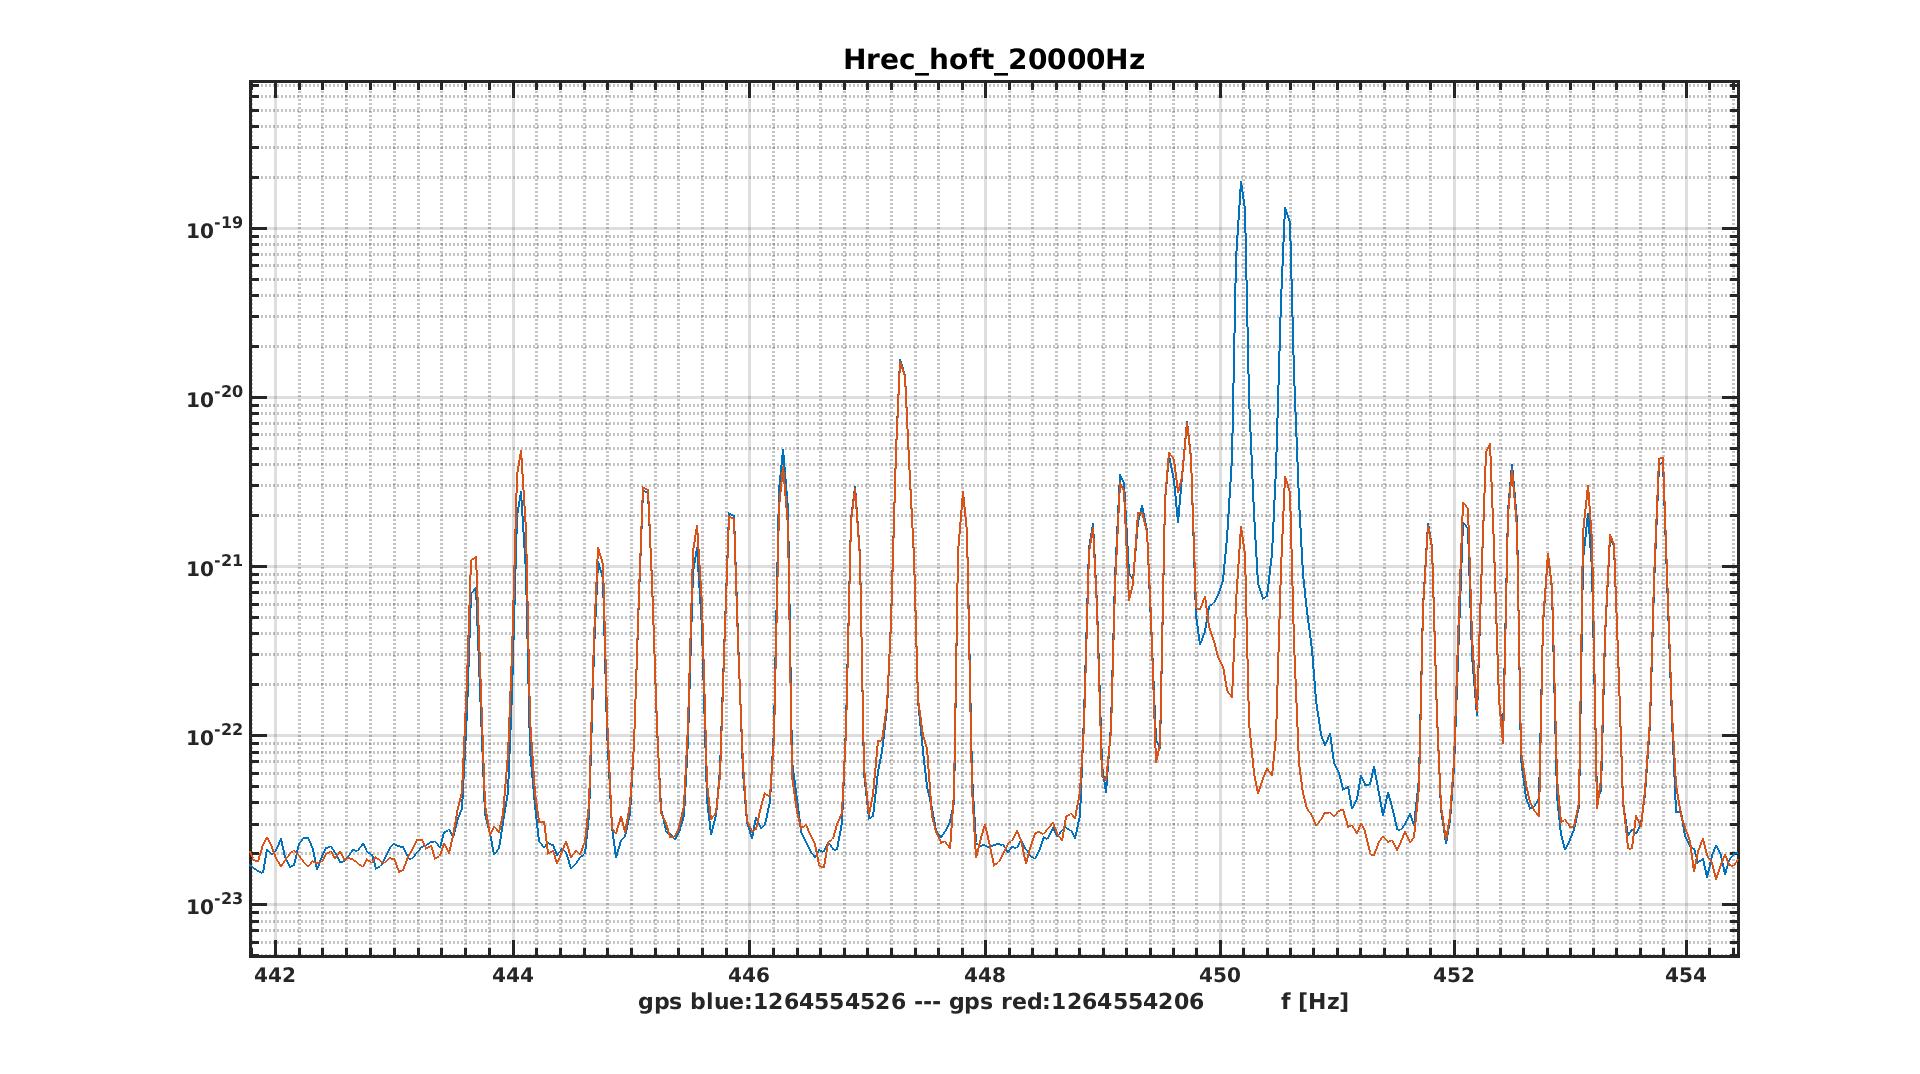
In support of the hypothesis that a single fiber is involved in the event, there is the fact that only two lines in the comb of violin modes are excited (fig 6 - if I'm not wrong, for each fiber two modes are visible).
Lets' move to a quantitative analysis.
Unfortunately, what can be precisely measured is just the projection along z of the mirror kinematic parameters. Those are:
x0=3.75e-15 m
a=1.95e-10 m/s^2
About the sliding s0 of the fiber edge, an estimation can be done after some arbitrary assumption. In the analysis shown above, I'm assuming 1.6 Hz for the frequency of the oscillation following the event (the pitch is excited). This gives:
s0|z=2e-12 m
Considering a coupling at least 1e-2, the sliding is less than 0.2 nm (but this number could be totally wrong for a lot of reasons, first of all because all the analysis could be wrong).
In my opinion, the event could give also some interesting information about the quality of the payload mechanical response, or, from a different point of view, about the quality of h recostruction. But I leave the topic to the experts, if interested.
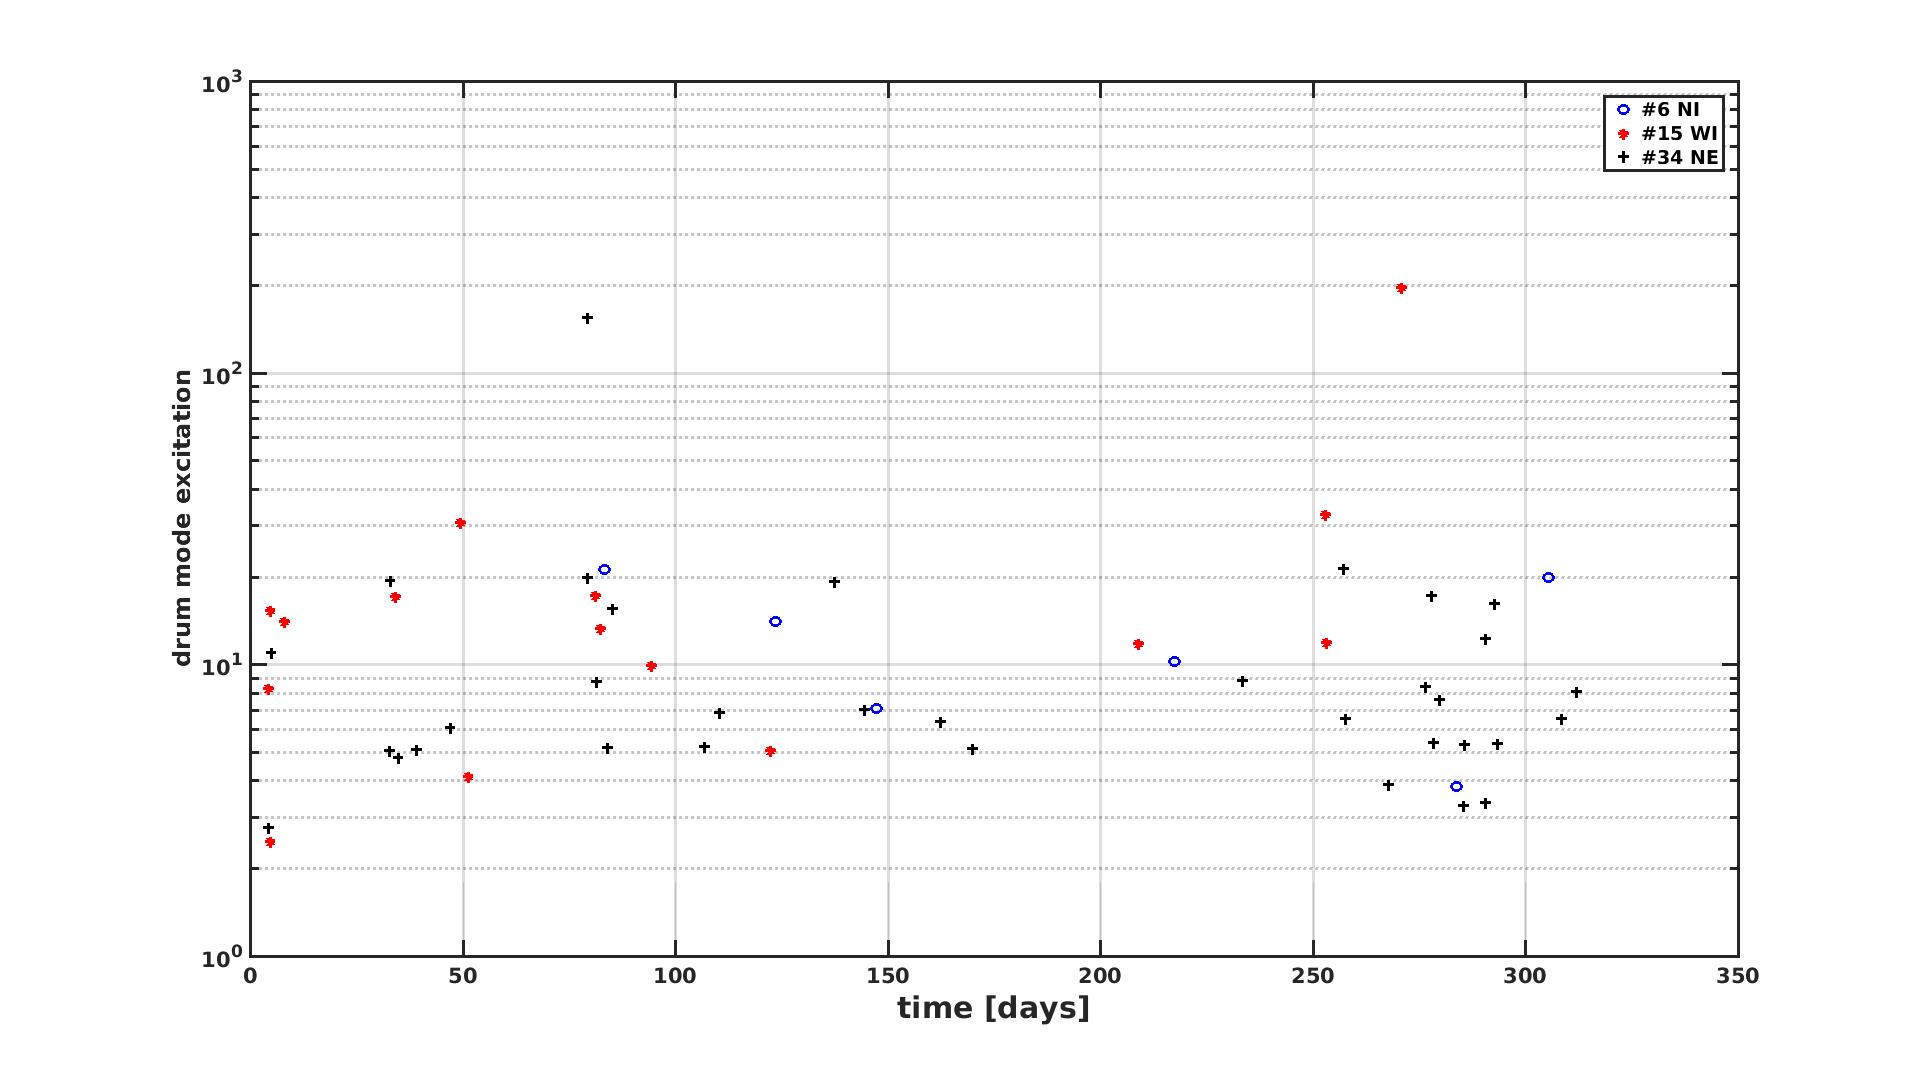
The attached file lists several glitches involving the excitation of one drum mode. The ranking is:
NE: 34
WI: 15
NI: 6
The identification of the TM responsible of the glitch is not so easy when the TM is one ETM, because the modes are almost overlapping, but finally I'm convinced that they are all related to NE ( a cross check is recommended).
I put also two plots showing the loudes events for each TM. Events like the NI one, with the notch in the spectrum, are very rare, but are there: I found two of them related to NE.
There is a peculiarity about the NE drum excitation: the decay time looks always quite short. it would be worth to check the associated thermal noise.

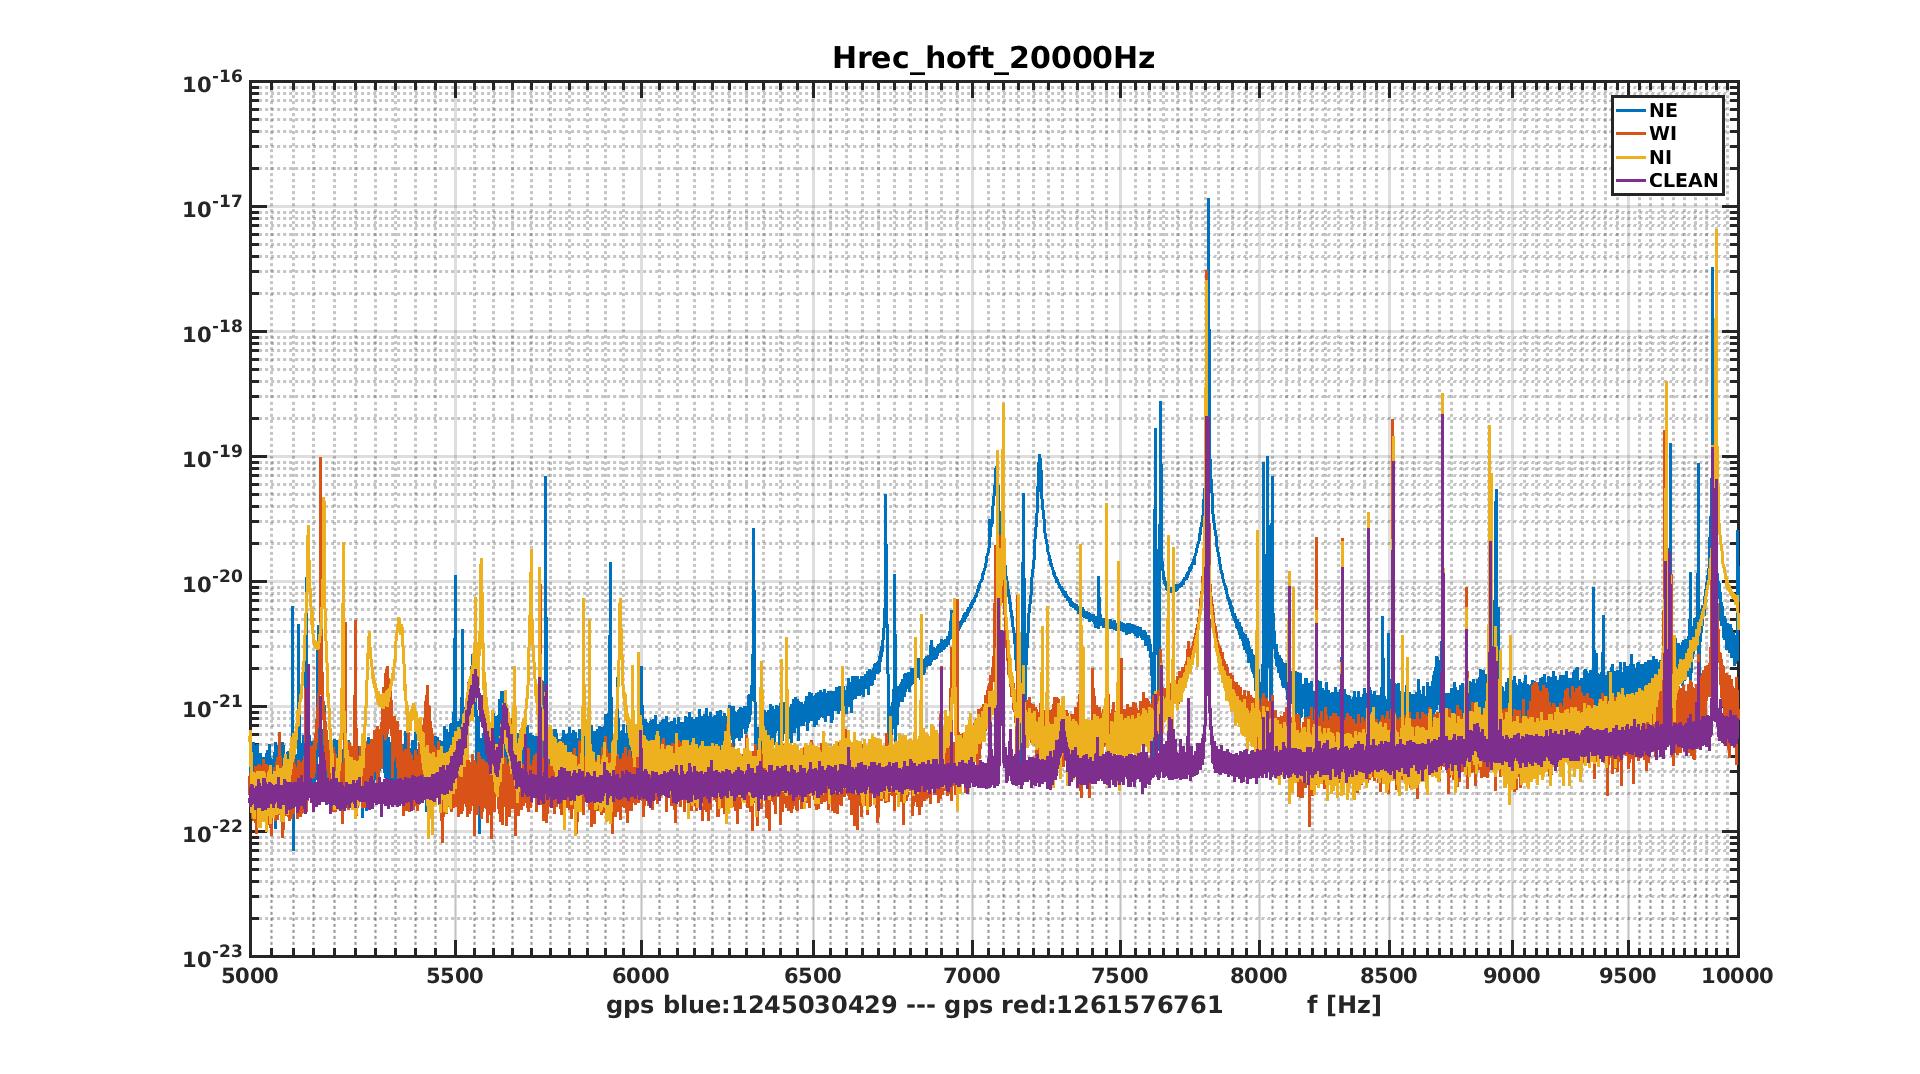
The WI drum mode has a frequency of about 7806 Hz, while the NI drum mode has a frequency of about 7804.9 Hz. So, in the log the NI must be replaced with WI and viceversa.