Reports 1-1 of 1 Clear search Modify search
AdV-COM (AdV commissioning (1st part) )
mantovani, brooks, nocera, paoletti, montanari - 15:40 Wednesday 31 July 2019 (46546) Print this report
RAM measurement and noise projection

On monday morning we carried out a shift in order to measure the noise contribution to the sensitivy of the RAM (residual amplitude modulation).

Federico, Flavio and Beatrice will put a comment to this entry to explain the measurement setup.

Different levels of RAM have been injected at the level of the 56MHz modulator, allowing to measure the coupling on DARM.

noise ampl =  3 ; GPS = 1248439200; duration = 60sec

noise ampl = 6;  GPS = 1248439347; duration = 60 sec

noise ampl = 12; GPS = 1248439427; duration = 60 sec

noise ampl = 21 (which corresponds to 10^-5 of RAM); GPS = 1248439527; duration = 60 sec

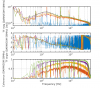
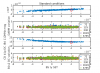
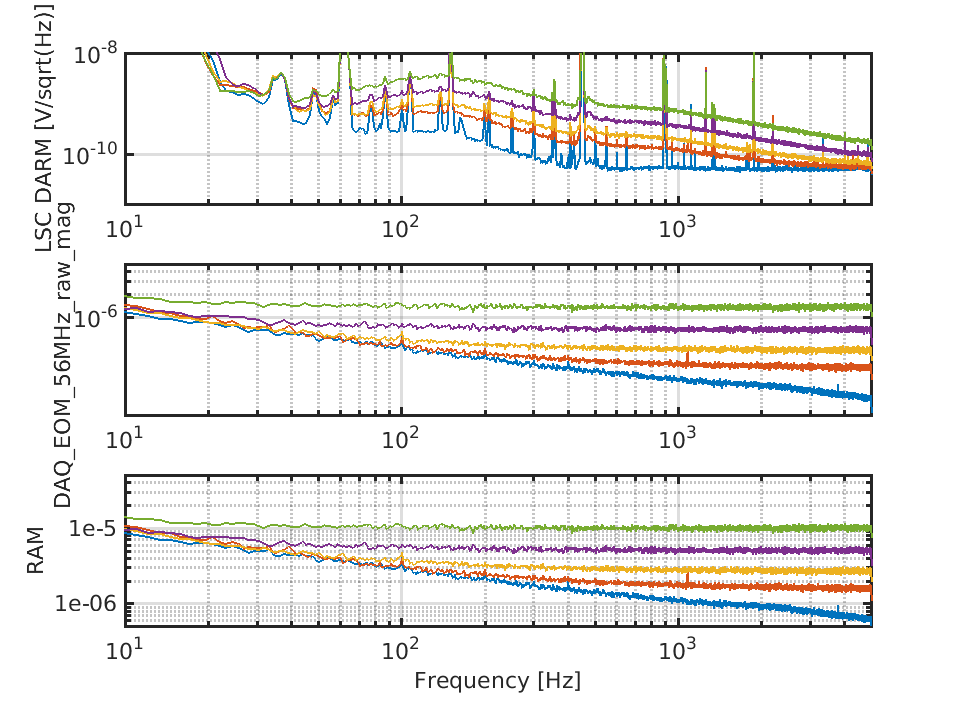
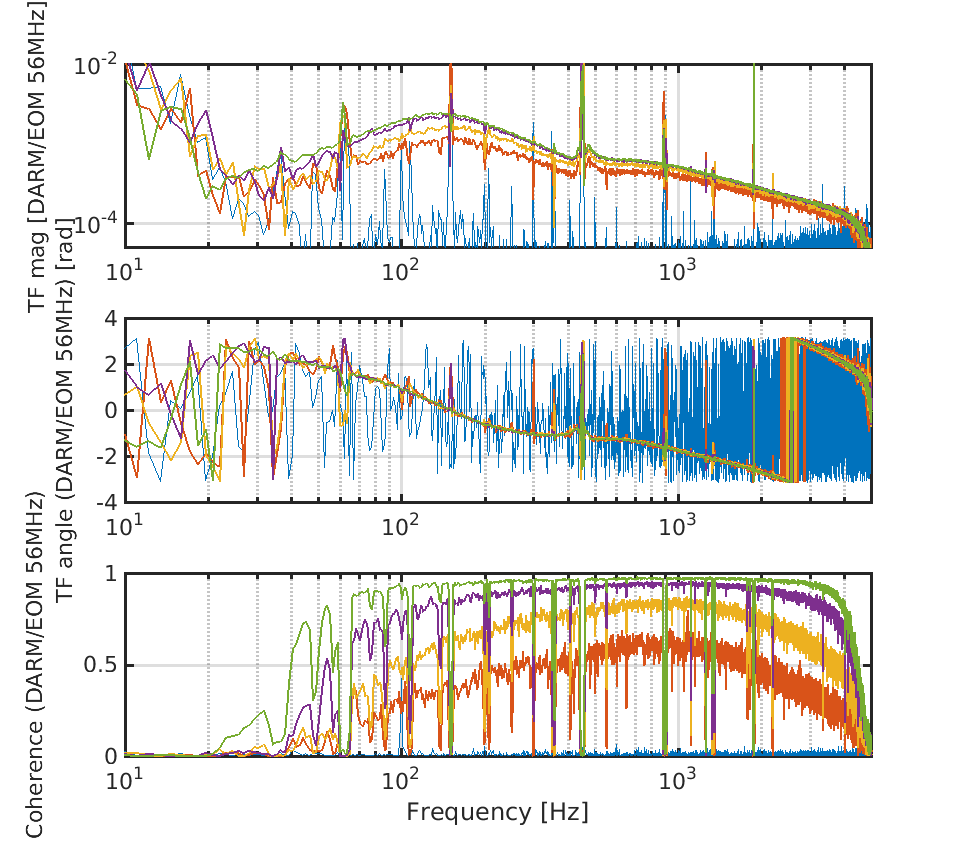
In Figure 1, it is visible in the top plot the effect of the RAM noise on DARM, while on the mid plot the noise level as it is seen by the channel DAQ_EOM_56MHz_raw_mag, while the bottom plot is the RAM noise calibrated.

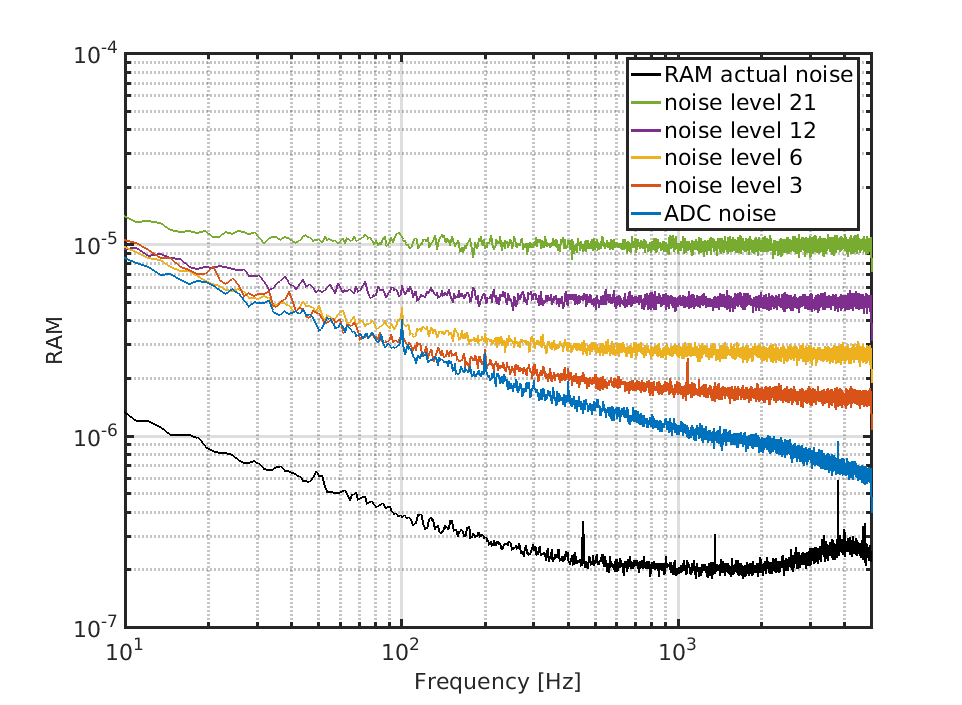
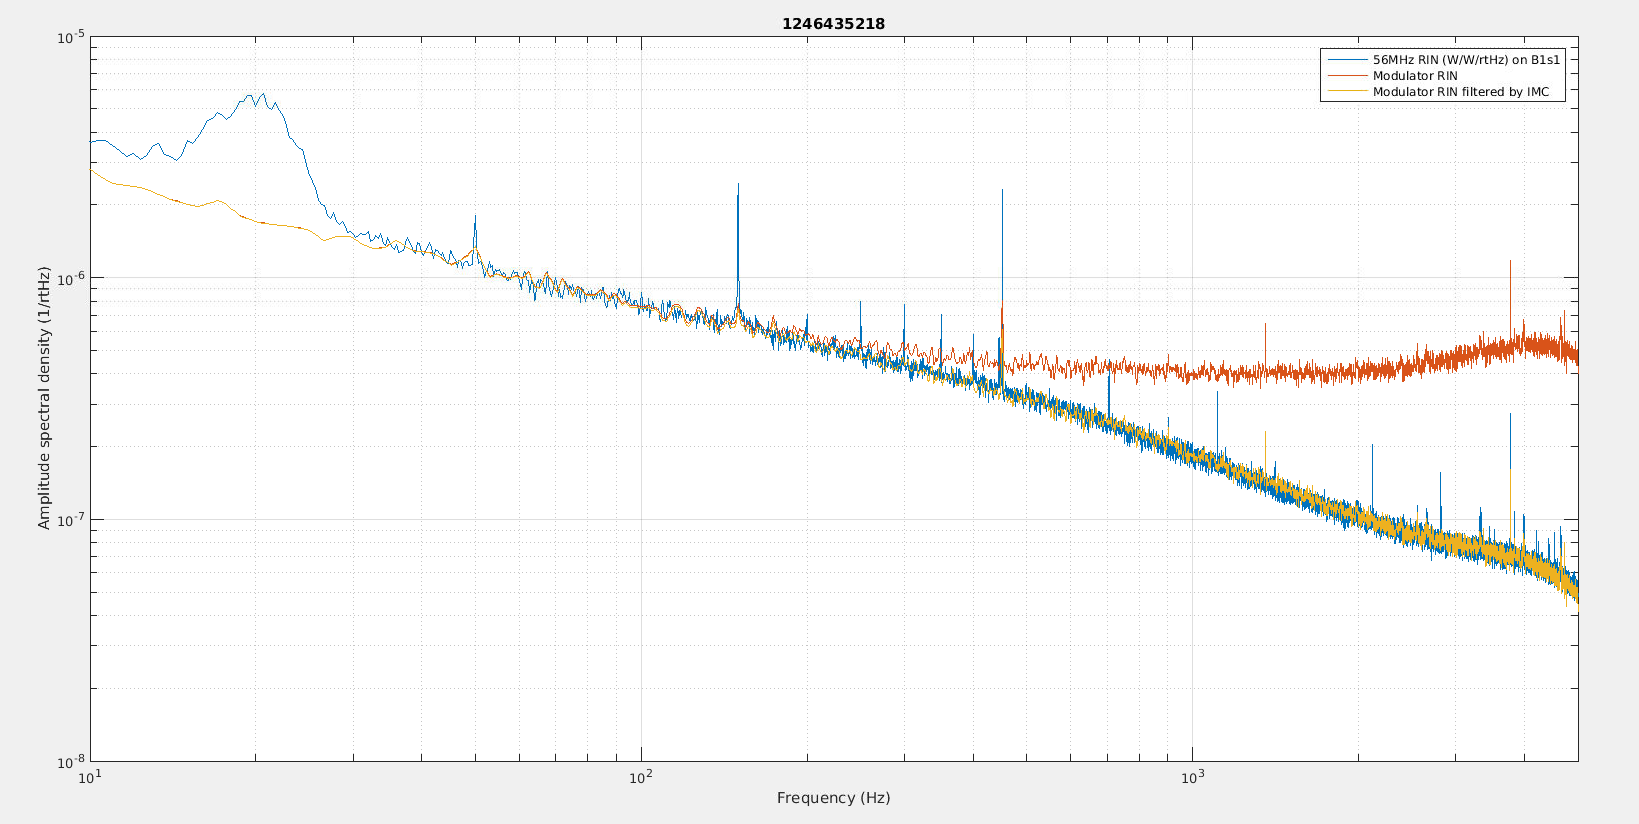
the DAQ_EOM_56MHz_raw_mag can be calibrated in RAM noise considering that the green curve in figure 1 corresponds to a RAM noise @ 1kHz equal to 10^-5, thus the conversion factor between the DAQ channel and the RAM is RAM/DAQ_EOM = 7.3869;

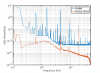
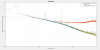
The calibrated noise curves can be compared in figure 2 to the actual noise (black curve) from which is visible that the DAQ_EOM_56MHz_raw_mag channel can not be used as a monitor for the actual RAM since its dominated by ADC noise.

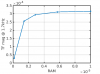
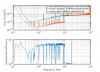
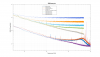
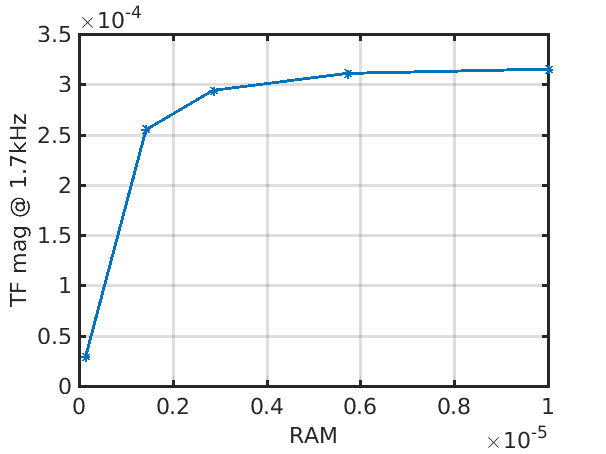
Using these noise injections the TF between DARM and the EOM noise can be computed, see Figure 3. The convergence of the TFs can be seen as a function of the input RAM noise in Figure 4.

In the following the TF which will be used for evaluating the noise projection is the one which has the highest coherence, corresponding to the highest level of noise i.e. the green curve.

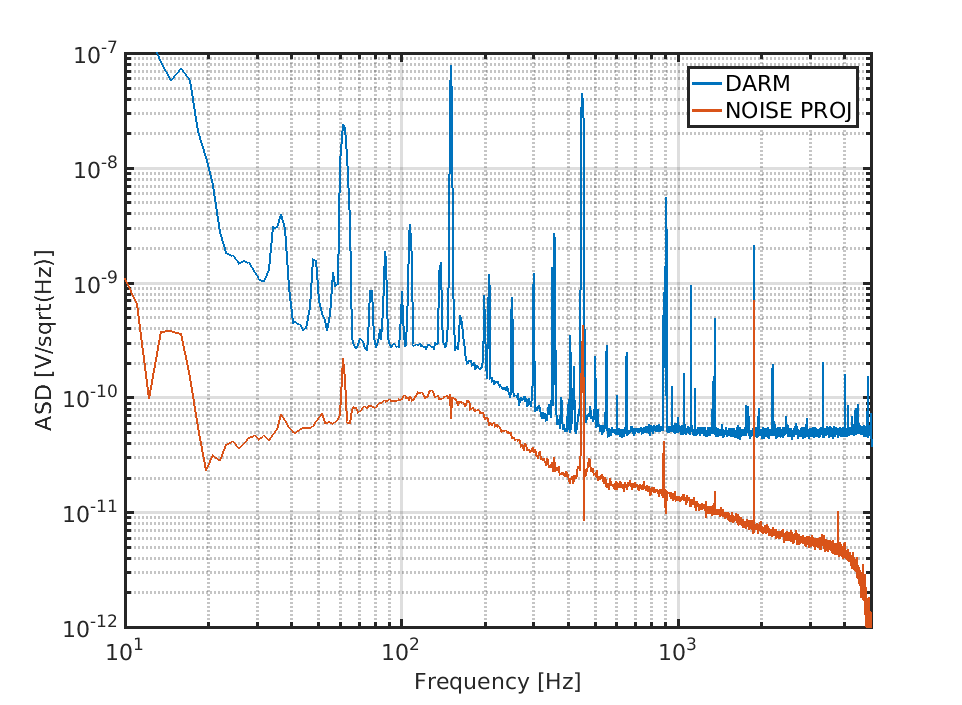
The noise projection is visible in Figure 5 and it stays below the sensitivity of a factor ~2.3. It is interesting to notice that the noise projection has the same shape of DARM but not limiting as the RAM is contributing to DARM with a flat noise which has a simila coupling TF to the DARM. To be understoon.

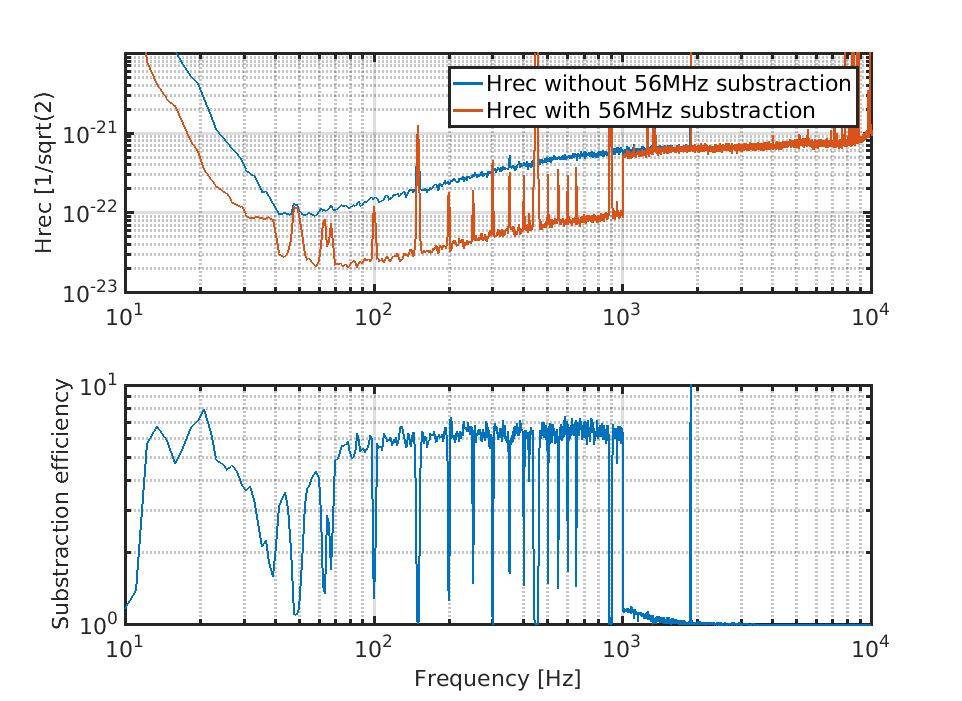
It is worth noting that for this analysis we are using the DARM signal since in hrec the 56MHz noise is substracted in Hrec with a factor ~10, see Figure 6.

***

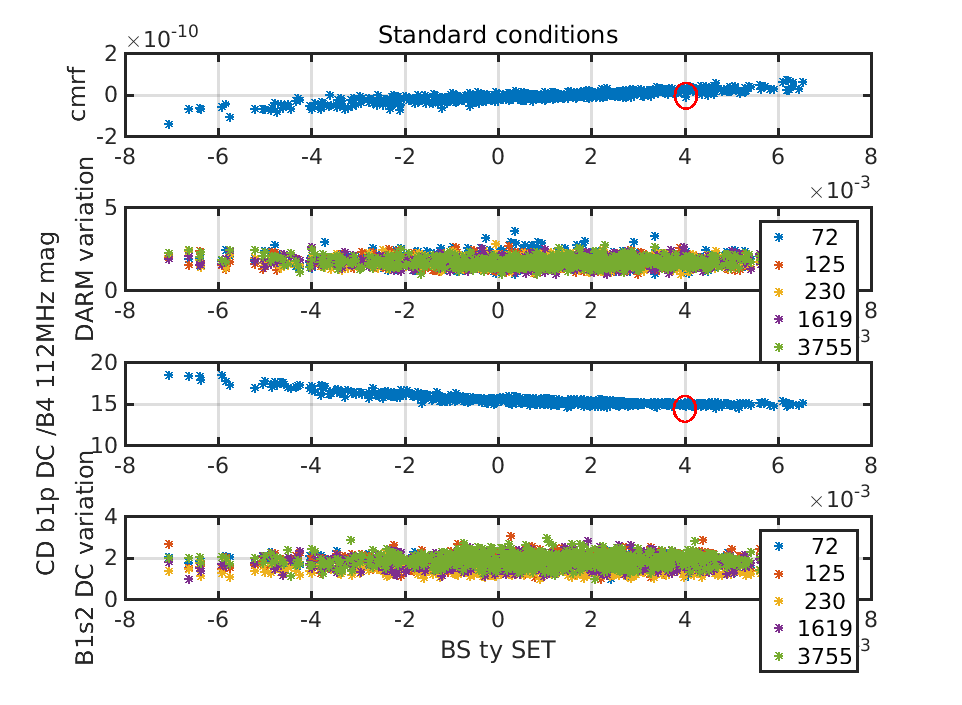
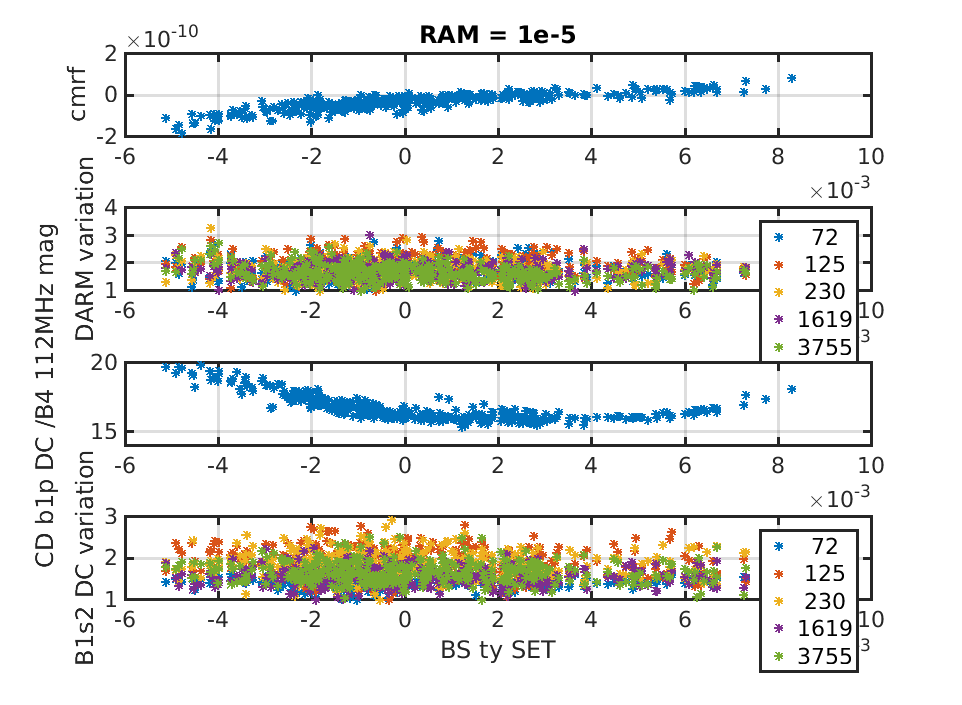
Moreover we have done a scan of BS ty to try to worsen the RAM coupling with and without noise, Figures 7 (no injected noise) and 8 (injected noise), but no correlation is visible on the DARM ASD, taken at various frequencies 72Hz, 125Hz, 230Hz, 1619Hz, 3755Hz, while it is visible the correlation with the CMRF and Contrast Defect

Images attached to this report
Comments to this report:
nocera - 11:03 Thursday 01 August 2019 (46555) Print this report

B. Montanari, F. Nocera, F. Paoletti

First of all, some details about the measurement setup.
To inject amplitude noise, we put in series between the RF Distribution output and the 2W RF Amplifier a four-quadrant mixer; the second input port was used to inject different levels of white noise.
This is the same setup already used in similar measurements in the past.

Then a somewhat electronics aside.
A previous attempt of measuring the 56 MHz RAM and its effect on Virgo sensitivity was carried on last January (see entry 44588).
Based on the data reported on a following entry (44590) much speculation about weather or not the contribution of the RAM was already limiting our current sensitivity brought to a lengthy discussion.
In particular, the point was whether or not the data reported in the entry mentioned were dominated by the acquisition chain (monitor circuit + ADC Channel --ADC#34 channel 3).
Additional measurements have been done now to clarify the issue. Their results are commented here after describing how we've got to this point.

As reported in the entry 38123, on Jan 20th 2017 the original 1W amplifier for the 56MHz sideband has been swapped with a 2W one with the goal of increasing the modulation index "for a test" and, as it often happens, the test became permanent.
Each EOM has a monitor output where a (small) fraction of the voltage applied to the Pockels cell is made available. All this outputs are currently acquired. The 56 MHz one is used in the entry 44590.

We found out with a measurement on the bench that the RAM of an identical 2W amplifier had a signature that is worse than the 1 W originally installed, around 4 kHz (blue curve).
This feature was not visible in the data reported in the entry 44590.
We have just measured the output of the amplifier driving the 56 MHz EOM and found that there is, in fact, a similar feature (orange curve).
It should then be visible in the RAM computed through the ADC (gold), instead it is not.

The acquisition chain (monitor circuit + ADC channel) is then adding noise.

We then injected directly in the same ADC channel the output of the LNFS to check whether the synthesizer RAM measured independently (purple) was the same when measured by the ADC (silver). This way we took the monitor circuit out of the picture.

The silver curve overlaps with the gold one, therefore the additional noise comes from the ADC, not the monitor circuit.

In conclusion
(a) no signature bump is visible in the data acquired through the ADC
(b) the noise level as measured by the ADC is ~10 times higher than the real one (for f< 1kHz)
(c) this channel cannot be used to make projection of RAM contribution to sensitivity in normal, operating conditions.


Then, for completeness, also the the RAM as measured with this ADC channel during our amplitude noise injection are reported.


Images attached to this comment
mwas - 16:48 Thursday 01 August 2019 (46561) Print this report

The measured RAM of the installed 2W amplifier can be compared to the mesured RIN of the 56MHz sideband as seen at the output of the interferometer by the B1s1 photodiode which is dominated by the 56MHz modulation amplitude noise.

Figure 1. Shows in red the measured modulation relative intensity noise (which is 2 times the measured RAM - relative amplitude modulation noise), in yellow is the same spectrum, filtered by the pole of the IMC which is expected to be at 520Hz (#31879), in blue is the measure RIN on the B1s1 photodiode. The expected RIN on the B1s1 photodiode due to the installed 2W modulator matches extremely well the measured RIN once the IMC filtering is taken into account. So the amplifier is the dominating source of the 56MHz side-band amplitude noise observed on the light at the output of the interferometer.

/users/mwas/ISC/RINB_B1s1_20190706/comparRIN.m

Images attached to this comment
nocera - 14:18 Friday 02 August 2019 (46568) Print this report

Just a clarification regarding Michal's comment (46561): it is not the 2W amplifier itself whose noise is dominating but the combination of the LNFS synthesizer and the 2W amplifier, as it can be seen in figure 1.
In blue you can see the LNFS RAM, in orange the (spare) 2W amp RAM (when measured with a "cleaner" RF Source) and in gold the incoherent sum of the (installed) 2W amp and the LNFS.
So the switch from the 1W to the 2W amplifier did not help (if interested, see figure 4.9 on pag 109 of the Advanced Virgo Technical Design Report) but that is not the whole story.

Please do not jump to conclusion, we did not choose "the wrong" RF source; The LNFS-100 was selected for its outstanding phase noise (which, at the time of the ADV TDR, seemed to be a major concern) although its amplitude noise was not as good (but still in specification).


Things deviated a lot from the baseline over the course of time, not always in a controlled way.

Images attached to this comment
Search Help
×

Warning

Error

The present report has been modified outside this window. Please check for its integrity in the main page.

Refreshing this page will move this report into drafts.

×