Reports 1-1 of 1 Clear search Modify search
Detector Characterisation (Glitches)
robinet - 8:33 Monday 15 July 2019 (46368) Print this report
PSTAB glitches analysis

I used the recent PSTAB noise activity to test (and validate) the current PSTAB monitoring (see 46334)

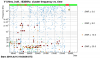
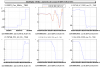
The first plot shows the omicron glitch distribution in h(t). The glitches around 20:00 UTC at f~100-200 Hz are caused by PSTAB. Some of these glitches are actually missed by omicron because they are too loud. Looking at the red/green strip chart at the top of the plot, there are many time segments when Omicron saturates (red segments). This is probably caused by loud glitches in PSTAB.

At 22:00 there is also a long segment missed by Omicron. This is also caused by PSTAB malfunctions.

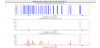
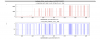
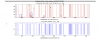
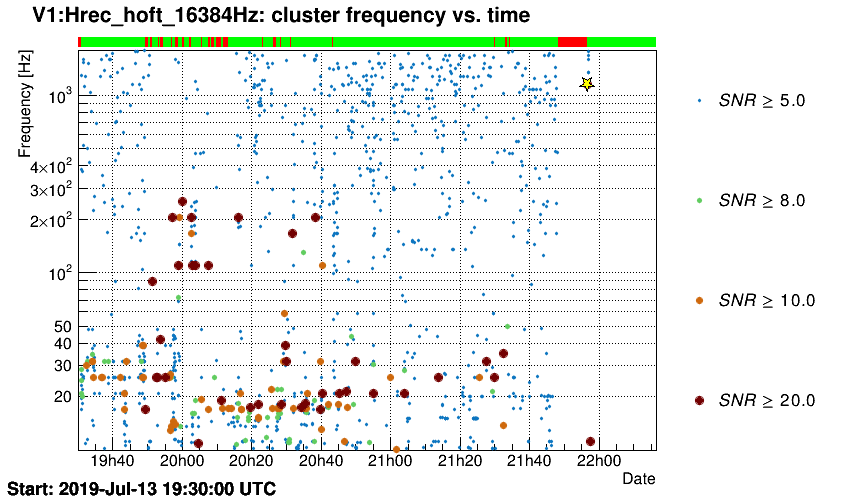
PSTAB glitch activity is monitored by 2 channels:

  • V1:OMICRON_RATE_SNR_70_ADC_PSTAB_PD1_AC: measures the glitch rate in PSTAB_PD1_AC with SNR>70
  • V1:DQ_Omicron_VETO_GENERIC_PSTAB_PD1_AC_2019-07-05-pstab: flags glitches in PSTAB for which there is a high probability that they couple to h(t)

Looking at these 2 channels (plot 2), it is clear that PSTAB is causing the glitches in h(t). Moreover, the glitch rate measured with V1:OMICRON_RATE_SNR_70_ADC_PSTAB_PD1_AC tells you how bad the situation is.

Images attached to this report
Comments to this report:
robinet - 11:01 Friday 19 July 2019 (46431) Print this report

It's been a week we monitor PSTAB glitches with V1:OMICRON_RATE_SNR_70_ADC_PSTAB_PD1_AC.

In Fig. 1, I plot the PSTAB monitoring channel and the nominal lock segments. What we see is a very loud glitch at the beginning of each lock segment. I think this has no impact on science. Note that the intensity of these glitches has increased by steps over time. I have no idea why...

In Fig. 2, I zoomed in the vertical axis. I reviewed all the peaks and the impact on the data. I circled in green glitches which caused a lock loss. These glitches are quite loud. In blue, I indicated the PSTAB glitches coupling to h(t). For example, there is a storm of glitches on July 13. Note that on the 17th and the 18th, glitches are not loud enough to couple to h(t).

Images attached to this comment
cleva - 19:27 Friday 19 July 2019 (46436) Print this report

# Up to now our concern (PSL) was to find out why we had some very loud glitches visible on PD1 and not on PD2. This seems to have been solved since 46399 (16/07, ~ 10H UTC) when we have discovered that the PD2 photodiode is likely flawed and eplaced it with PD1 photodiode.

Now the PD1 channel refers to the glitchy PD2 photodiode. This channel has no impact on the science since it is only a monitor signal and it is no more a releavant signal.

# PD2 channel (PD1 photodiode) is a good signal to monitor and check the correlation wrt h(t).

# it may be usefull to setup the same signal for PD2 (OMICRON_RATE_SNR_70_ADC_PSTAB_PD2_AC) ?

# at least the unlock pointed by a green circle is a fast unlock. PStab is just the witness of it and is not responsible for any trouble here. It is likely the same for each unlock ince PSTAB is not able to unlock the ITF (46397)  . See plot where EOM_CORR starts to drift before any other signal


Images attached to this comment
Search Help
×

Warning

×