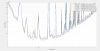
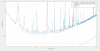
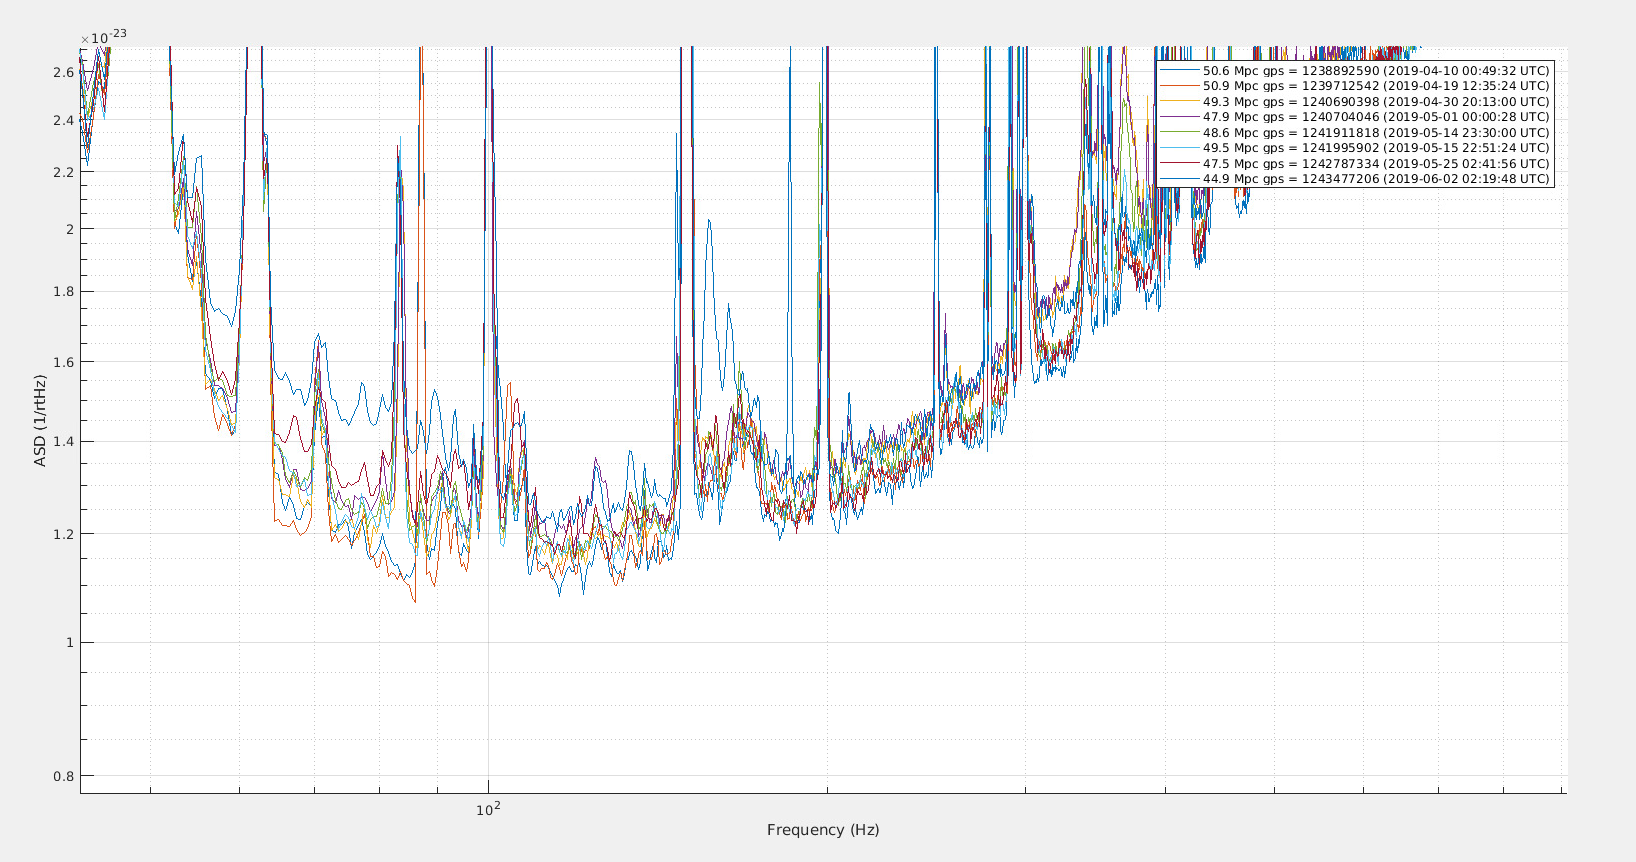
Figure 1 shows the spectrum of h(t) for each week starting from April 10, selecting each time the 30min with the best average BNS range (using harmonic average to select out range drops). The range was the best in the first two weeks, the noise between 70Hz and 140Hz has increased after that, being the worst in the last two weeks.
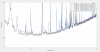
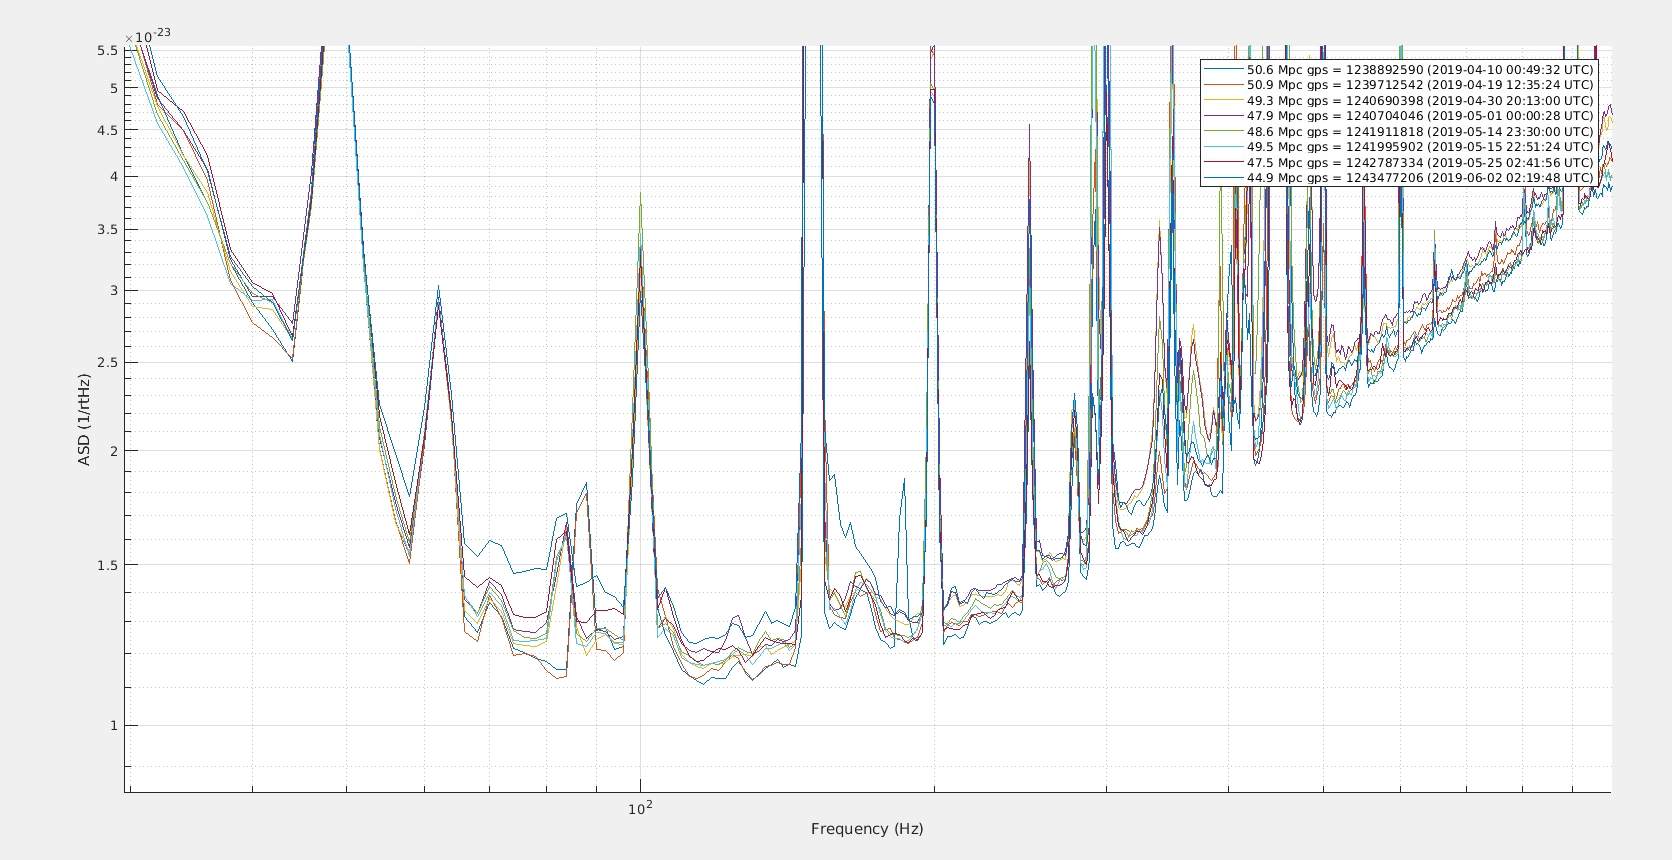
Figure 2 and Figure 5, shows the same but with a higher resolution PSD, it is hard to draw a conclusion as the figures become crowded.
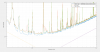
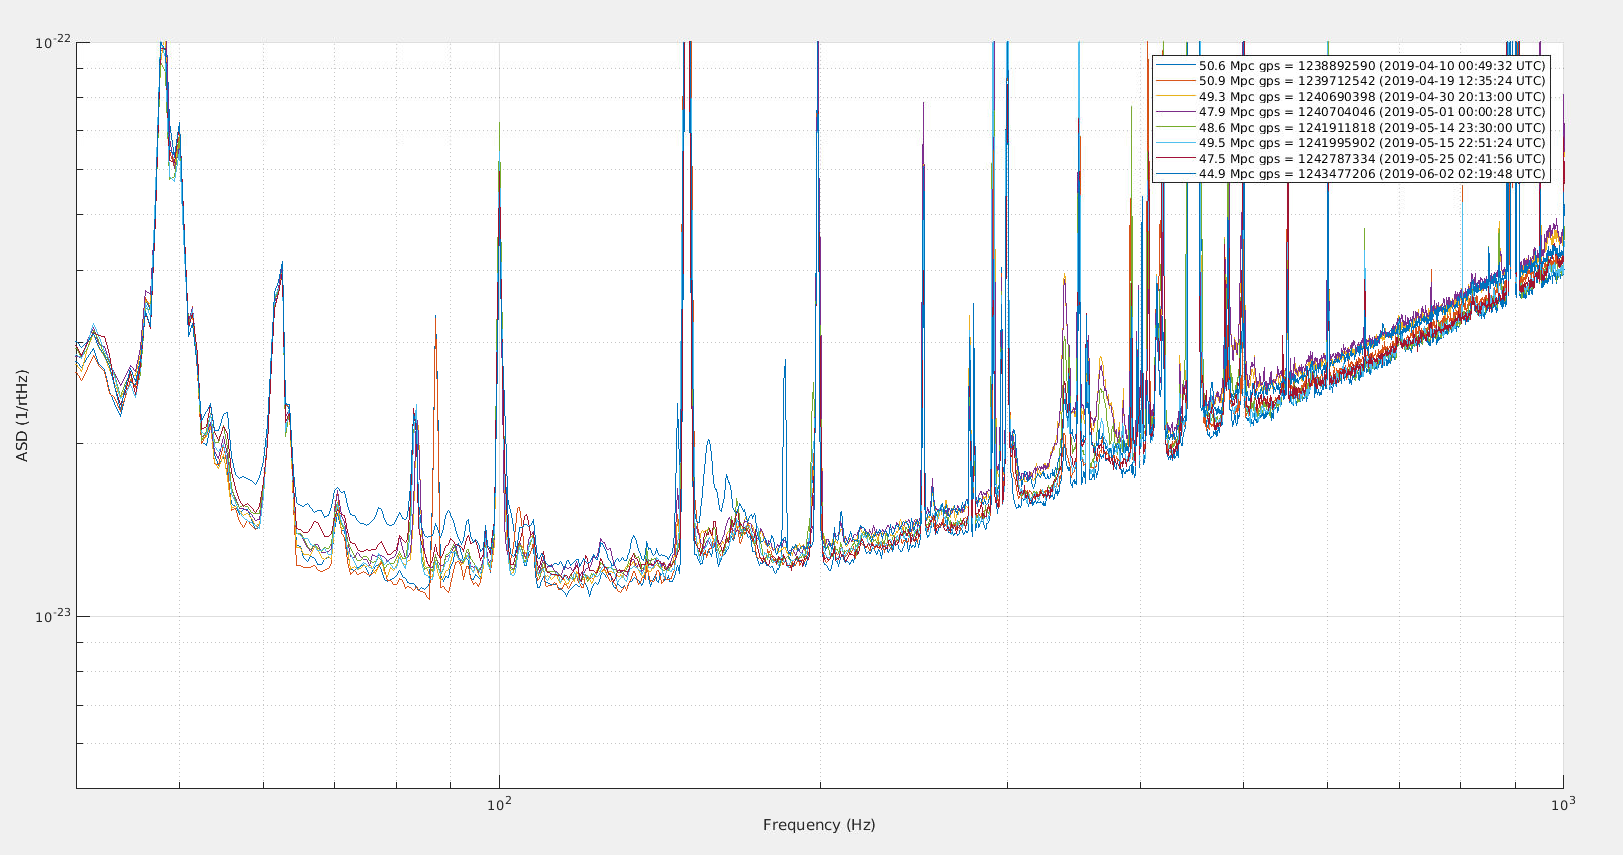
Figure 3 compares April 10 to June 2, and shows a large increased noise that can be fitted with f additional 1/F noise and increased shot noise
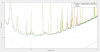
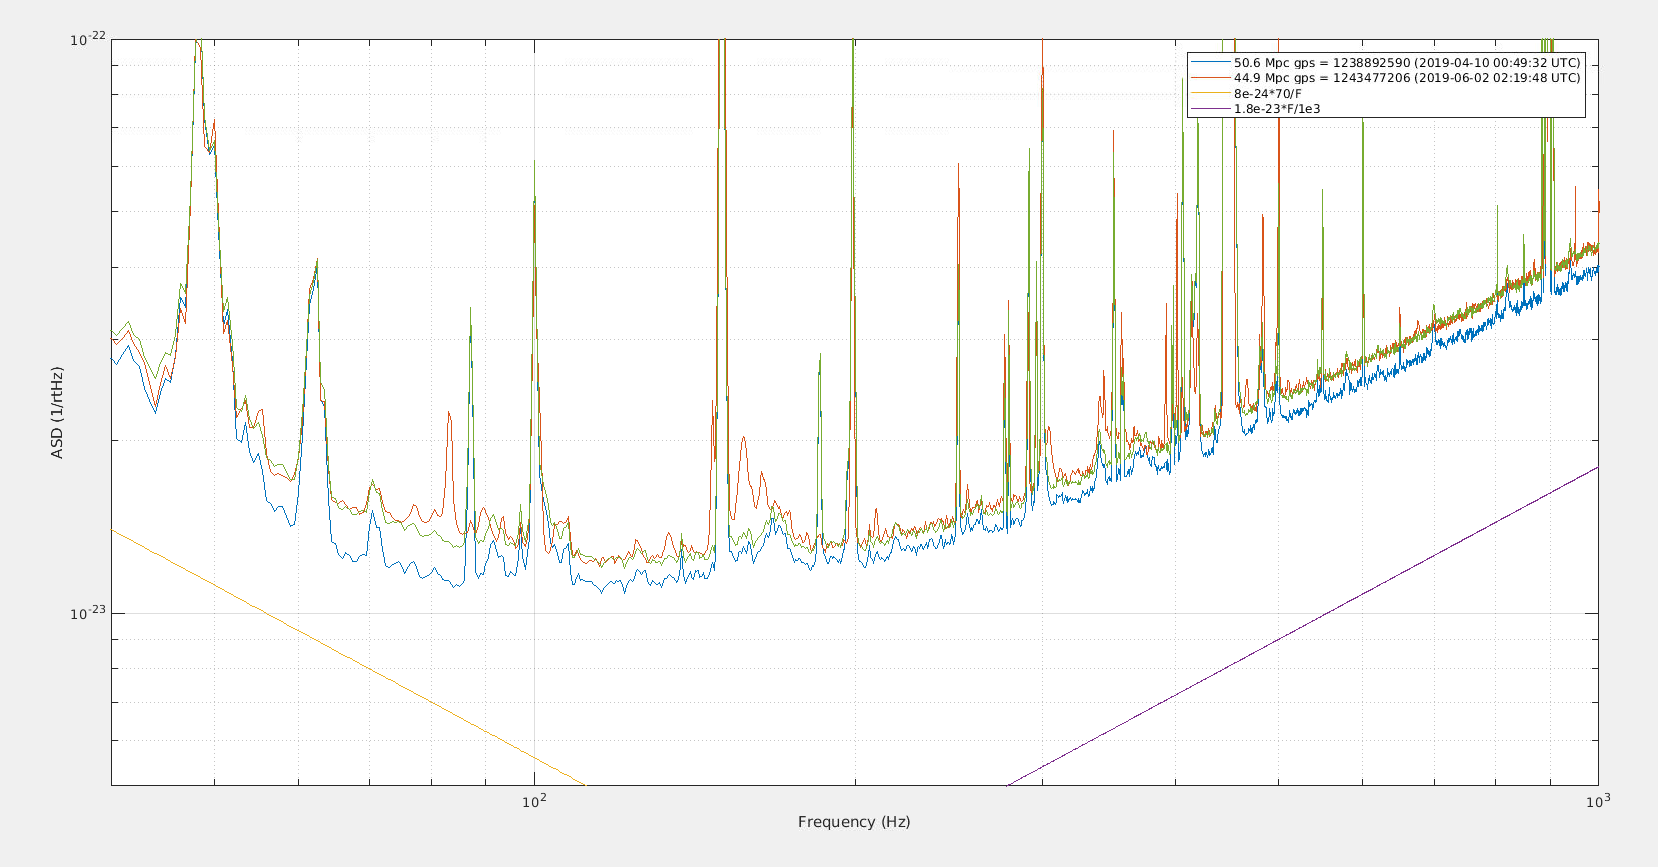
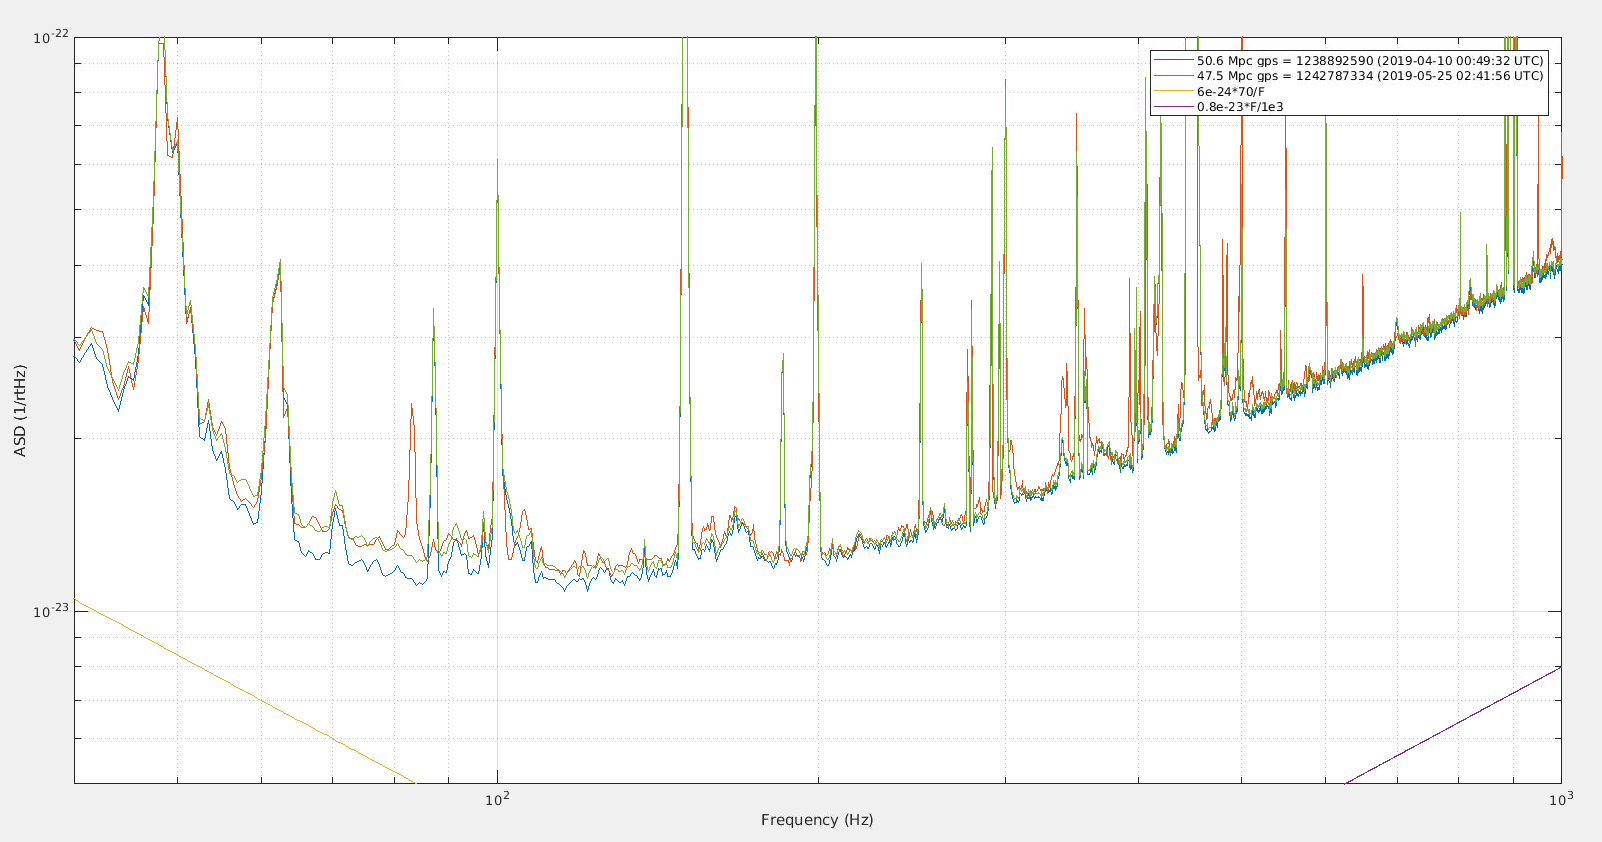
Figure 4 compares April 10 to May 25, and shows that the increased noise contributions were smaller
Figure 6. However, if one looks one week later, for June 9, adding a flat noise instead of a 1/F noise is a better fit to explain the increased noise.
Code for these plots can be found in /users/mwas/detchar/hCompare_20190614
