Reports 1-1 of 1 Clear search Modify search
Detector Characterisation (Spectral lines)
mwas - 15:06 Wednesday 27 February 2019 (45037) Print this report
Wandering line moved to fixed 83Hz?

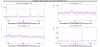
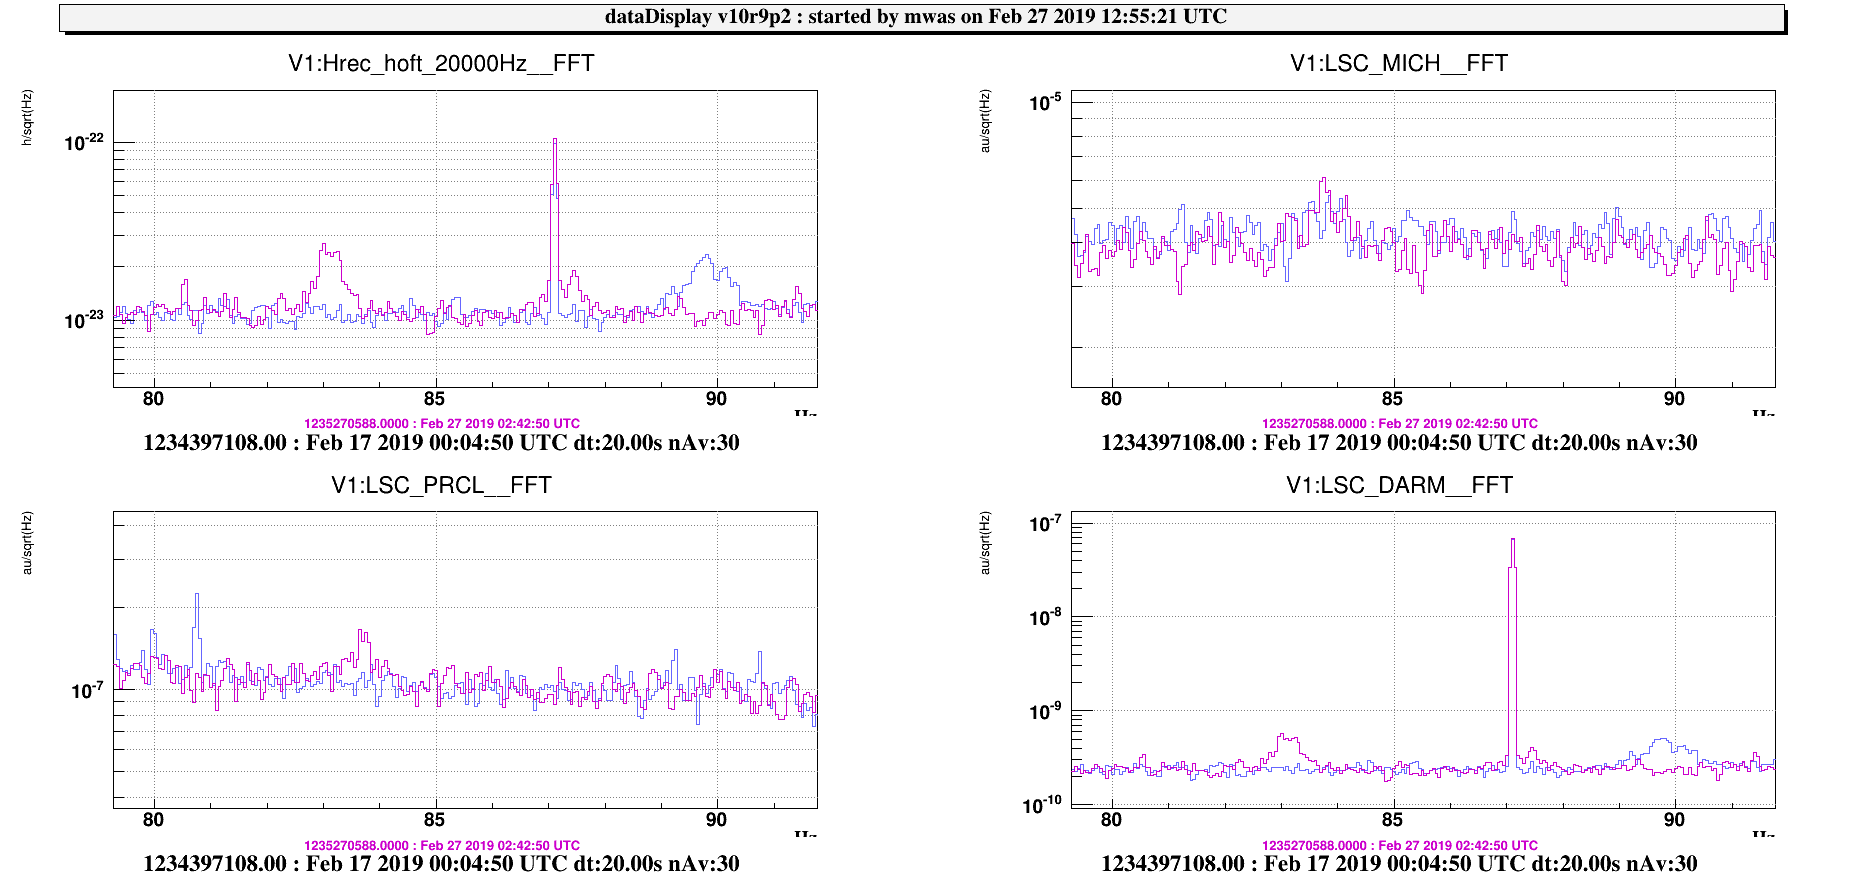
Figure 1. In the h(t) spectrum is a ~1Hz broad line at 83Hz in the spectrum since a week, looking at data before there was a similar structure at around 90Hz.

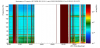
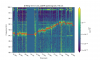
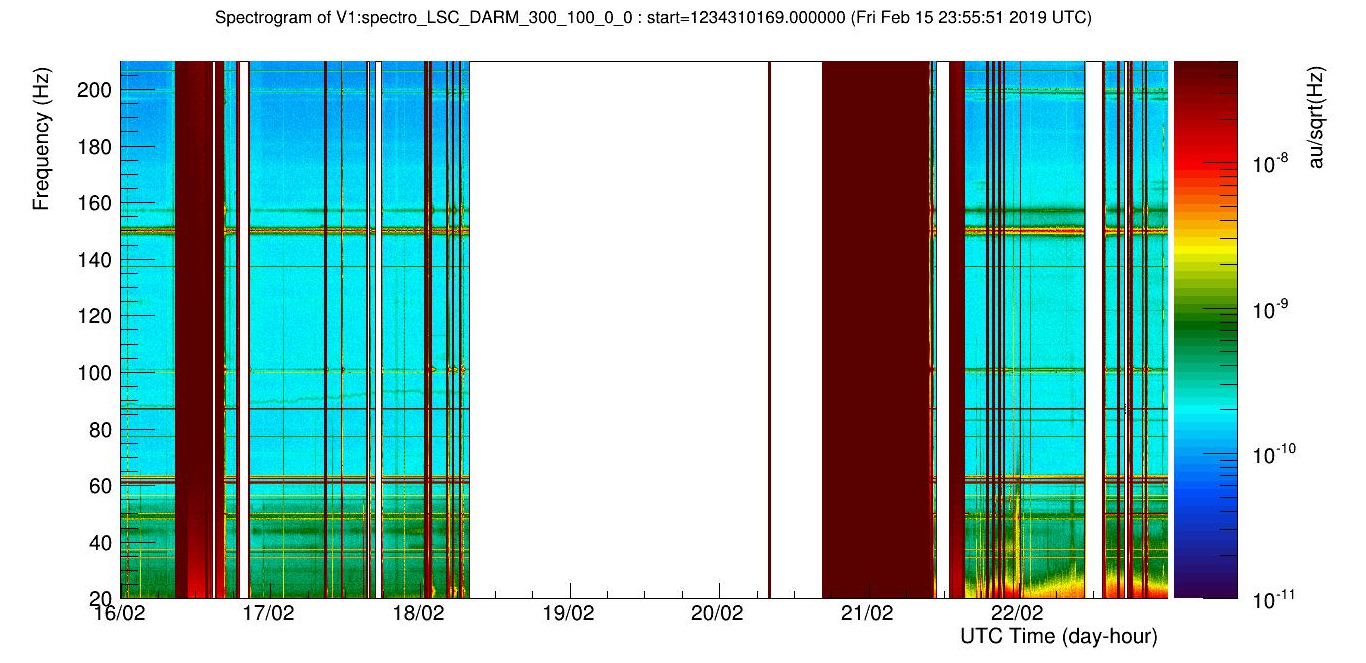
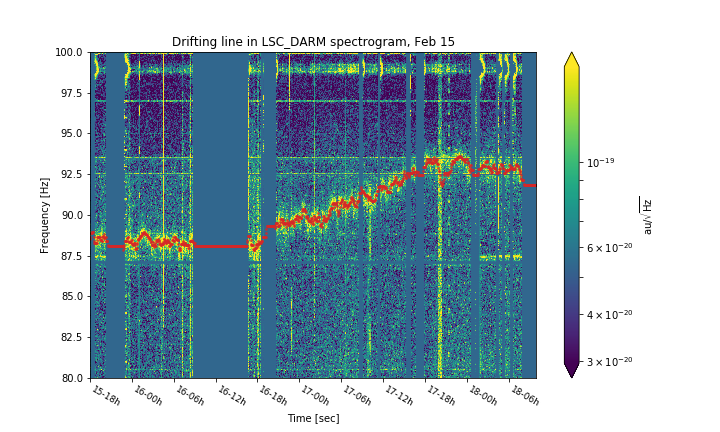
Figure 2. Looking at DARM week long spectrogram, the structure at around 90Hz was a wandering line before Feb 19, and it seems to have changed into a fixed line at 83Hz after Feb 21.

I wonder if this broad line has been known before, and if it is understood why it become fixed.

Images attached to this report
Comments to this report:
direnzo - 20:06 Wednesday 27 February 2019 (45040) Print this report

This wandering line has indeed been previously investigated but it still remains unclear what produces it (steady at 83 Hz), what makes it moveĀ  and what makes it drift up to 100 Hz. Refer to my previous detchar shift report for the non-comprehensive tracking of its behavior since June 2018.
In previous analysis this has been found correlated with many thermometers at the F0 level, like ENV_MC_F0_TE* and ENV_NI_F0_TE*. I will reproduce the same analysis with February 15-18 data and report here.

direnzo - 16:05 Thursday 28 February 2019 (45053) Print this report

I attempted to find some correlation between the time series corresponding to the frequencies of the drifting line and all the available Environmental channels at that gps time.

Figure 1 shows the close up spectrogram of the drifting line between February 15 and 18. Red dots have been obtained tracking the evolution of the maxima of this line. The corresponding time series has been saved in line.txt file (which is a .csv file actually; you might want to replace the file extension).

This series as been studied with NonNA corre, running a brute force cross-correlation analysis with all the available Environmental channels. The twelve most correlatd channels are shown in Figure 2 in red, together with the time series of the wandering line (blue). Despite the values of the correlation coefficients are very high, this is likely to be just by chance, since everything resambling a drift can in principle mimick the same result. Hence, this from its own is not indicative about the possible cause of the wandering line.

Images attached to this comment
Non-image files attached to this comment
Search Help
×

Warning

Error

The present report has been modified outside this window. Please check for its integrity in the main page.

Refreshing this page will move this report into drafts.

×