We started the shift late (after risking to cancel it altogether) due to an issue with the ITF PR alignment.
We initially tried to optimize the squeezed beam alignment into the OMC by dithering both alignment mirrors (at different frequencies, in the Hz to tens of Hz region) and looking for maximum amplitude of the 7MHz beat signal. Unfortunately we experienced frequent unlocks (it is not clear at this stage if they were due to or facilitated by our dithering of the mirrors, or completely unrelated, but see further comments below) which prevented us from effectively carrying out the procedure.
After a number of unlocks successfully recovered automatically, the ITF got stuck trying to relock for many attempts. Observing the sequence we
noticed that the issue was at the PR locking stage: instead of being brought back to a position close to aligned, the PR second reflection
beam would stop far away from the main beam (half a screen on B1p camera) and, consequently, the sequence failed when trying to move
to the next step. The operator realigned PR manually, and after this the ITF was able to lock and remained relatively stable.
Having little time left, we decided to postpone the alignment optimization and concentrate instead on measuring the squeezing level as a function of the coherent control (CC) loop phase. To try to avoid issues related to slow drifts, we decided to make a relatively fast scan: we
manually scanned the CC phase from 0 to (past) 2pi in steps of 0.1 rad, ~30 sec each, without looking at the data in real time. We repeated this procedure twice: once with the dithering of the mirrors still on (by mistake, but notice however that this didn't cause any unlock of the IFO, pointing at some other cause for the previous set of unlocks) and once with the dithering off.
Both scans were then analyzed with a matlab script that recovers data from the CC-phase and DARM channels and plots the DARM band limited RMS
in the 2600-2800 Hz band versus the phase value. The result is normalized by the BLRMS when which SQZ shutter closed, to express the
result in dB of squeezing vs CC phase. The script (and associated function) and results are attached.
Data taken with modulation on seem to be of slighter worse quality, and are probably not worth analyzing too much. There are instead couple of key facts about the data taken with modulation off:
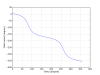
- there is a smooth, apparently repeatable variation of BLRMS with CC phase, as expected
- in this particular instance, we seem to get to a level of squeezing of about 1 dB for optimum phase
- the range is indeed slightly increase wrt the "shutter closed" (i.e. no squeezing) condition
- the shape of the squeezing level vs phase curve is unexpected (one would expect a smooth maximum, corresponding to maximally misaligned squeezing ellipse, and a sharp minimum, since squeezing is very sensitive to the correct alignment of the squeezing ellipse). The reason for this is still under investigation.
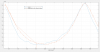
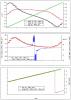
Figure 1, shows the DARM BLRMS vs phase in blue, with this not understood behavior where there is a wide valley and sharp valley while the opposite is expected from theory.
In red is shown SQZ_B1_PD1_7MHz_Q, scaled to match the BLRMS curve. The two have a very similar behavior, so there might be the same reason to explain both curves.
That the 7MHz demodulated signal does not include only the squeezing phase but has also the signal for some other degree of freedom, which would distort the relation between I, Q and phase.
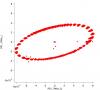
On figure 5.6 the demodulation signal I and Q are shown, as the squeezing phase is rotated. The two signals don't make a circle but an ellipse. As a consequence the relation between demodulation phase and squeezing phase is not linear (but it still montonic).
As an example if the error signal form an ellipse as a function of squeezing phase angle theta_sqz (shown on figure 1)
I = 2*cos(theta_sqz)
Q = sin(theta_sqz)
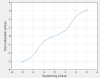
then the measured angle in the demodulation corresponds to
theta_demod = atan2(I, Q)
The relation between theta_demod and theta_sqz is shown on figure 2, the location of O and +/-pi phase agree, but in between the relation is non-linear.
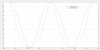
Figure 3, shows the magnitude of the ellipse sqrt(I.^2 + Q.^2), which should correspond at the same time to a fiducial squeezed noise level and to the magnitude of the quadrature of the error signal used for the squeezing phase loop.
In blue the curve is shown as a function of theta_sqz and in red as a function of theta_demod. We retrieve that for theta_sqz the maximum is wide and the minimum is narrow, but for theta_demod the opposite is true the minimum is wide and the maximum is narrow.
Someone who actually understand the squeezing phase error signal needs to check and confirm that the derivation above is correct.
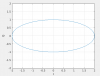
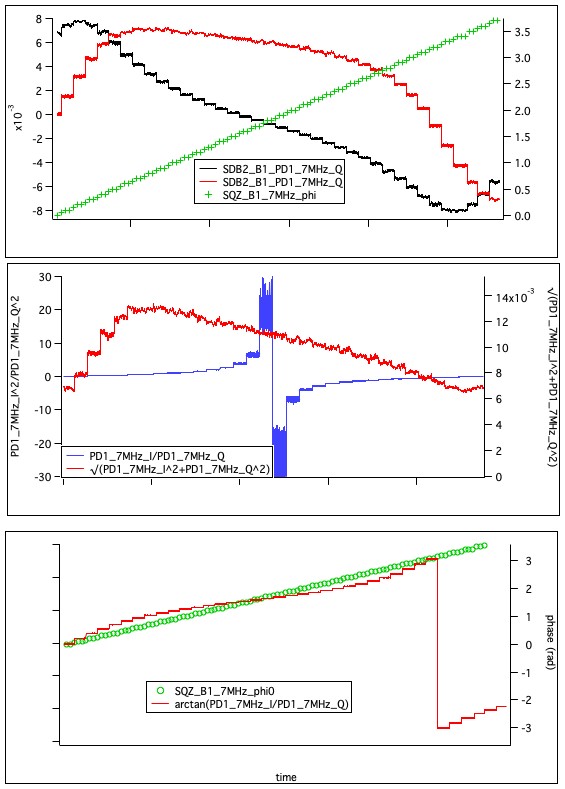
I looks like our case is different. Indeed the two measured quadratures lay on an ellipse, see fig. 1, and by the way the ellipse is slightly rotated with respect to the axes.
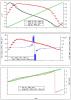
On the other hand the two demodulation quadratures of B1 at 7 MHz do not have sinusoidal shape, see fig. 2 fist plot. But the ratio of the two quadratures has the exact shape of the tangent of the demodulation phase, see fig. 2 second plot. Indeed, the arctan of this ratio is exactly equal to the demodulation phase, see fig2 third plot.
If we scale one of the two quadratures by a factor, e.g. we multiply the I quadrature by 2 to reach the same amplitude of the Q quadrature, we indeed get a distorted phase from the arctan of the ratio of the quadratures, see fig. 3.
So it seem that the 7 MHz demodulation is correct. The effect can be explained with a change of the magnitude of the 7 MHz with the demodulation phase, which is apparent in fig. 2 second plot.
The reason for the changing magnitude, and the relation with the measured squeezing are currently under investigation.
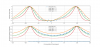
The shape of the measured squeezing versus demodulation phase, as well as the shape of the B1 7 MHz magnitude versus demodulation phase, can be explained by considering that the output of the squeezer contains two sidebands at +/-7MHz from the carrier with unequal amplidudes, see note in attachment.
The first figure in attachment shows the comparison of measured data with such model, for three different values of the nonlinear gain. Data are in good agreement with g=3, which is close to the most plausible value according to the AEI team.
The second picture shows the resulting nonlinear relation between the demodulation (measured) phase at 7 MHz and the phase of the coherent control laser.