Please take care that the input bench (fully fibered) is installed behind the racks in DAQ room with laser on
Another optical setup is located close to the optical telecom fiber rack at Nord End building.
Even if the laser source is all fibered please take care of this setup.
The laser has been switched off on Dec 14 (2018) at 14:33 UTC after 9.88 days of data taking. However it is still in the DAQ room.
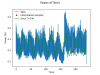
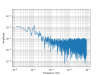
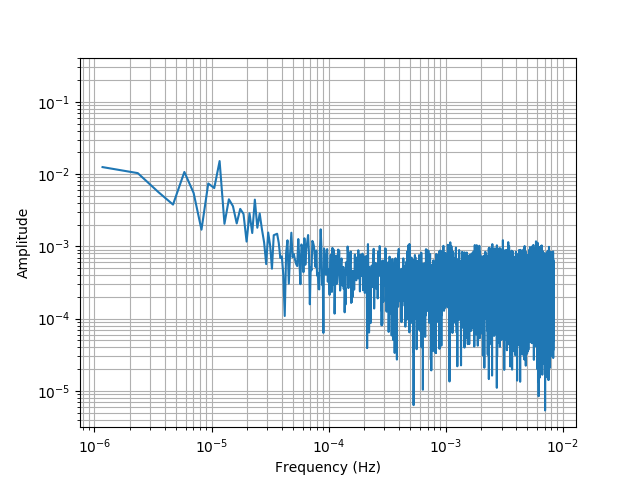
The attached files show the power vs time (1st fig) and the fft (2nd fig).
I've superimposed a sinus with a period of 24 hours to fig 1 to highlight the day/night variations. On the fft there is a peak at 1.16x10⁻⁵ Hz (24 hour period), a smaller one at 2.3x10⁻⁵ Hz (12 hour period) and another small one at 8.7x10⁻⁵ Hz (3.2 hour period). The data taking could have been a little longer to make the 24H period peak more visible.
162 hours after the beginning the power increased a bit (mode jump ?) on Dec 10 around 1:00 pm UTC. The overall mean value is 0.24 W with a standard deviation of 0.065 W. The minimum values are reached around 4:00 am and the maximum values around 3:00 pm.
The red dots on fig 1 show missing samples in the channel, they are present from Dec 12 16:34 UTC to Dec 12 18:01 UTC. To replace them I've done a basic interpolation just by calculating the current mean value of the data set.