One of the source of coherent noise between PDs is the B4 56MHz sensing noise introduce by the SSFS loop (while removing laser frequency noise).
In h(t) this B4 56MHz noise is subtracted during the reconstruction using B2 8MHz. In a similar manner the B4 56MHz sensing noise can be subtracted from each B1 PD separately before doing the cross correlation.
An issue is to calibrate B1 PD spectrum into h(t), I did this empirically measuring the transfer function between B1 and h(t). This works well only at the frequencies where h(t) is not subtracting something from B1.
I considered here two time periods of 20 minutes each:
Jun 25 2018 19:20:00 - when we had a 35Mpc range
Oct 23 2018 02:40:00 - when the CMRF was very good, so almost no B4 56MHz sensing noise coupling in
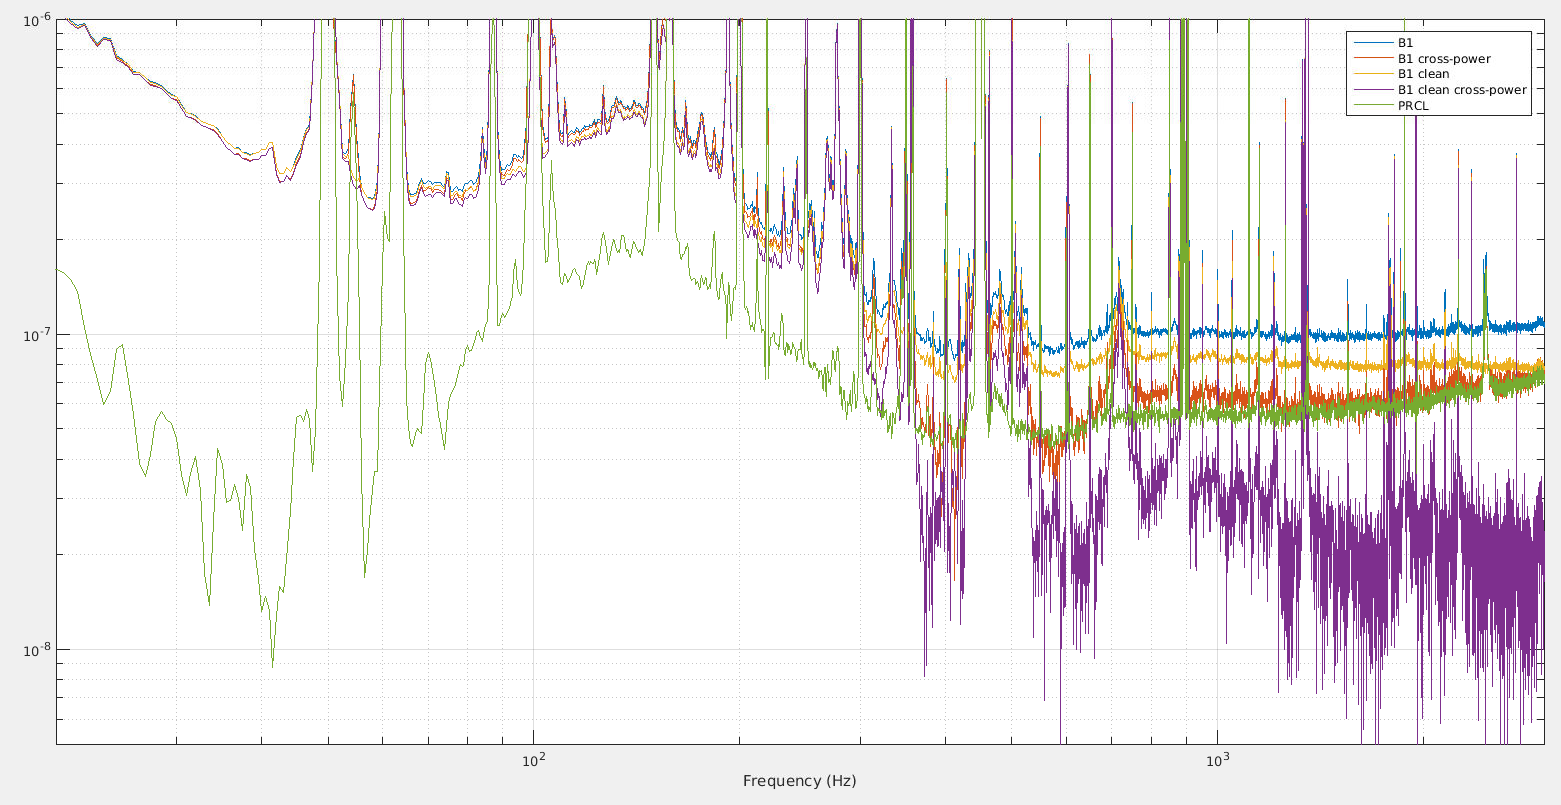
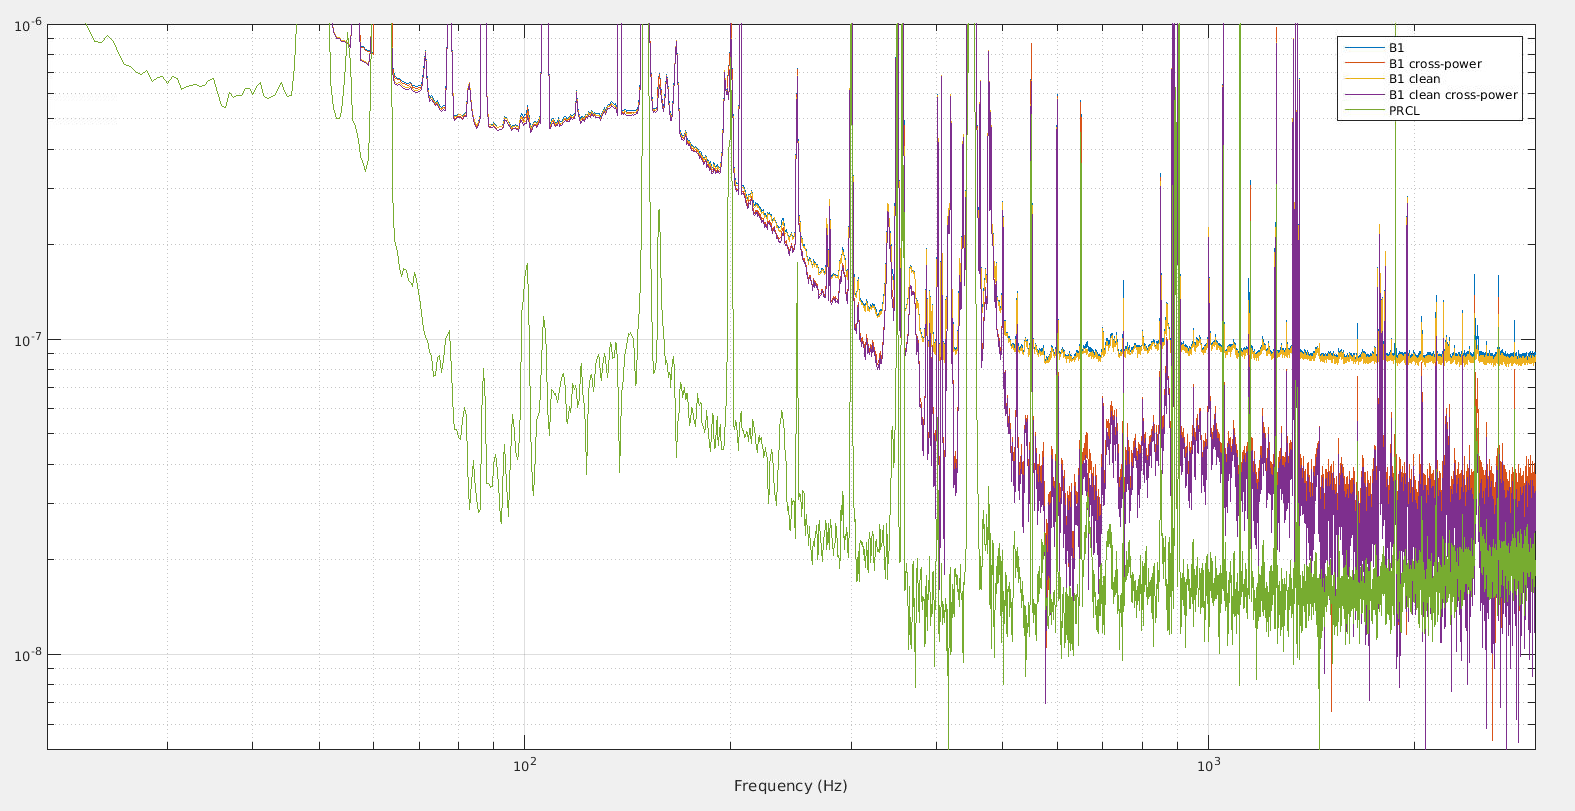
Figure 1 shows B1 spectra in June and Figure 2 B1 spectra in October.
The raw B1 spectrum is in blue, in red is the cross spectrum between the two PDs, in yellow is the B1 spectrum after subtracting B4 56MHz noise, in purple the B1 cross spectrum after subtracting B4 56MHz noise from each PD, and finally in green is the spectrum of the B4 56MHz noise being subtracted.
In June we can see that the cross spectrum is well explained by the B4 56MHz noise, and that after subtraction the cross spectrum goes down by a factor 2.
In October the contribution of B4 56MHz noise (green curve) is 3-4 times lower, so the subtractions don't have much impact. There is much less structure in the cross spectrum, but there is a broad bump around 900Hz which appears to be 50% higher, and is visible also in the raw B1 spectrum, as an increase of ~5% of the noise level.
A surprising thing is that the cross power spectrum is not much below the B1 spectrum in the 200-300Hz range, even though the sensitivity is expected to be dominated by shot noise in that region.
An explanation could be that the noise there is clearly above the PD shot noise, and it the PD shot noise being reinjected by the DARM loop into the interferometer. This doesn't change the sensitivity, but make the noise coherent between the PDs.
An interesting test would be lower the DARM loop gain by a factor 2 for ~20 minutes in LOW NOISE 3 at a time when the CMRF is very good (no step visible in h(t) at ~3.5kHz).
Looking at DARM loop measurements, the loop should be also stable with a gain lowered by a factor 2.
This should allow to see underneath the shot noise in 200-300Hz frequency range.
We can then calibrate these cross spectra in h(t).
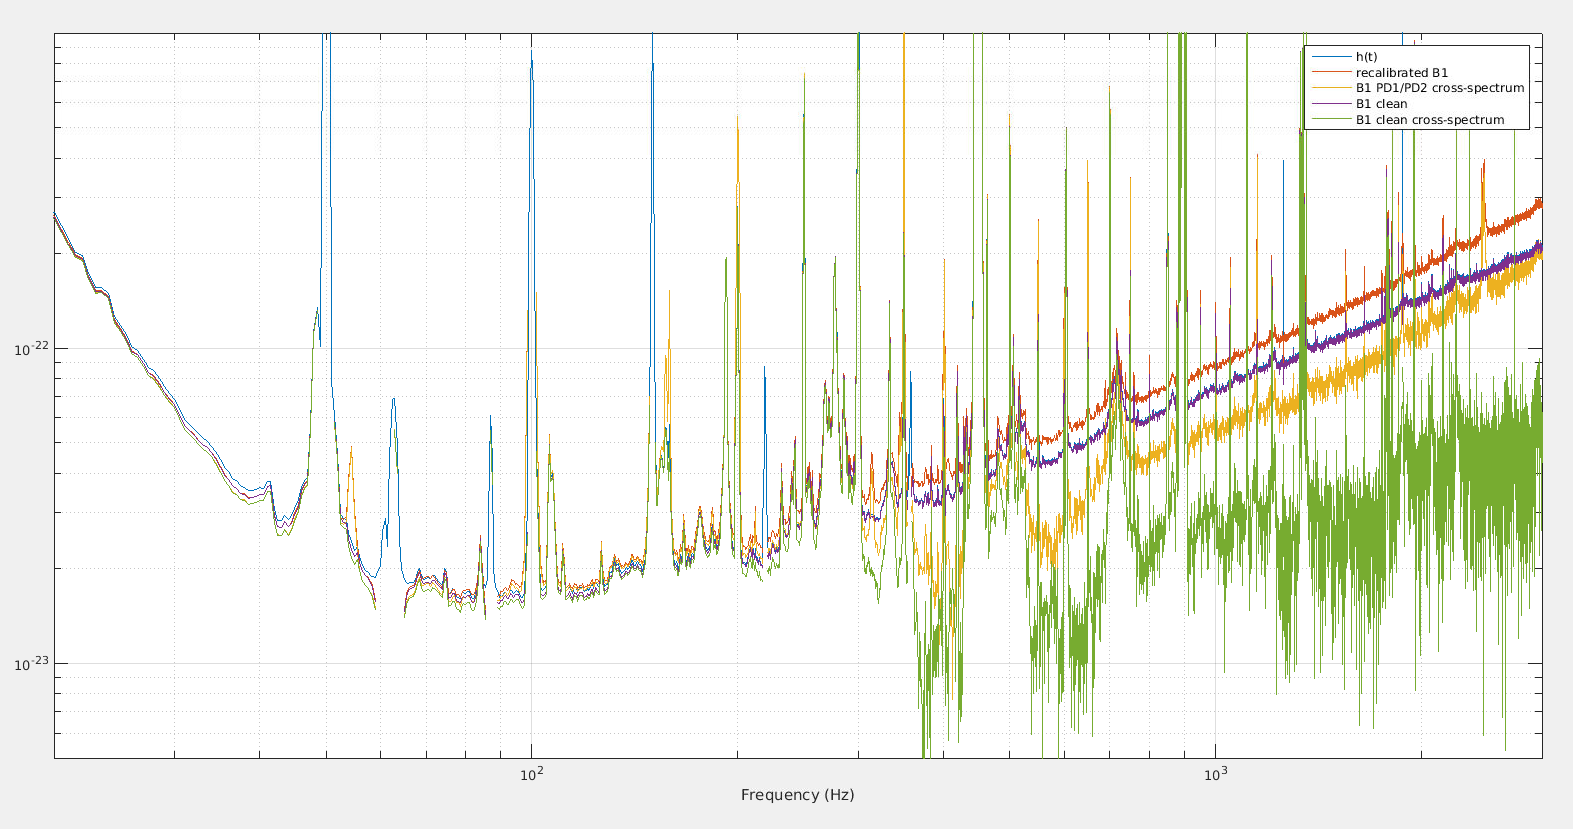
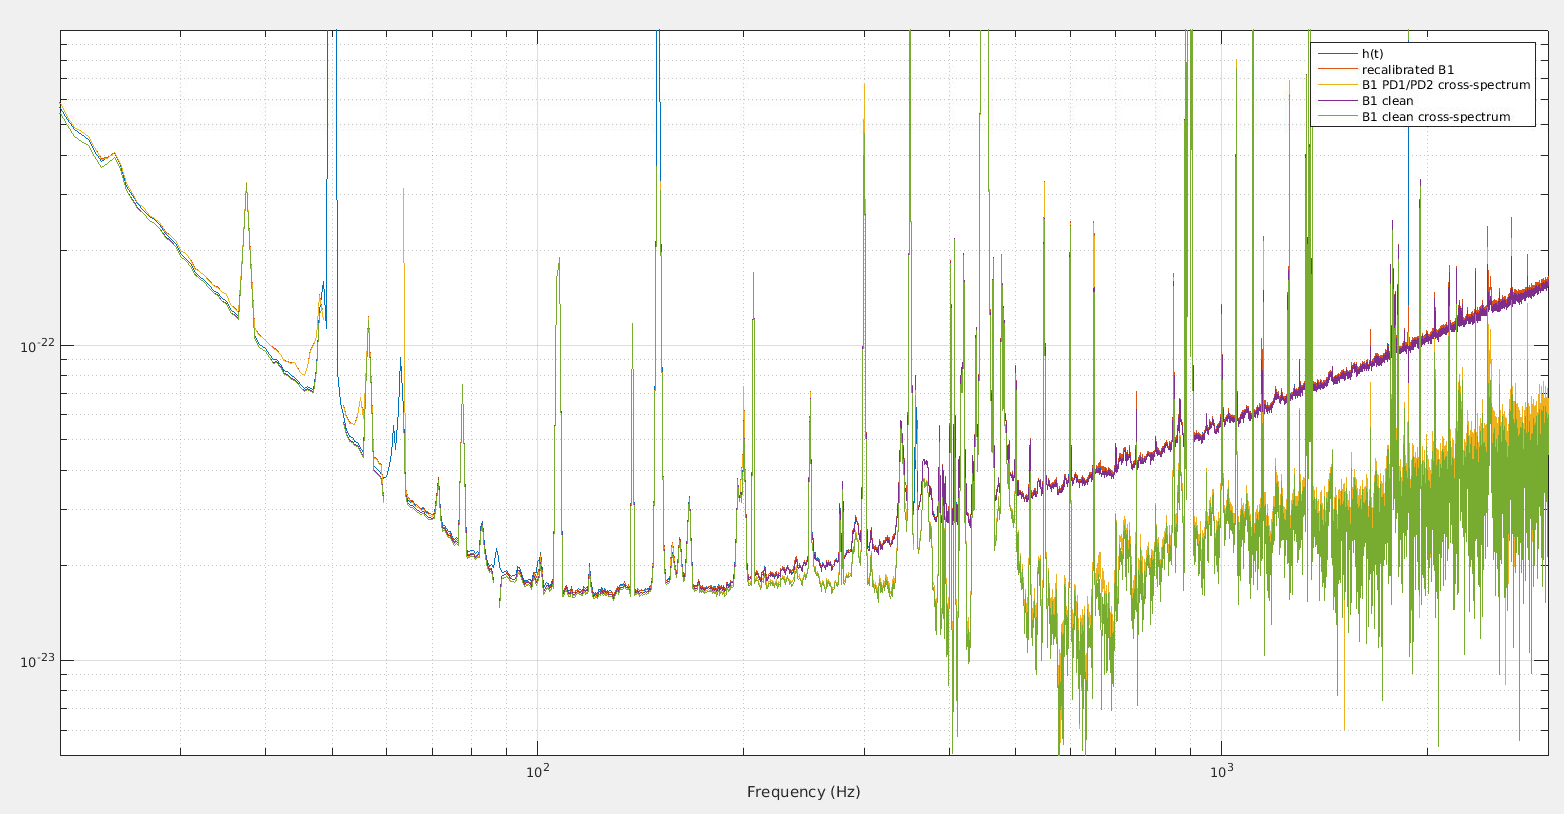
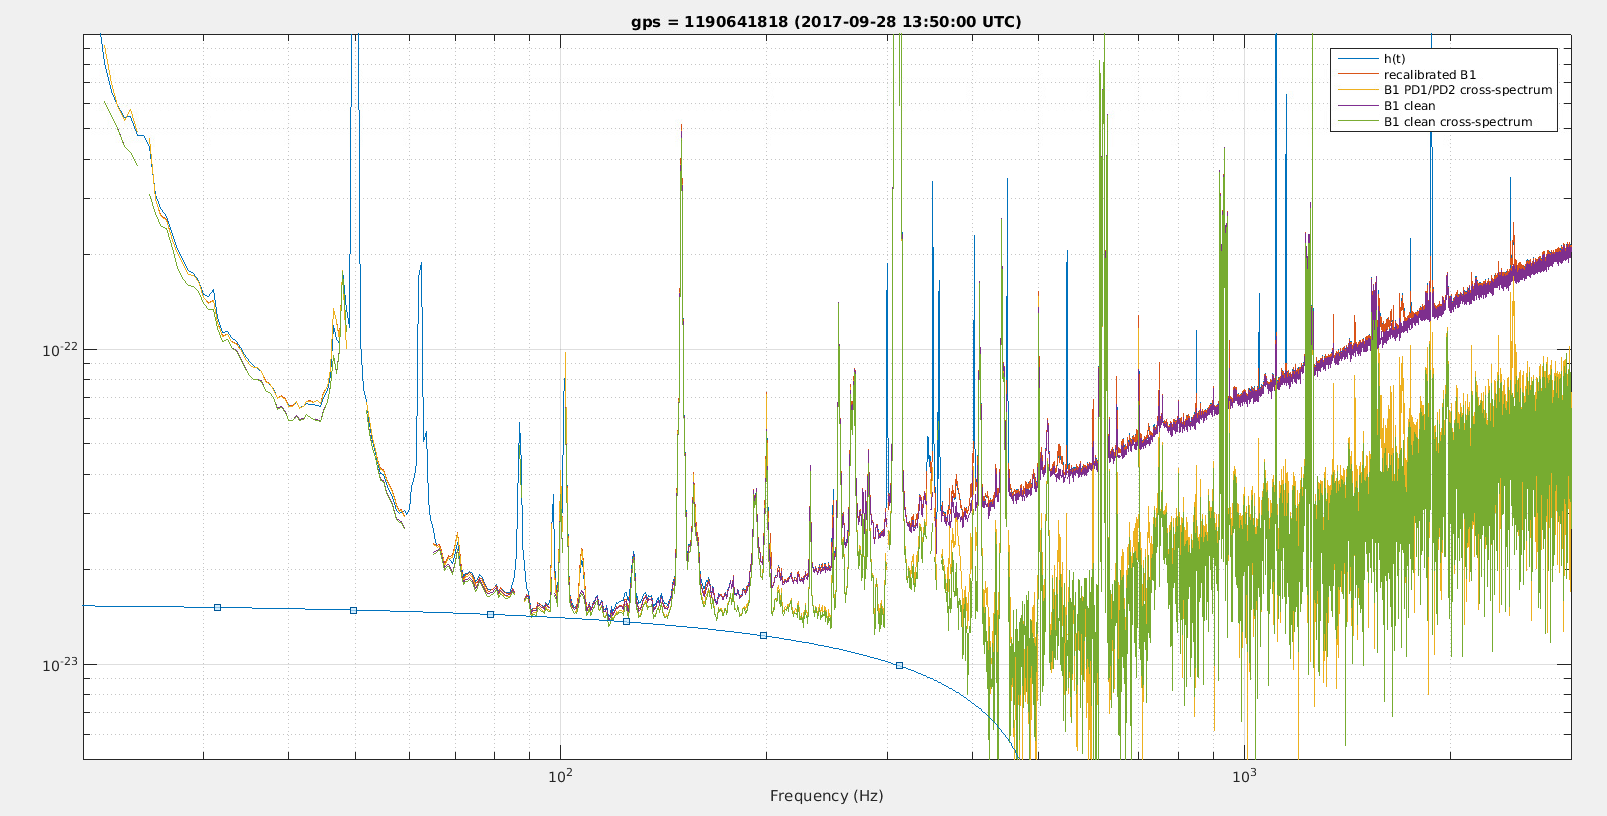
Figure 3 shows June and Figure 4 October. The blue curve is h(t), the red curve is the raw B1 spectrum calibrated into h(t), and yellow curve is the B1 cross spectrum calibrated in h(t), in purple B1 after subtracting B4 56MHz noise calibrated in h(t) and in green B1 cross spectrum after subtracting B4 56MHz noise from each PD and calibrating into h(t)
In June we can see that the B1 recalibrated data is above h(t) as expected because it doesn't have the B4 56Mhz subtraction, but the cleaned B1 data matches very well h(t) (except at some lines). The cleaned cross spectrum reaches almost down to 1e-23 around 400Hz and 600Hz, and the flat noise looks more like a wide bump at 200-300Hz, with a sharp cut-off at ~350Hz.
In October the flat noise look flatter but still with a cut-off at ~350Hz, and reaching down to 1e-23 at 400Hz and 600-700Hz.
The wide bump around 900Hz is actually at the same height in June and October, it is the shot noise calibrated into h(t) that moved in between. It is not visible on the uncalibrated PD spectra as the power on the PD is the same, but it corresponds to a different dark fringe offset. So the 900Hz bump is more visible in October, because the sensitivity improved from 7e-23 to 5e-23 around 900Hz.
The 350Hz cut-off is at the same frequency as where the B1 spectrum reaches shot noise, so DARM loop feedback becomes negligible. It would be interesting to see if lowering the DARM loop gain by a factor 2 moves this cut-off to lower frequency.
The code for these plots is located in /users/mwas/detchar/sqzForecast_20181026

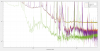


Figure 1 shows a projection for a gas with an atomic mass around 1000, a pressure of 1e-9 mbar and a polarizability 8 times higher than di-oxygen.
The larger atomic mass brings the cut-off to lower frequencies (for O2, N2 and H2O the cut-off is around 1.5kHz).
It seems unlikely to have such heavy hydrocarbons in the arms, but it would be good to make sure by doing a RGA analysis.

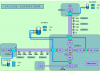
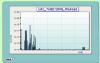
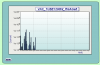
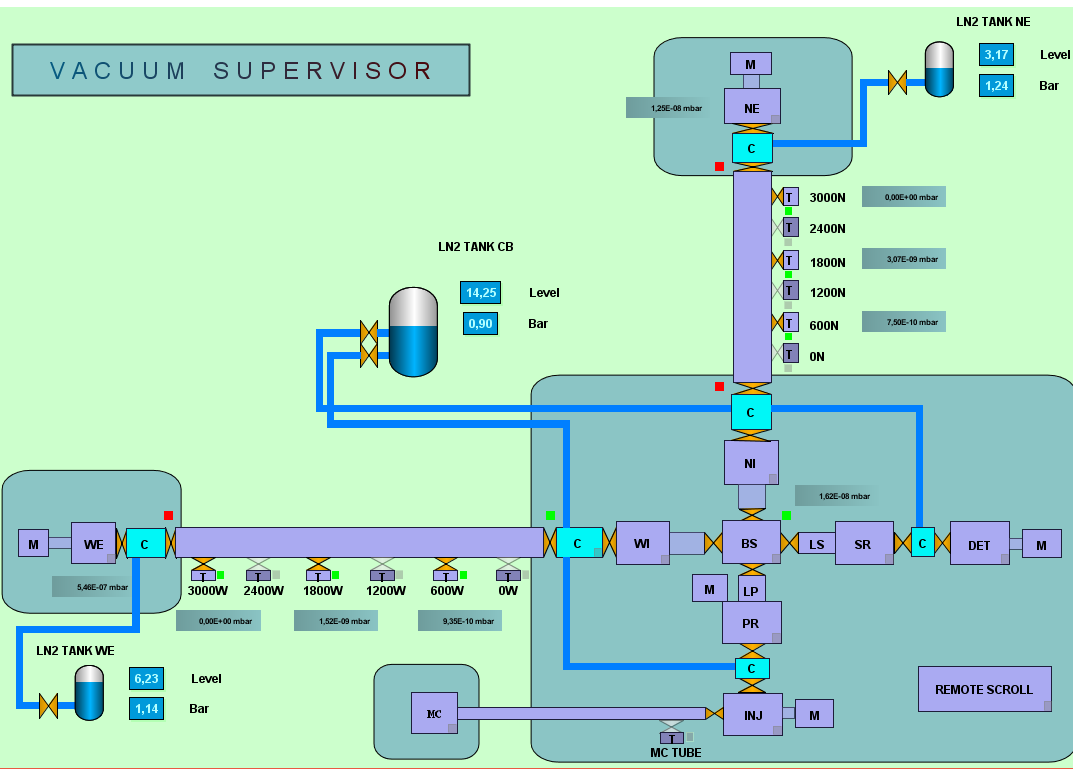
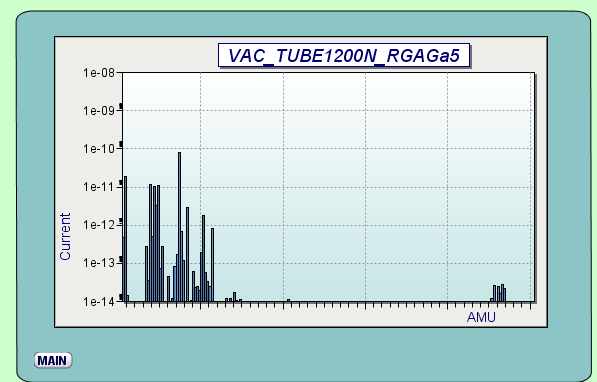
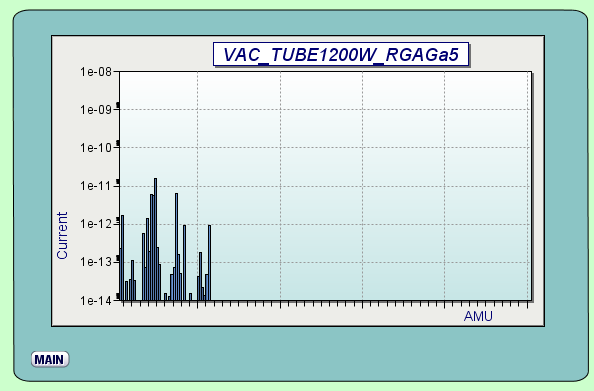
Here is a RGA test run today morning, at the middle stations of Narm and Warm.
In the spectra, the Y axis is proportional to the pressure (uncal, [a.u.]), and the X axis reports the mass/charge ratio of the ionized molecules fragments.
The hydrocarbon signature (fragments of amu/charge > 50) results approximately 3 orders of magnitude below the principal gas species (water, air,hydrogen, with a total pressure within a few E-9 mbar ).
Such a contamination is not evident.
Note 1: while the mass range of the RGA is limited to 200 amu, a large organics with weight > 200 is expected to produce several fragments with peaks clusters at 14amu interval 55,57,...
Note 2: some extra air is present in the spectra, this is also because the recovery after the partial venting tests