The algorithm to extract the arm cavity Gouy phase has been refined, and processing data taken on June 25th, the cavity G-factor has been extracted. These data refer to the arm cavities BEFORE switching on the RHs, so the measurement will be repeated in the current configuration in order to extract the new cavity parameters. Notice that these measurements were taken after the ITF had been unlocked for about 1.5h with long locks in dark fringe were performed earlier, meaning that the mirrors were not hot.
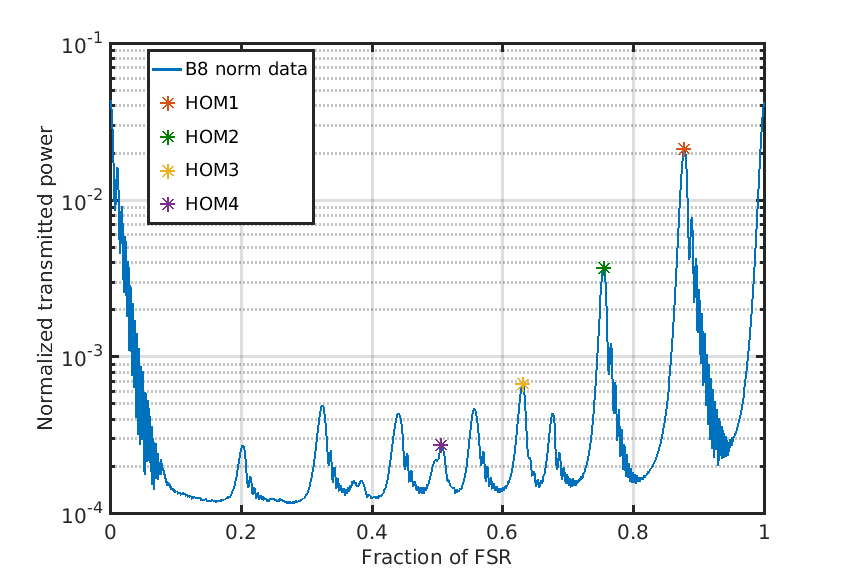
For every analized FSR, the Gouy phase shift has been extracted from each cavity high order mode up until order 4. In general, due to their different transversal extent, each HOMs can "see" a different average Radius of Curvature (RoC) of the mirror. With this in mind, the value of the Gouy phase from the position of each HOM has been extracted.
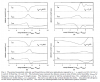
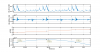
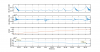
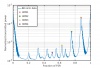
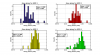
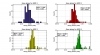
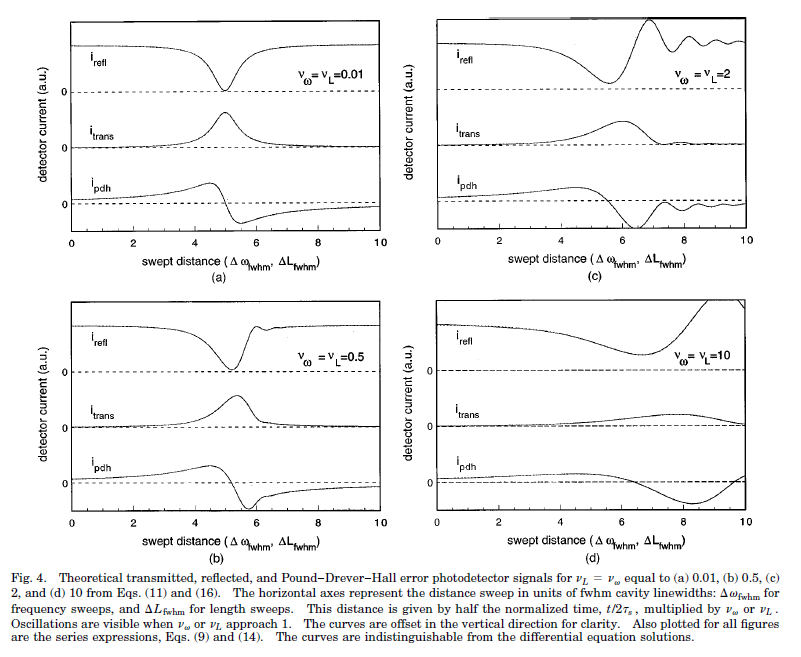
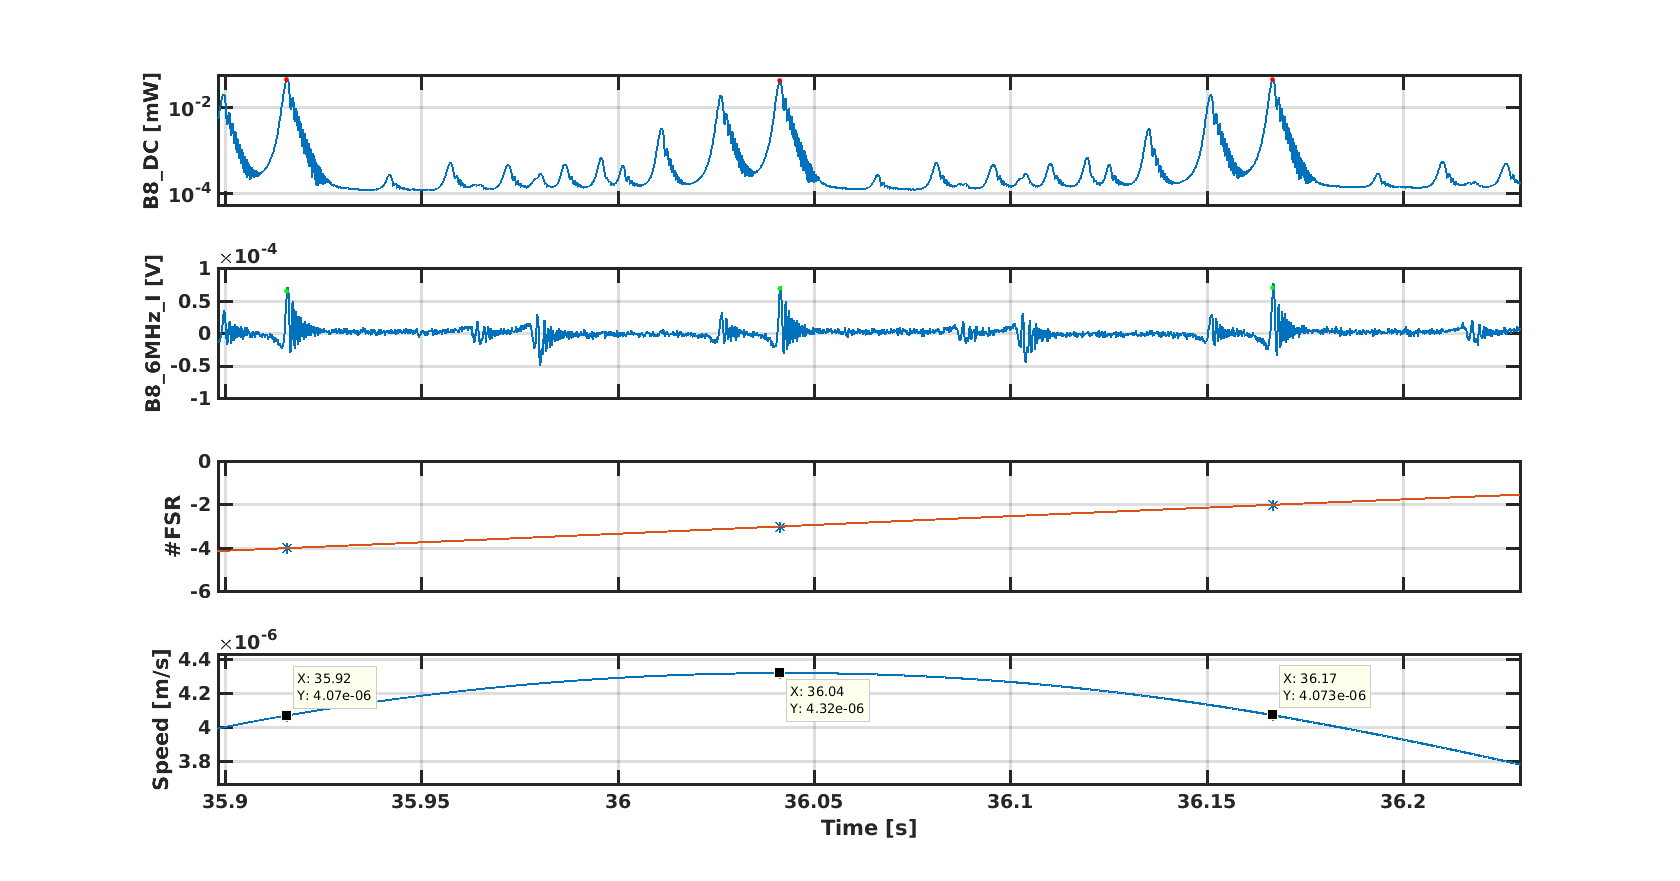
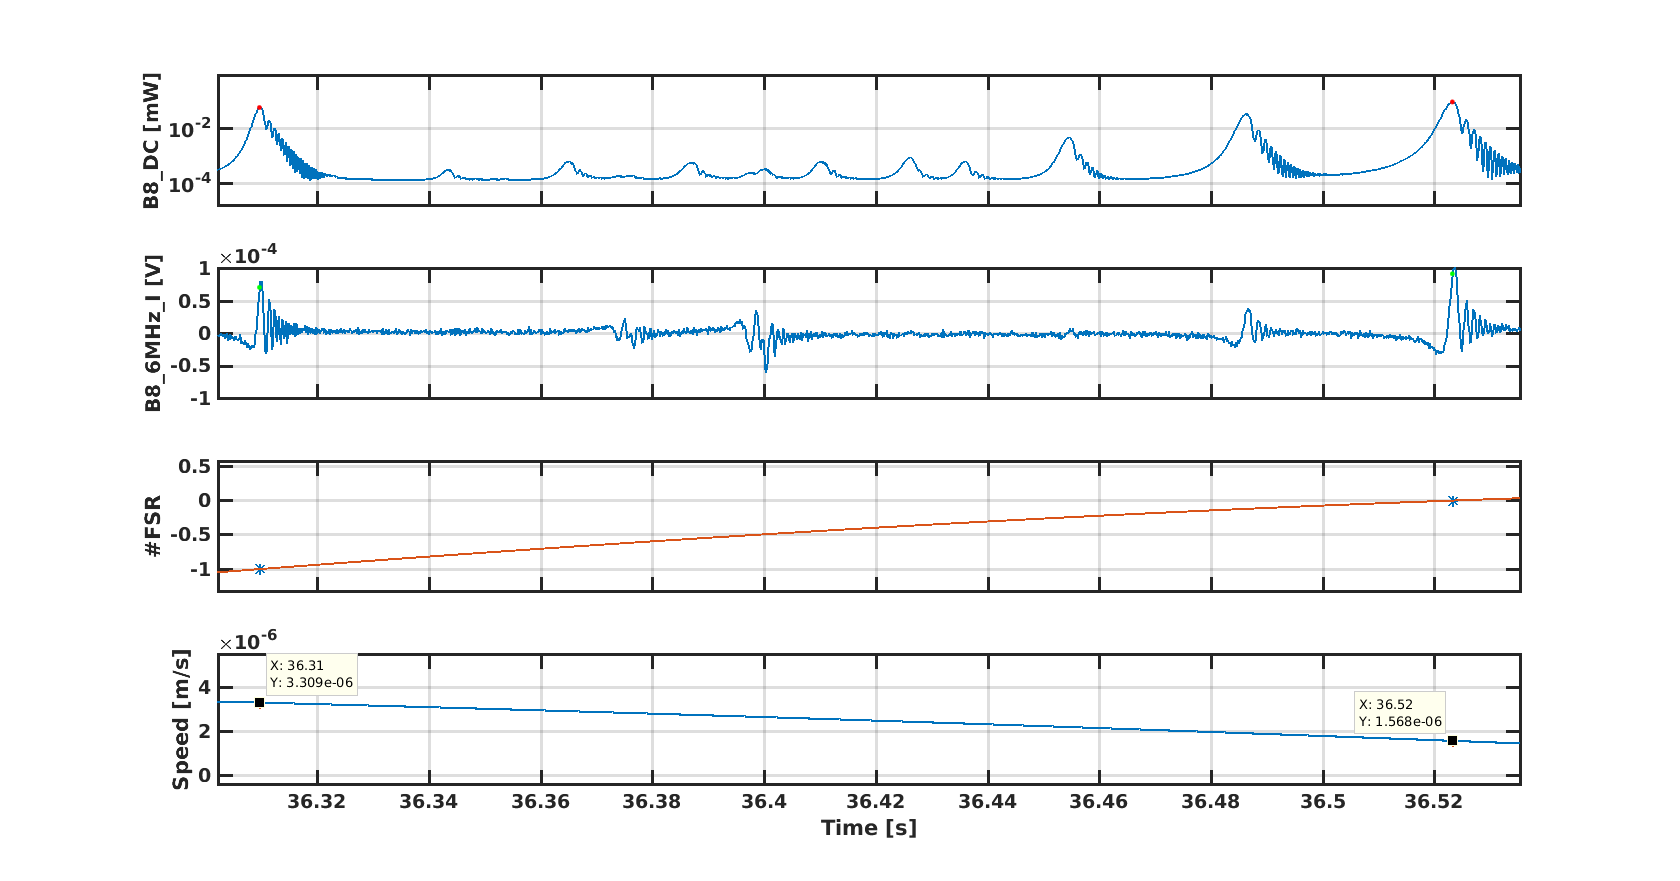
One of the difficulties of the data processing is the presence of the ringing, a dynamical effect which arises for our arm cavities when they cross the resonances at a speed higher than ~0.3 um/s. Because of this effect, the peak position is right-shifted with respect to the one which is not affected by ringing (figure 1 - from [1]). However, if the cavity speed doesn't vary too much within the same FSR, the meansurement of the Gouy phase can be considered to be reliable: in figure 2, for instance, a couple of FSR are shown where the speed spread varies by less than 0.4um/s, while in figure 3 the speed spread is ~1.7um/s, which also translate in a different ringing for the different peaks. This kind of data could be included if the ringing shift is analytically compensated. However, to keep the analysis as simple as possible, they have been discarded.
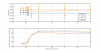
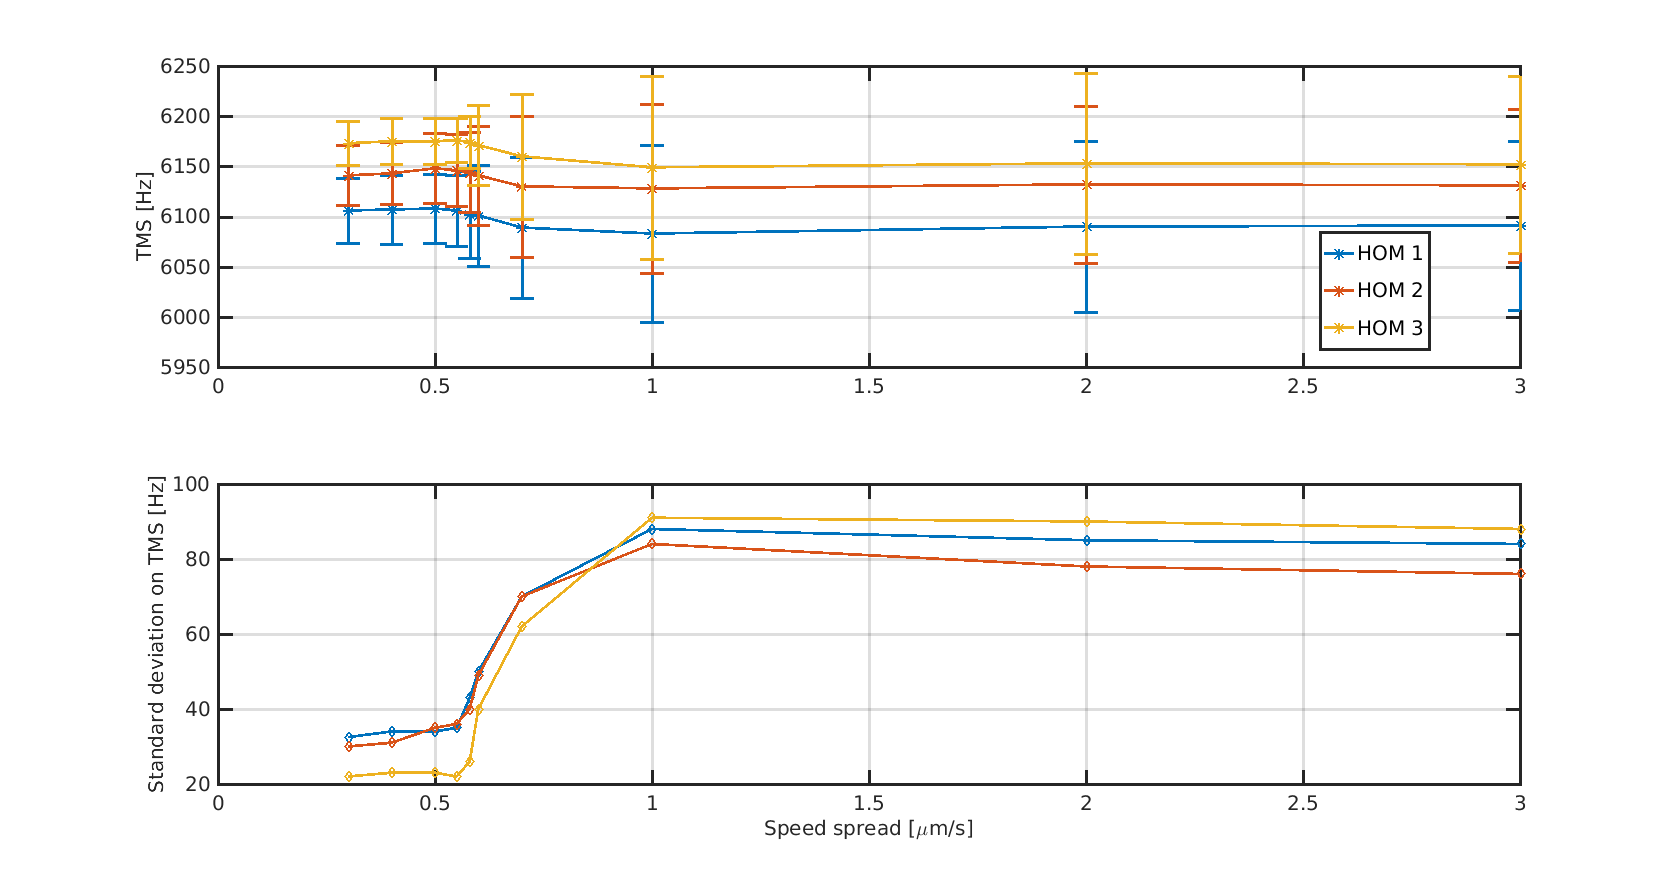
In order to define the maximum allowed speed spread within the same FSR, the cutoff value has been varied from 0.3 um/s up to 3 um/s, and the frequency spacing has been evaluated in all of these cases (figure 4). After 0.55 um/s the error bars started becoming pretty large, therefore 0.55 um/s was chosen as maximum allowed value.
The data processing consists of the following steps:
1 - The whole data set lasting about 150s is divided in FSR. This allows to recostruct the cavity motion and velocity.
2 - Among all the FSRs, only the once whose speed varies less than 0.55 um/s within the same FSR are picked up.
3 - From each of the FSRs, the positions of the first 4 HOMs are identified by using the demodulated signal (as explained in 41721): this gives the cavity Gouy phase for each of them, whose value is reported in figures 6 for the North arm and 7 for the West arm.
The nominal Gouy phase of the arm cavities as computed for the nominal RoC (RoC_In = 1424.6m and RoC_End_N = 1695m, RoC_End_W = 1696m) result to be:
Gouy_North = 0.3960 and Gouy_West = 0.3976
The Gouy phases extracted with the described analysis are shown in the following table:
|
|
HOM1 |
HOM2 |
HOM3 |
HOM4 |
Expected |
North arm |
0.385+/-0.004 |
0.387+/-0.003 |
0.388+/-0.002 |
0.389+/-0.003 |
0.396 |
West arm |
0.384+/-0.003 |
0.385+/-0.002 |
0.387+/-0.002 |
0.388+/-0.002 |
0.398 |
These values of the Gouy phase suggest an effective average Radius of Curvature longer than expected for both the arms. Further investigations will be performed in order to exclude any systematic effect.
--------------------------------------------------------------------------------------------------------------------------------------------------------------------------------------------------------------------------------------------------------------------------
[1] - M. Lawrence, B. Willke, M. Husman, E. Gustafson, and R. Byer, “Dynamic response of a Fabry-Perot interferometer,” Journal of Optical Society of America B, vol. 16, pp. 523–532, 1999.