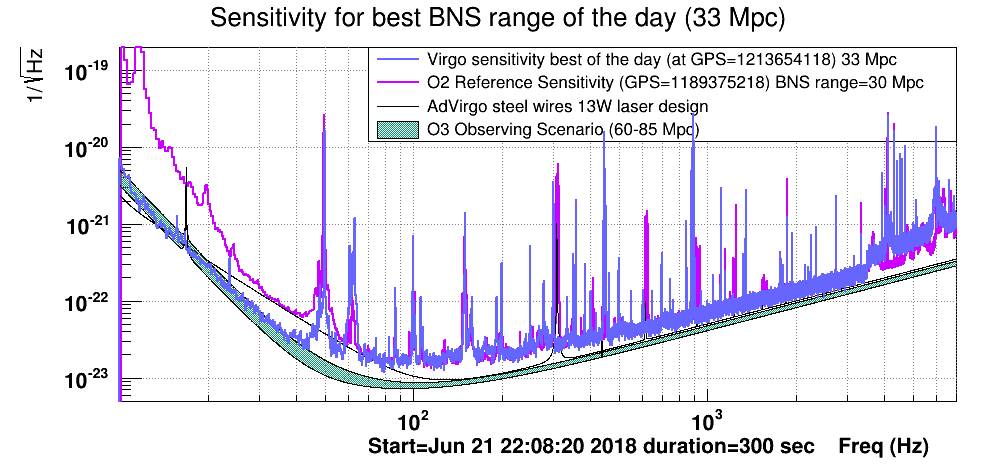
On Jun 21, after the reduction of MICH noise, the curve was very clean at low frequency up to 40 Hz, giving the impression to have a constant slope in log scale. In fig 1 the best curve taken from VIM is reported. The BNS range was 33 Mpc.
I did the exercise to reproduce the floor of the curve superposing three simple curves (no physical model, just playing with the curves):
- LFN = 1e-17/f^3.5 matching the low frequency region;
- HFN = 7e-26*(f+55) matching the high frequency region;
- MFN = 1.1e-22/f^0.5 filling the intermediate frequency region (the slope is set at an arbitrary value, no fitting algorithm has been used).
The BNS range calculated using the total noise is 42 Mpc (please check if the calculation is correct).