In particular:
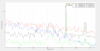
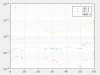
165.3 Hz: SDB1_BR_H - SDB1_OMC2, figure 1
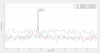
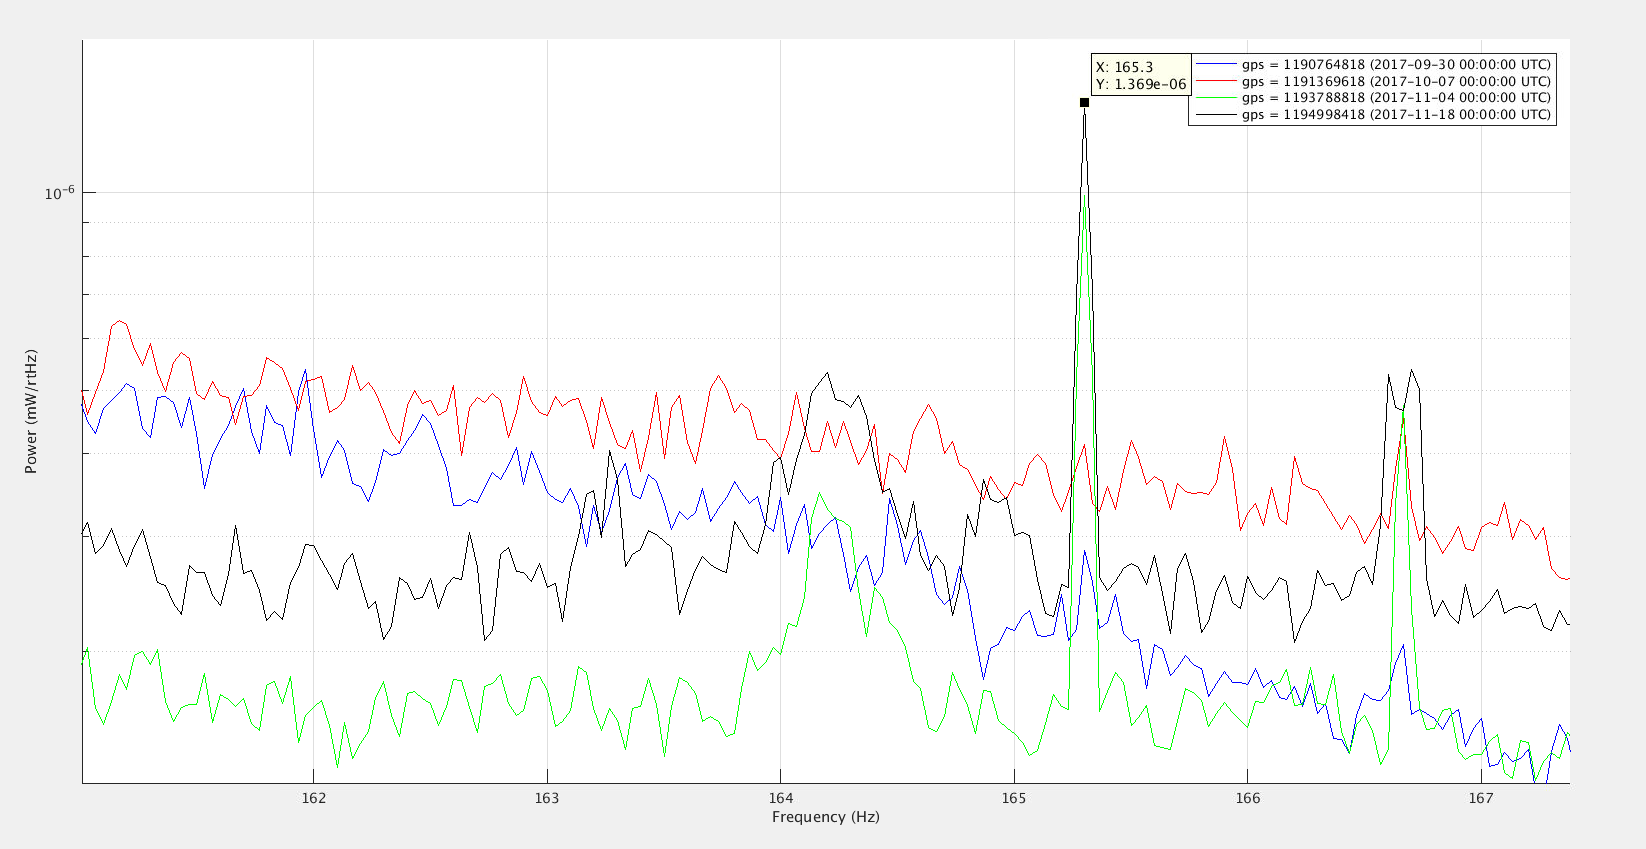
231.7 Hz: SDB1_OMC2 - SDB1_FL_H, figure 2
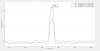
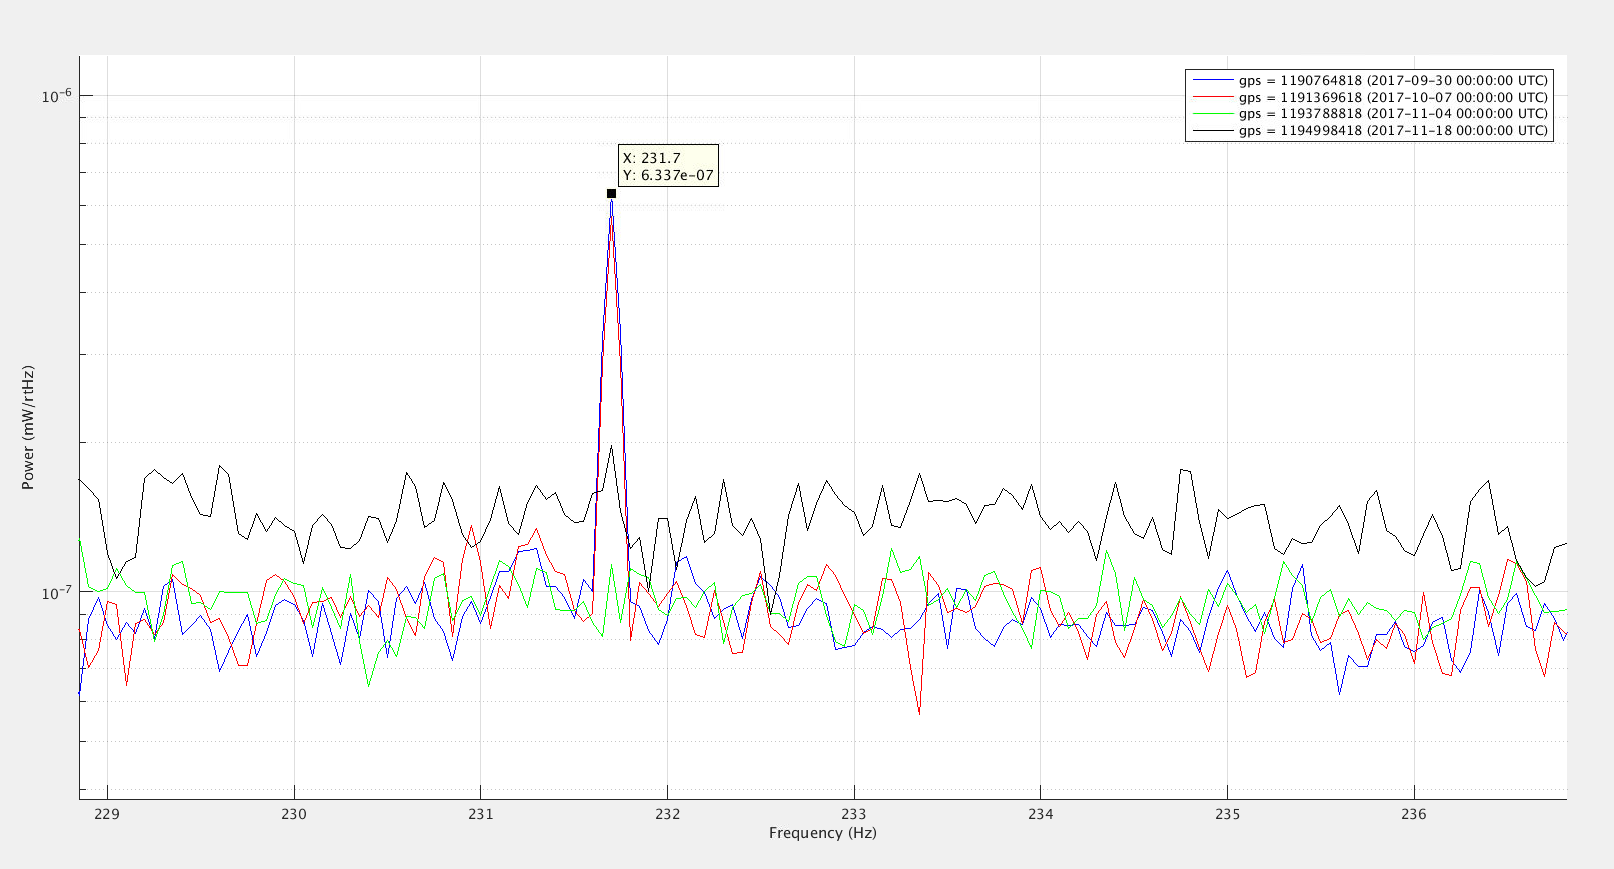
4084.3 Hz: SDB1_OMC1 - SDB1_OMC2, figure 3
On each figure there are two times before and two times after the interventions on SDB1 and PR in October showing the B1 PD2 spectrum. In between the 231.7Hz line disappears (or is at least 5 times smaller), the 165.3Hz appears with a factor 10 above the noise, and 4084.3Hz line increases in amplitude by a factor 5. One significant change during the SDB1 intervention is that the aluminum covers on the OMCs have been removed, and the OMC2 loop gain has increased by a factor ~2 after the intervention (because of tuning of the demodulation phase?).
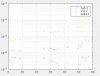
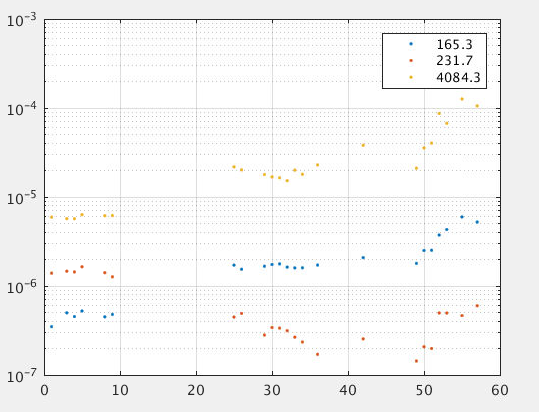
Figure 4, looking at the trend of the heights of these 3 lines, every day at 2:00 UTC starting from Sep 30 to Nov 25, shows the step indeed happened during the intervention between day 10 and 20, and then there is a gradual increase as the laser power was increased during the last 10 days before the end of commissioning.
Figure 5, is the same but normalized by the power on B1 PD2, there is an increase in the line heights even after that normalization.
In December the aluminum covers where put back on the OMC. We will see if the line heights change again. It will be also worthwhile exploring how changing the OMC2 control loop gain, adding an offset or changing the demodulation phase affects these narrow lines (there was no broad-band impact in previous studies).