Reports 1-1 of 1 Clear search Modify search
AdV-DET (Commissioning)
bonnand, gouaty, bersanetti, ruggi, sposito - 15:58 Wednesday 13 September 2017 (39454) Print this report
SDB1 noise investigations - excitation of mounts with picomotors

Yesterday afternoon, we pursued the investigations on SDB1 scattered light noise with the following tests:

1/ Low frequency line along Z direction:

Paolo injected a frequency line at 0.1Hz along the longitudinal axis of the bench suspension. The time of this injection is from 16:55:20 to 17:00:00 utc, this was done in low noise 3. The purpose of this measurement is to re-evaluate the coupling coefficient of the bench scattered light noise to the sensitivity (considering the bench as a rigid body). Calculation of the coupling coefficient is on-going.

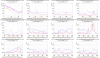
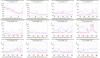
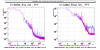
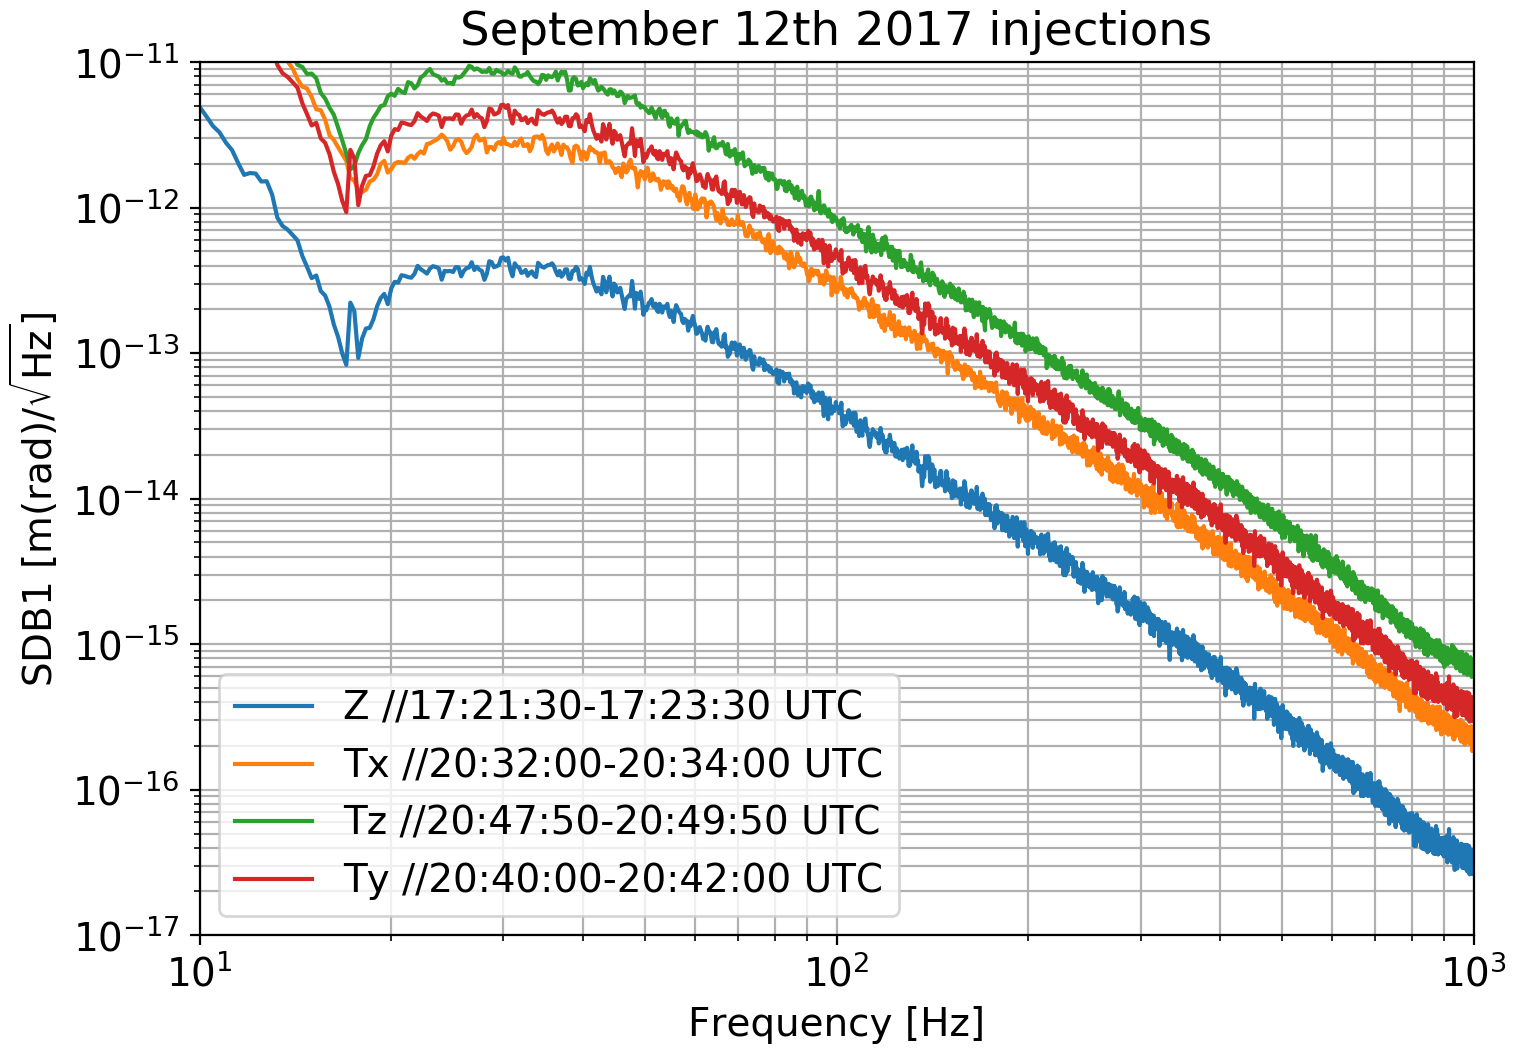
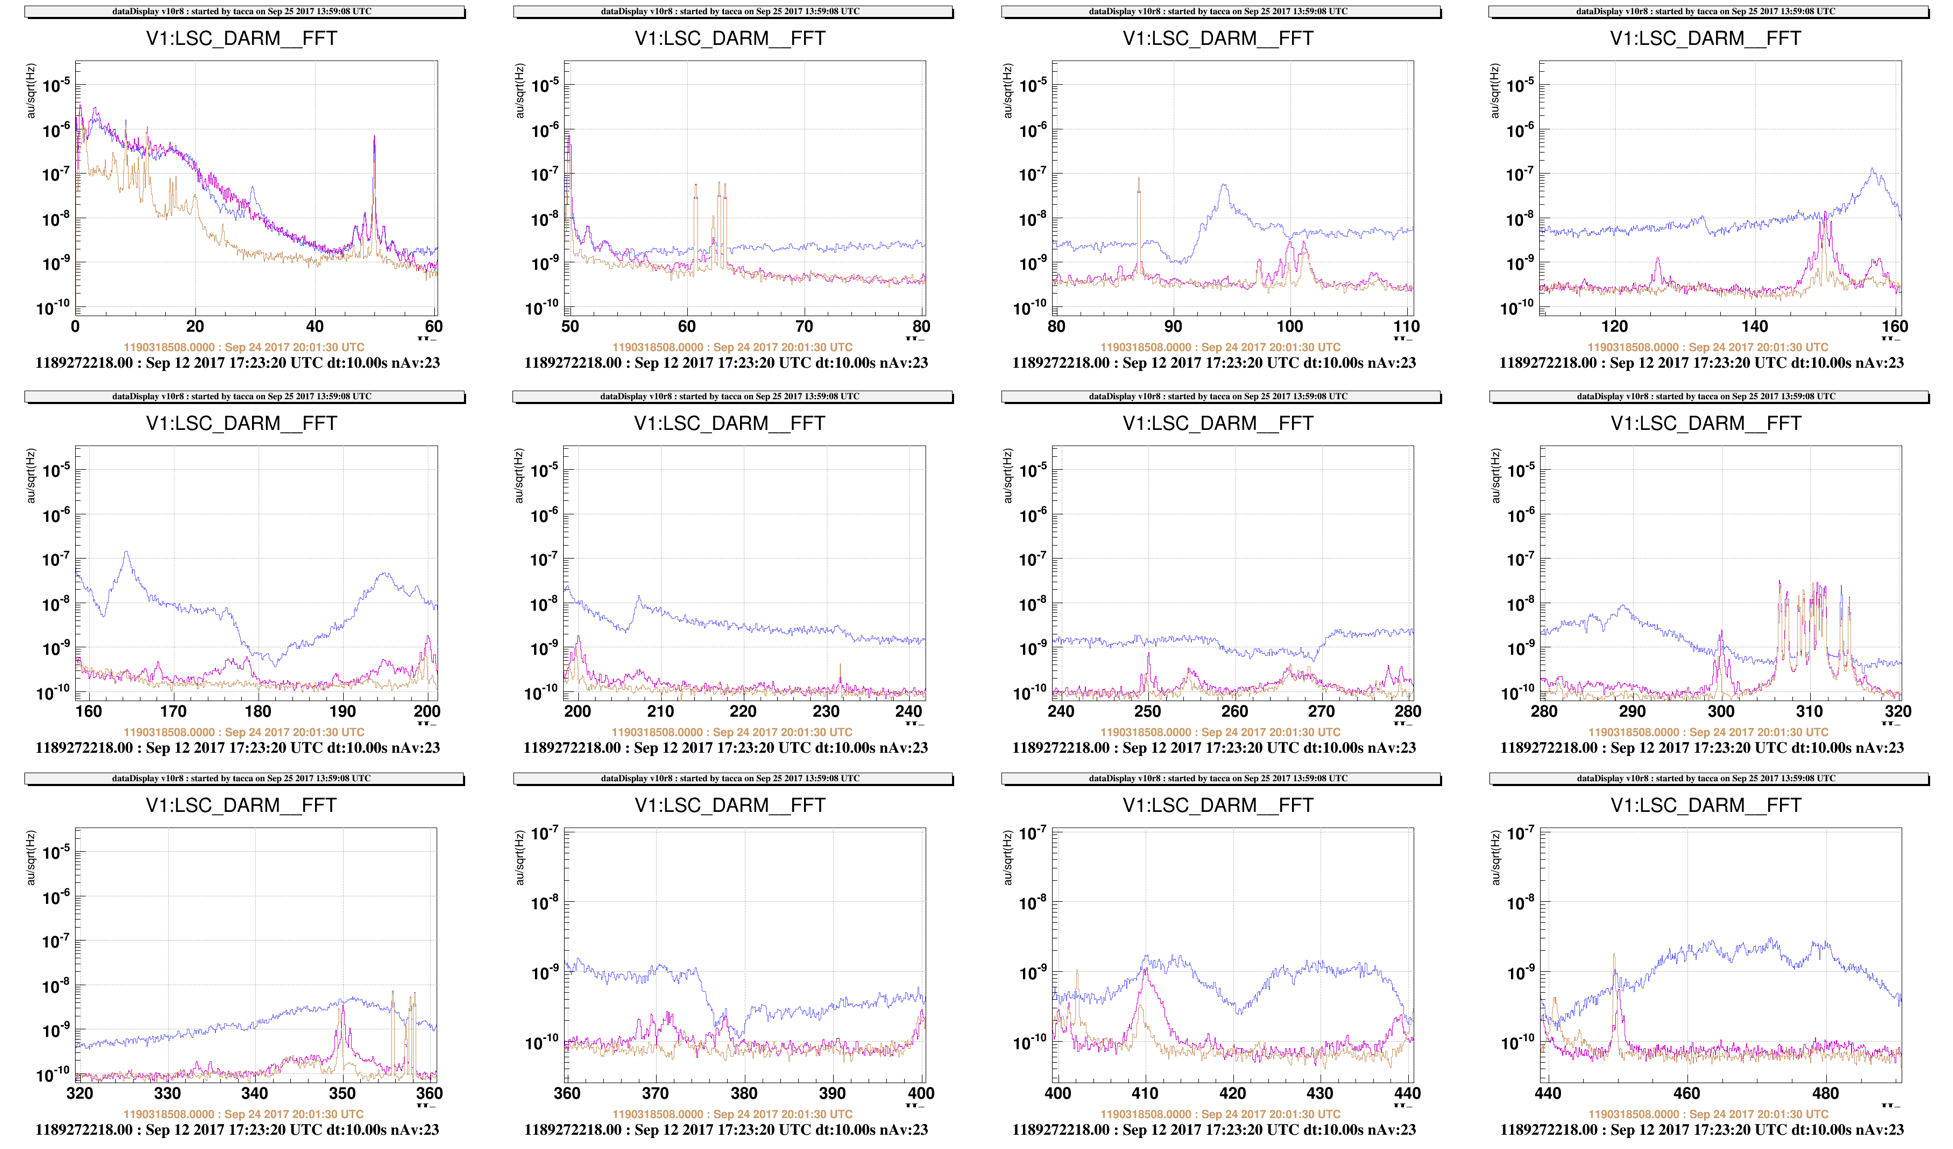
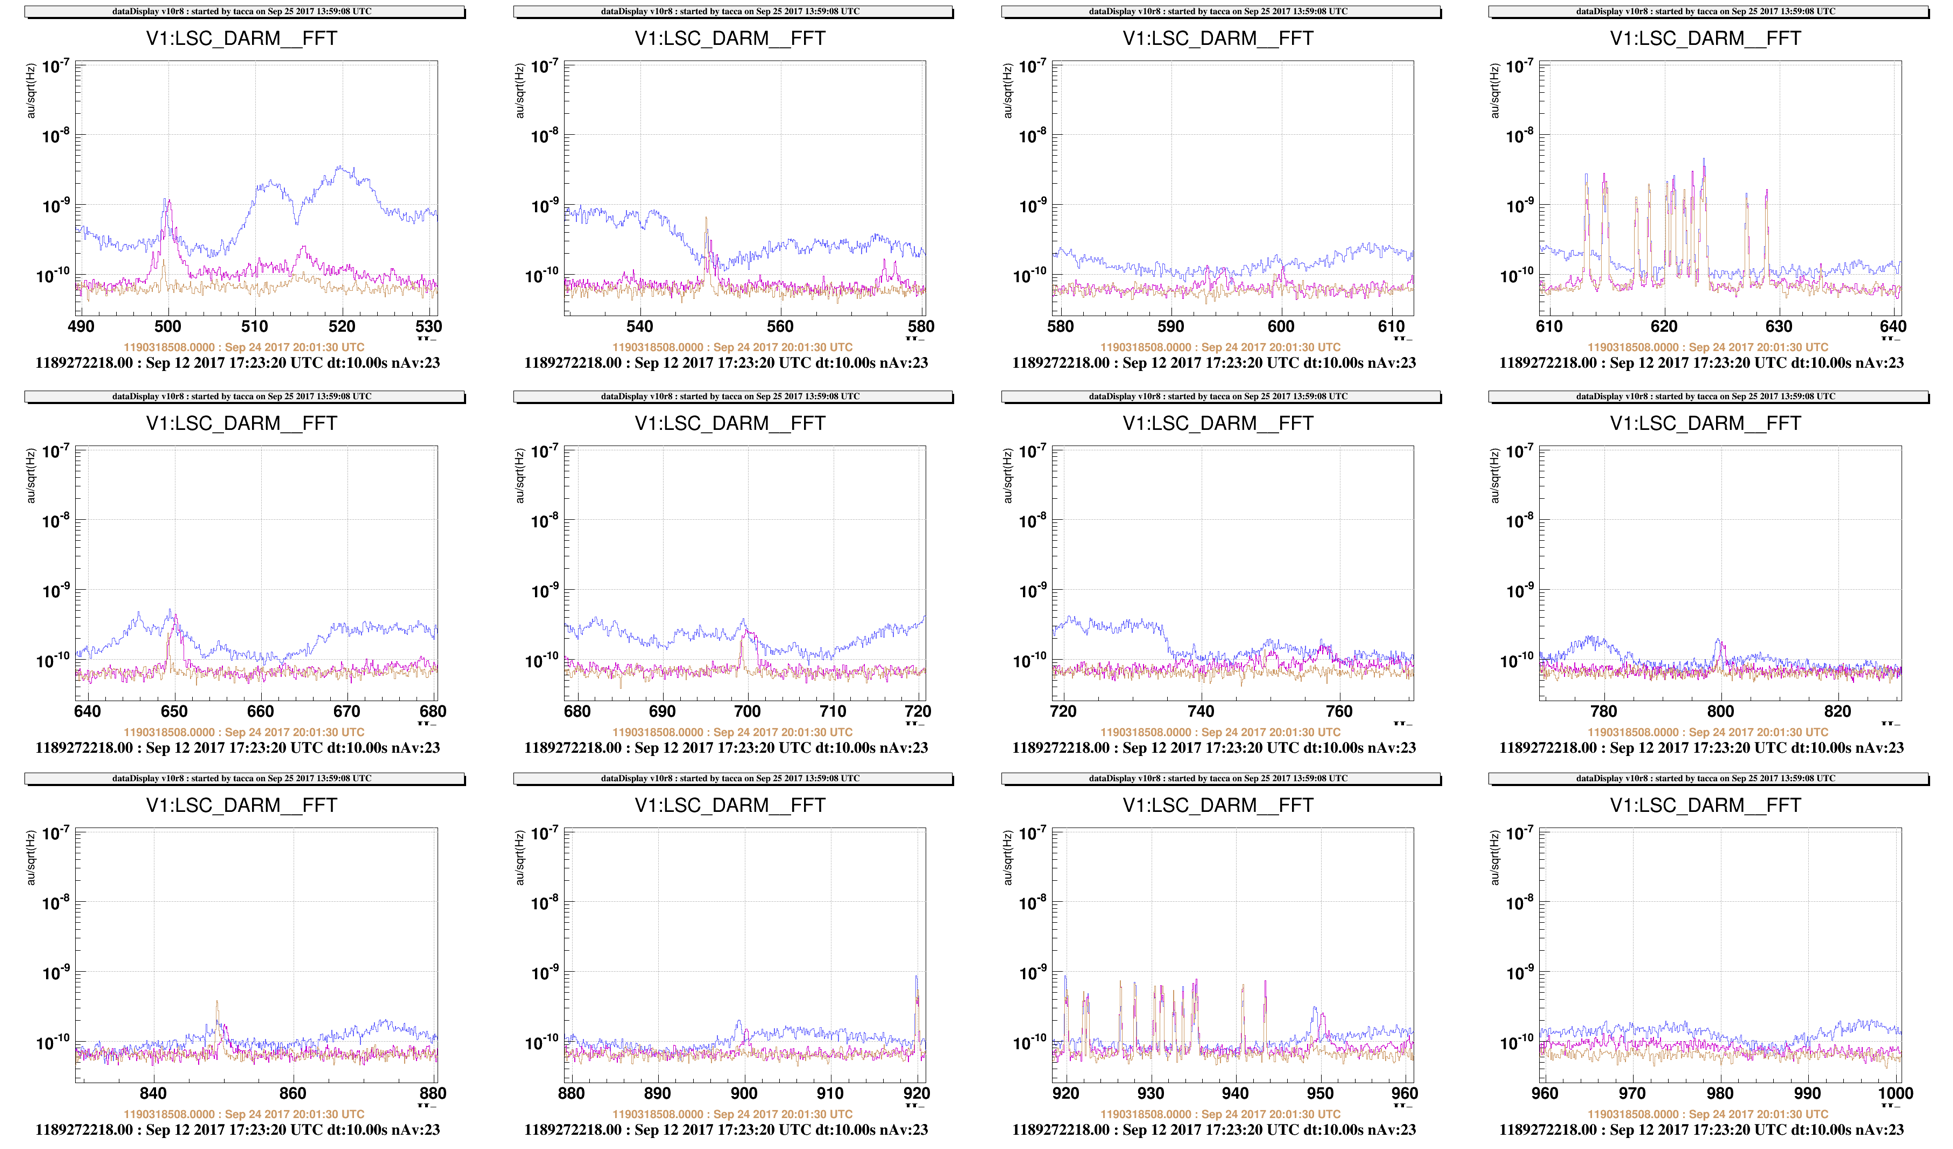
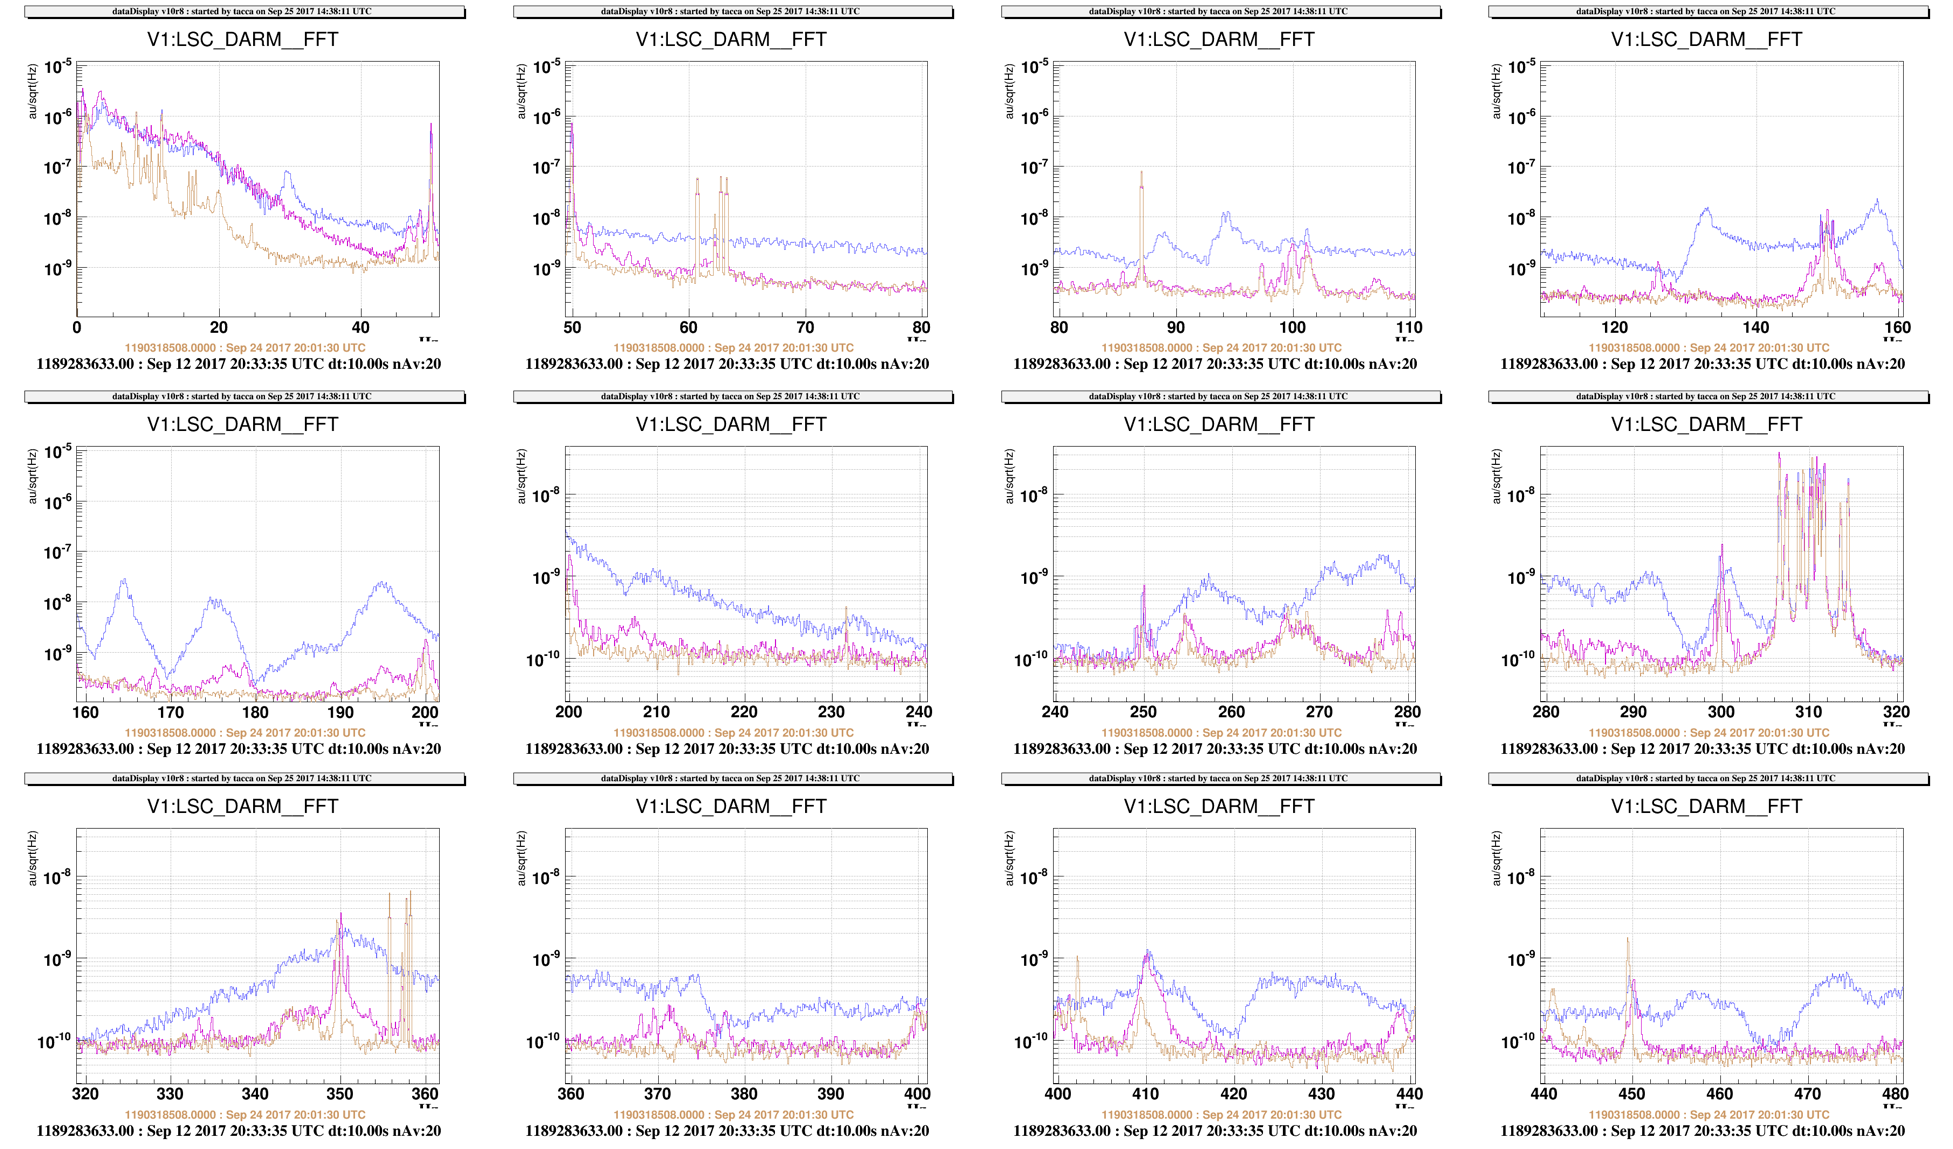
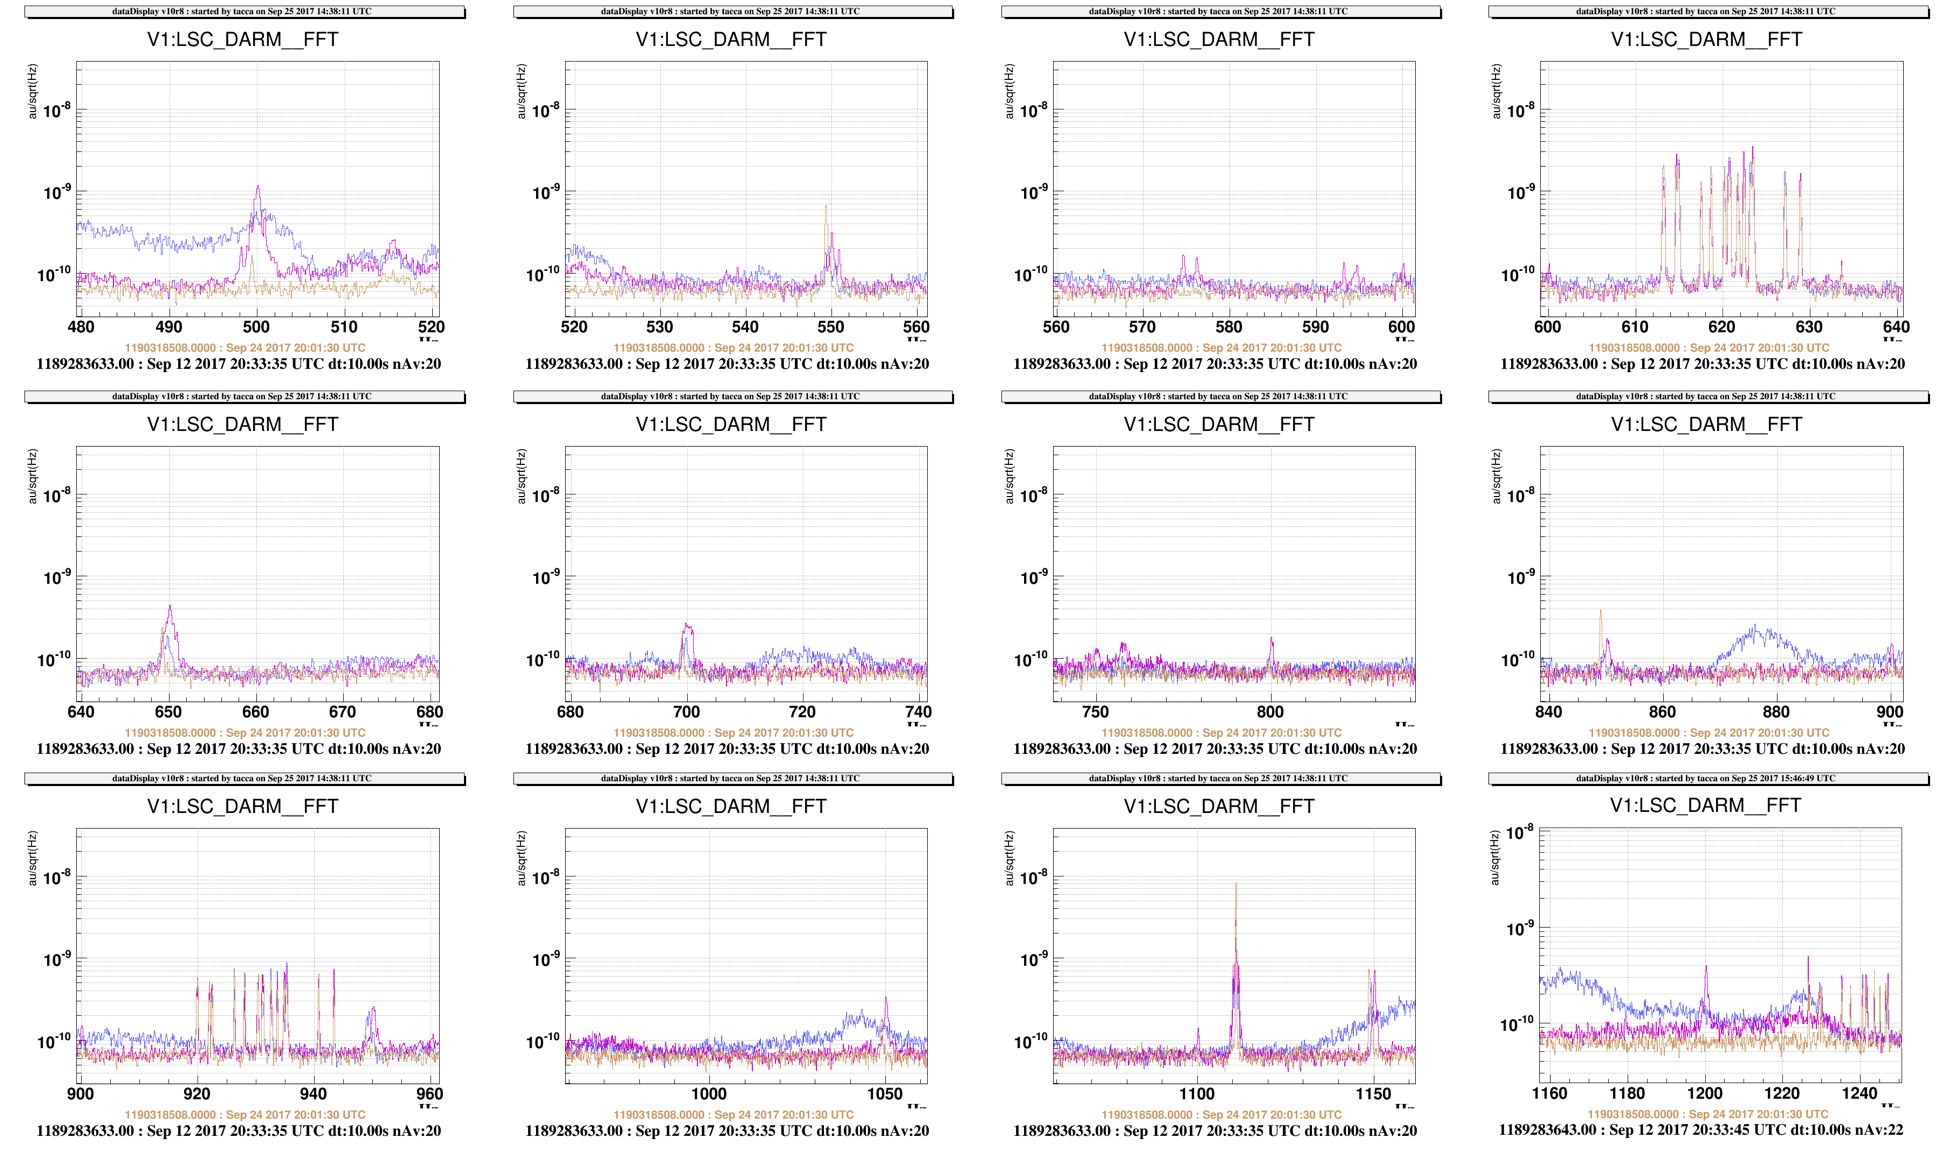
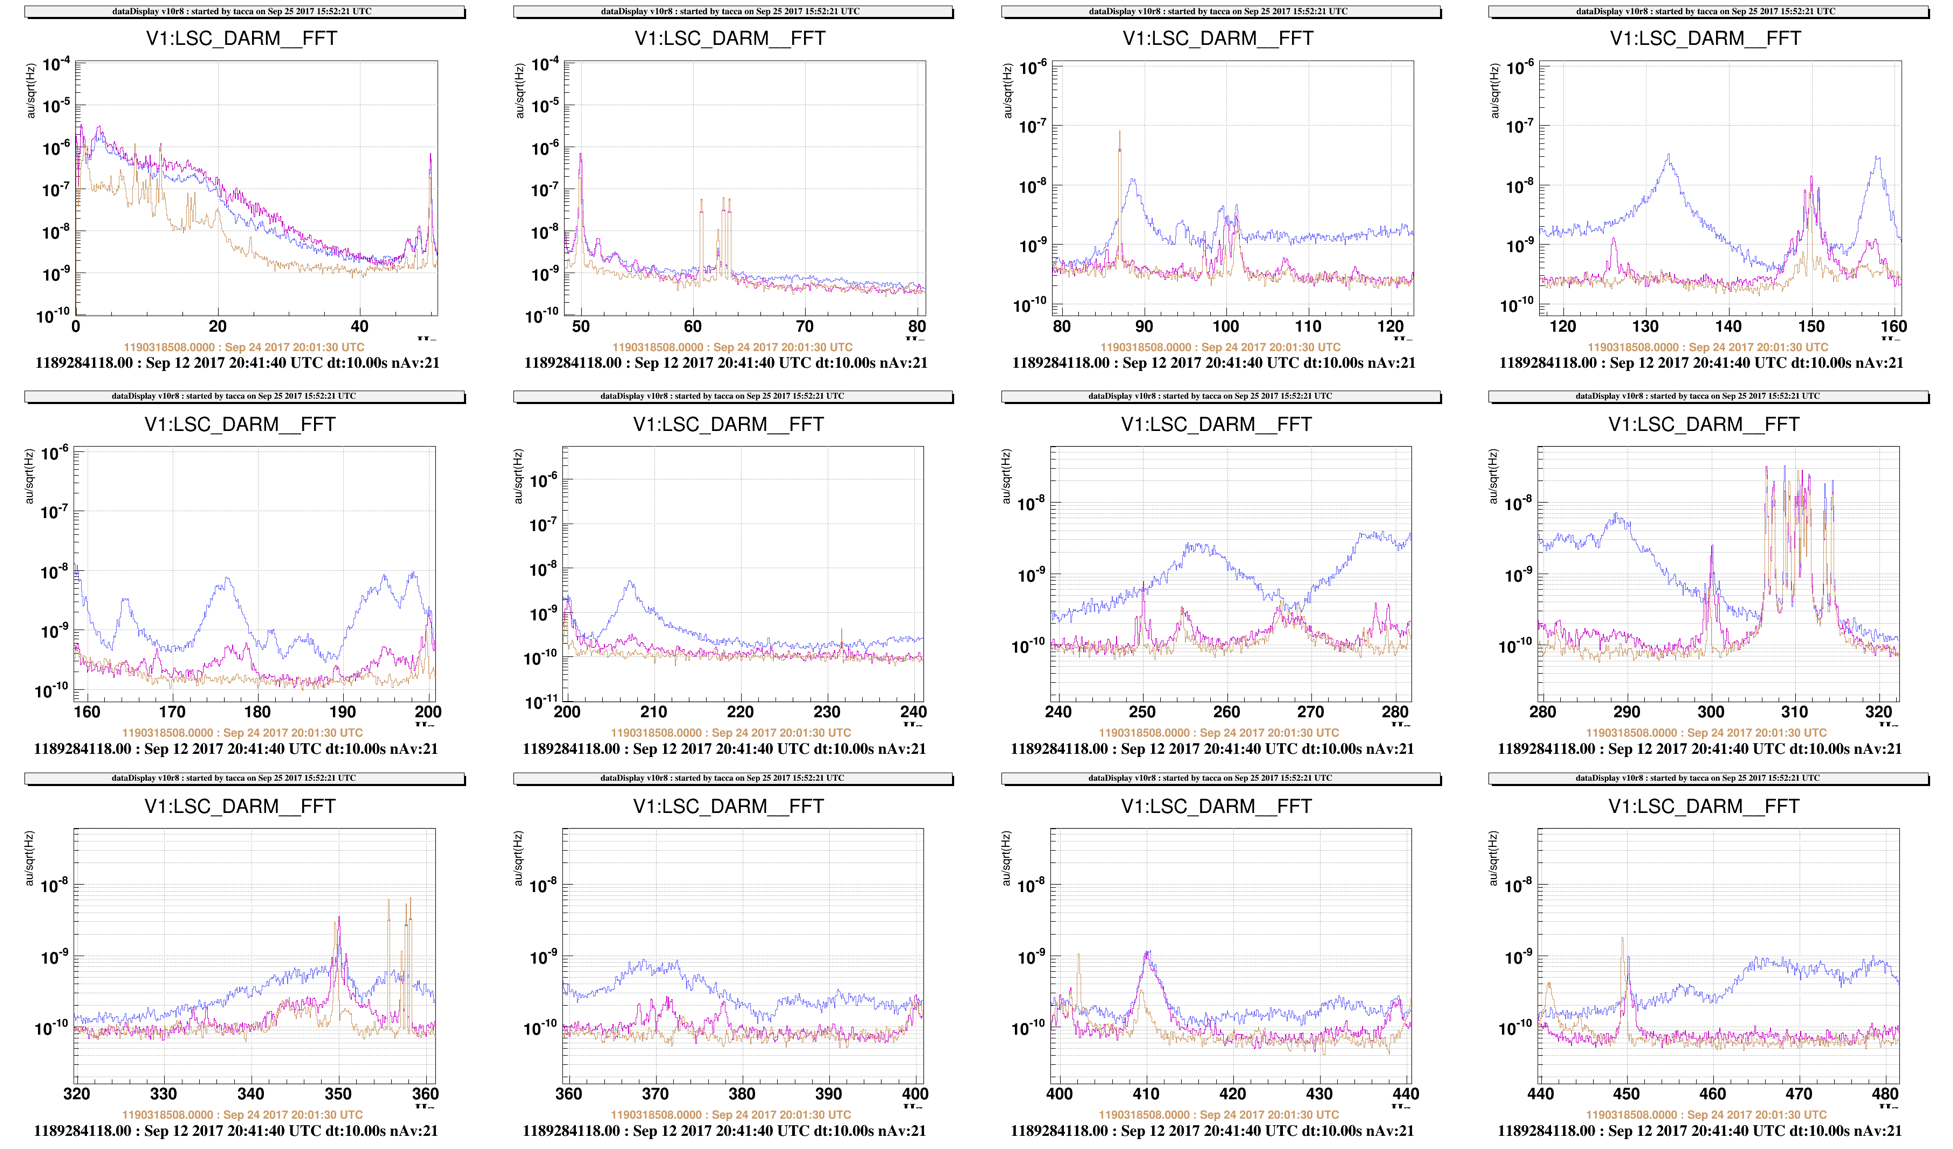
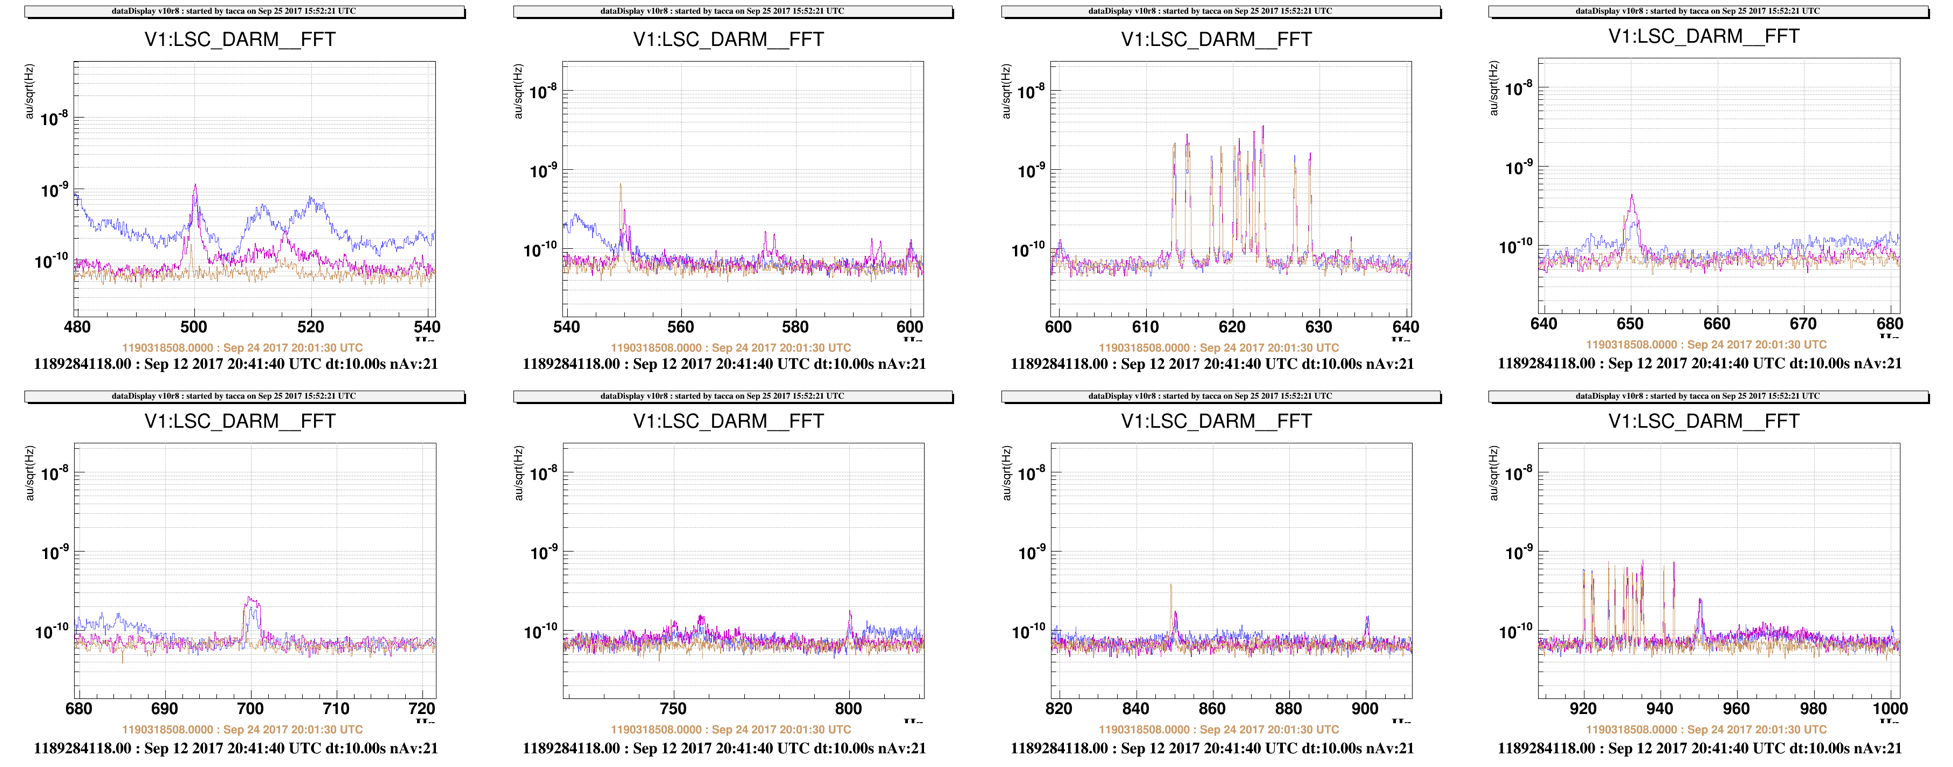
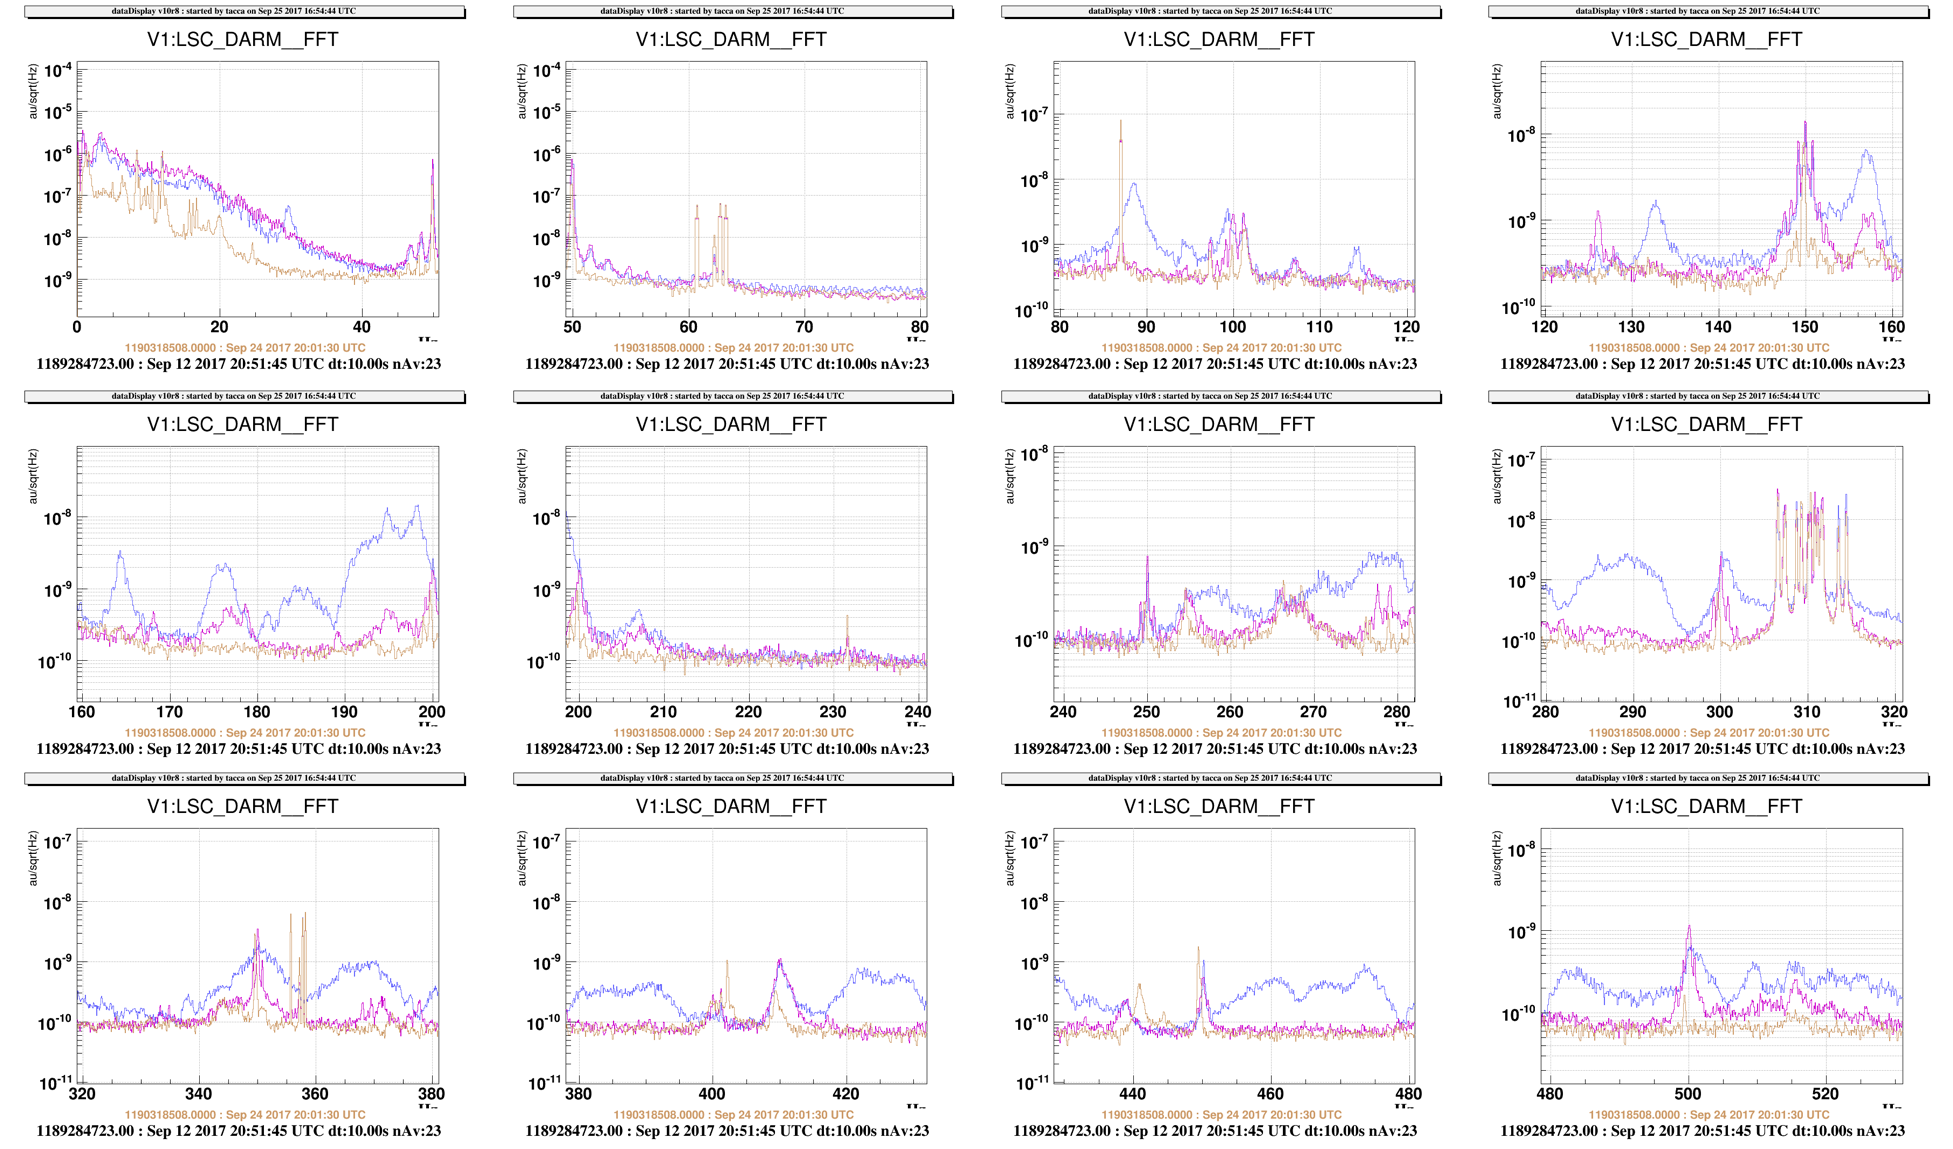
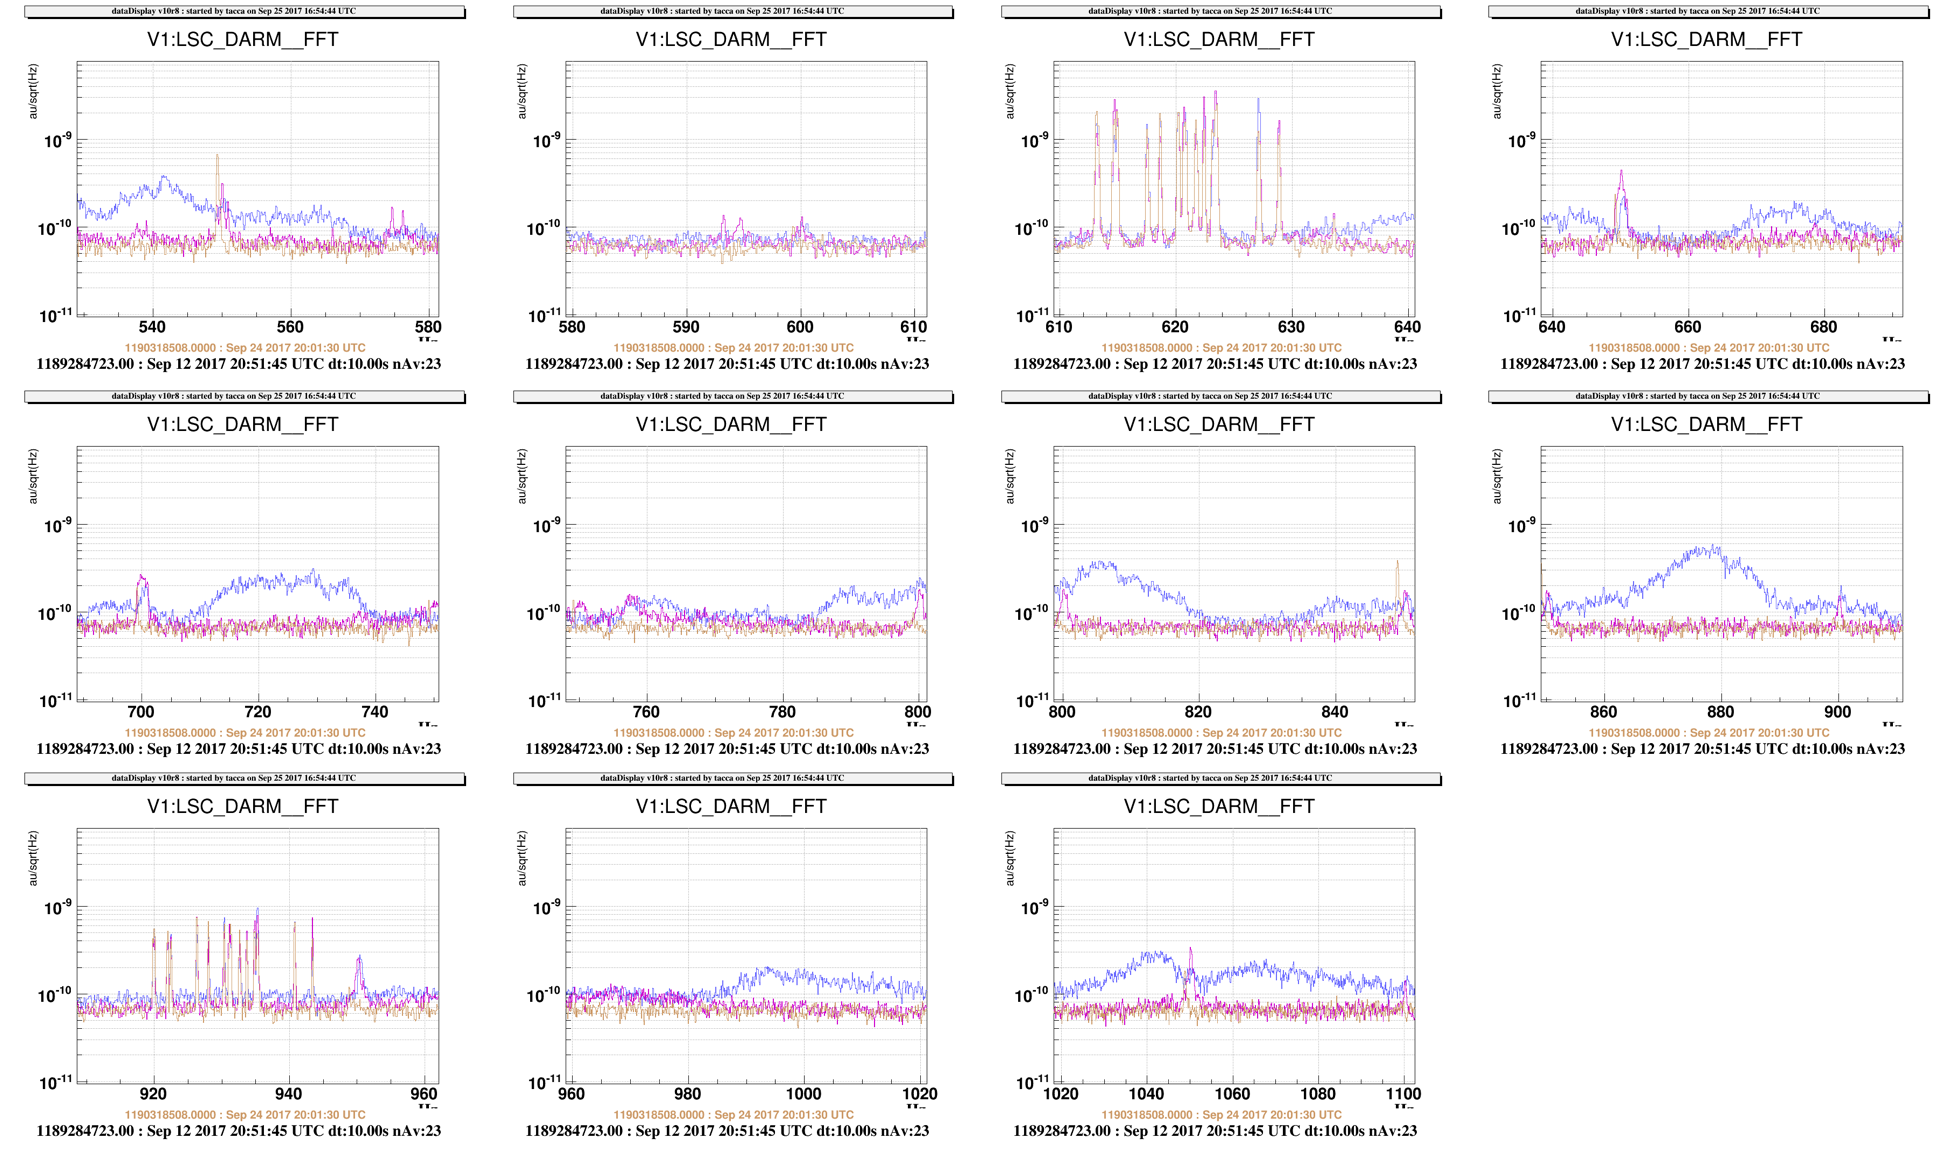
2/ Broadband noise injections (all UTC times):

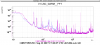
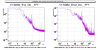
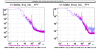
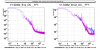
2.1 Longitudinal (Z) injections:

* 17:16:40 - 17:18:40:   Zcorr = 1e-3 V/sqrt(Hz)

* 17:18:55 - 17:20:55:   Zcorr = 3e-3 V/sqrt(Hz)

* 17:21:30 - 17:23:30:   Zcorr = 6e-3 V/sqrt(Hz)

* 17:23:55 - 17:27:00:   Zcorr = 5e-4 V/sqrt(Hz)

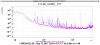
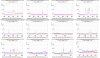
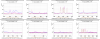
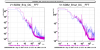
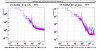
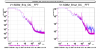
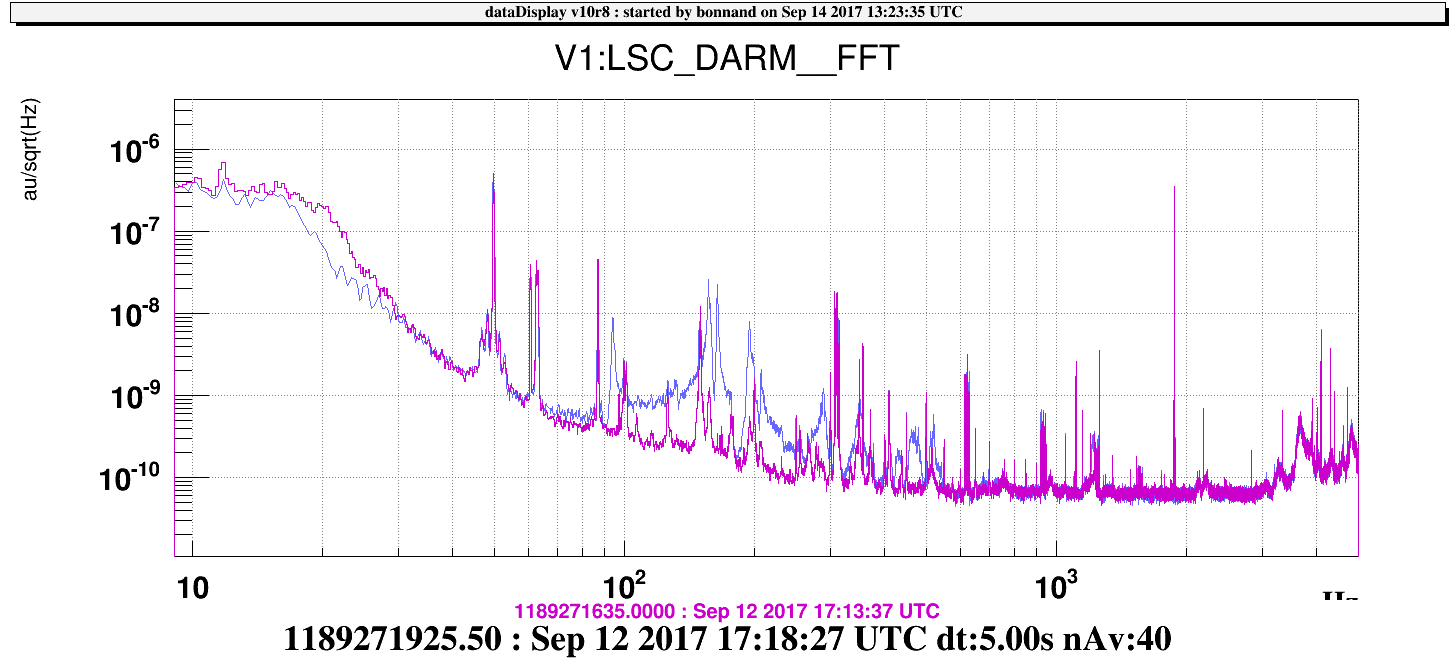
2.2 Angular TX injections:

* 20:27:40 - 20:29:40:   TXcorr = 1e-4 V/sqrt(Hz)

* 20:29:55 - 20:31:55:   TXcorr = 4e-4 V/sqrt(Hz)

* 20:32:00 - 20:34:00:   TXcorr = 1e-3 V/sqrt(Hz)

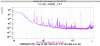
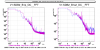
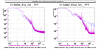
2.3 Angular TY injections:

* 20:35:30 - 20:37:30:   TXcorr = 2e-4 V/sqrt(Hz)

* 20:37:40 - 20:39:40:   TXcorr = 4e-4 V/sqrt(Hz)

* 20:40:00 - 20:42:00:   TXcorr = 1e-3 V/sqrt(Hz)

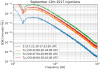
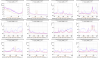
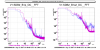
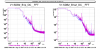
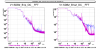
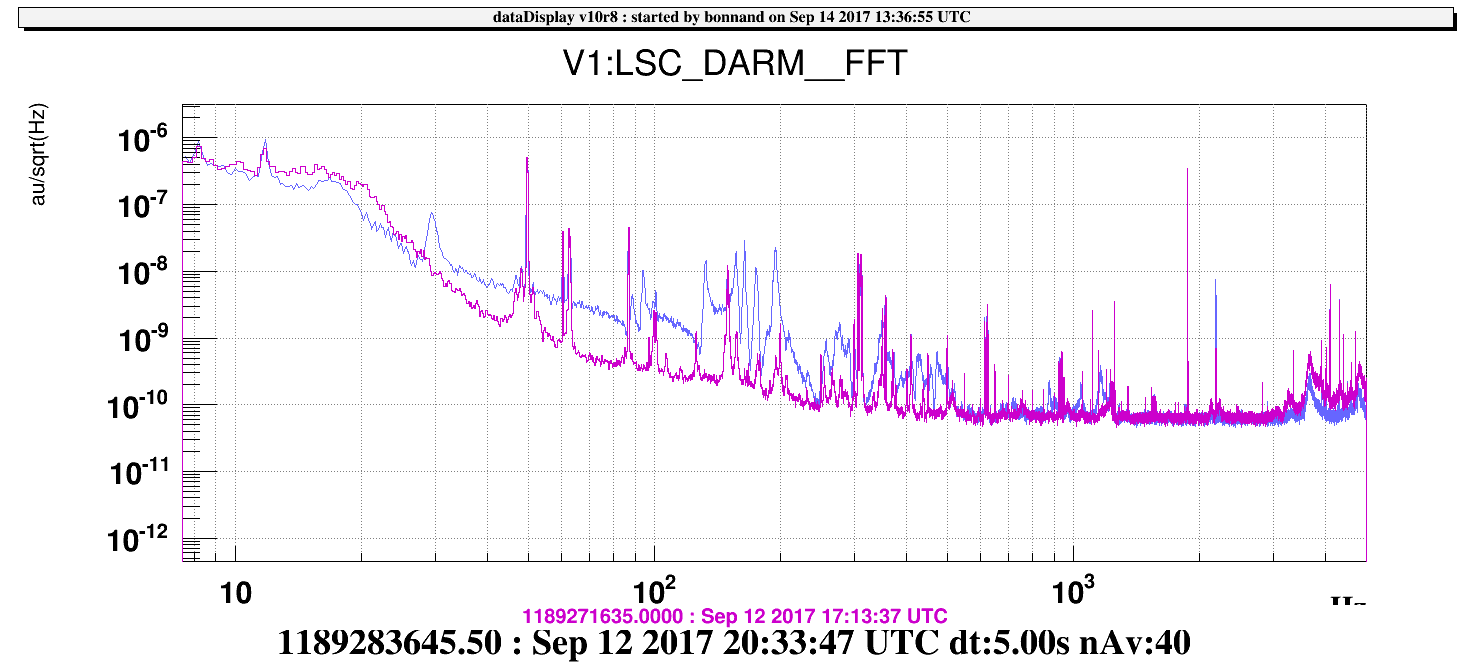
2.4 Angular TZ injections:

* 20:45:30 - 20:47:30:   TXcorr = 5e-4 V/sqrt(Hz)

* 20:47:50 - 20:49:50:   TXcorr = 3e-3 V/sqrt(Hz)

* 20:49:55 - 20:51:55:   TXcorr = 1.5e-3 V/sqrt(Hz)

Analysis of these injections is on-going and will be posted later.

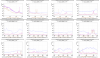
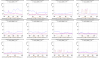
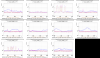
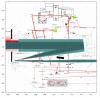
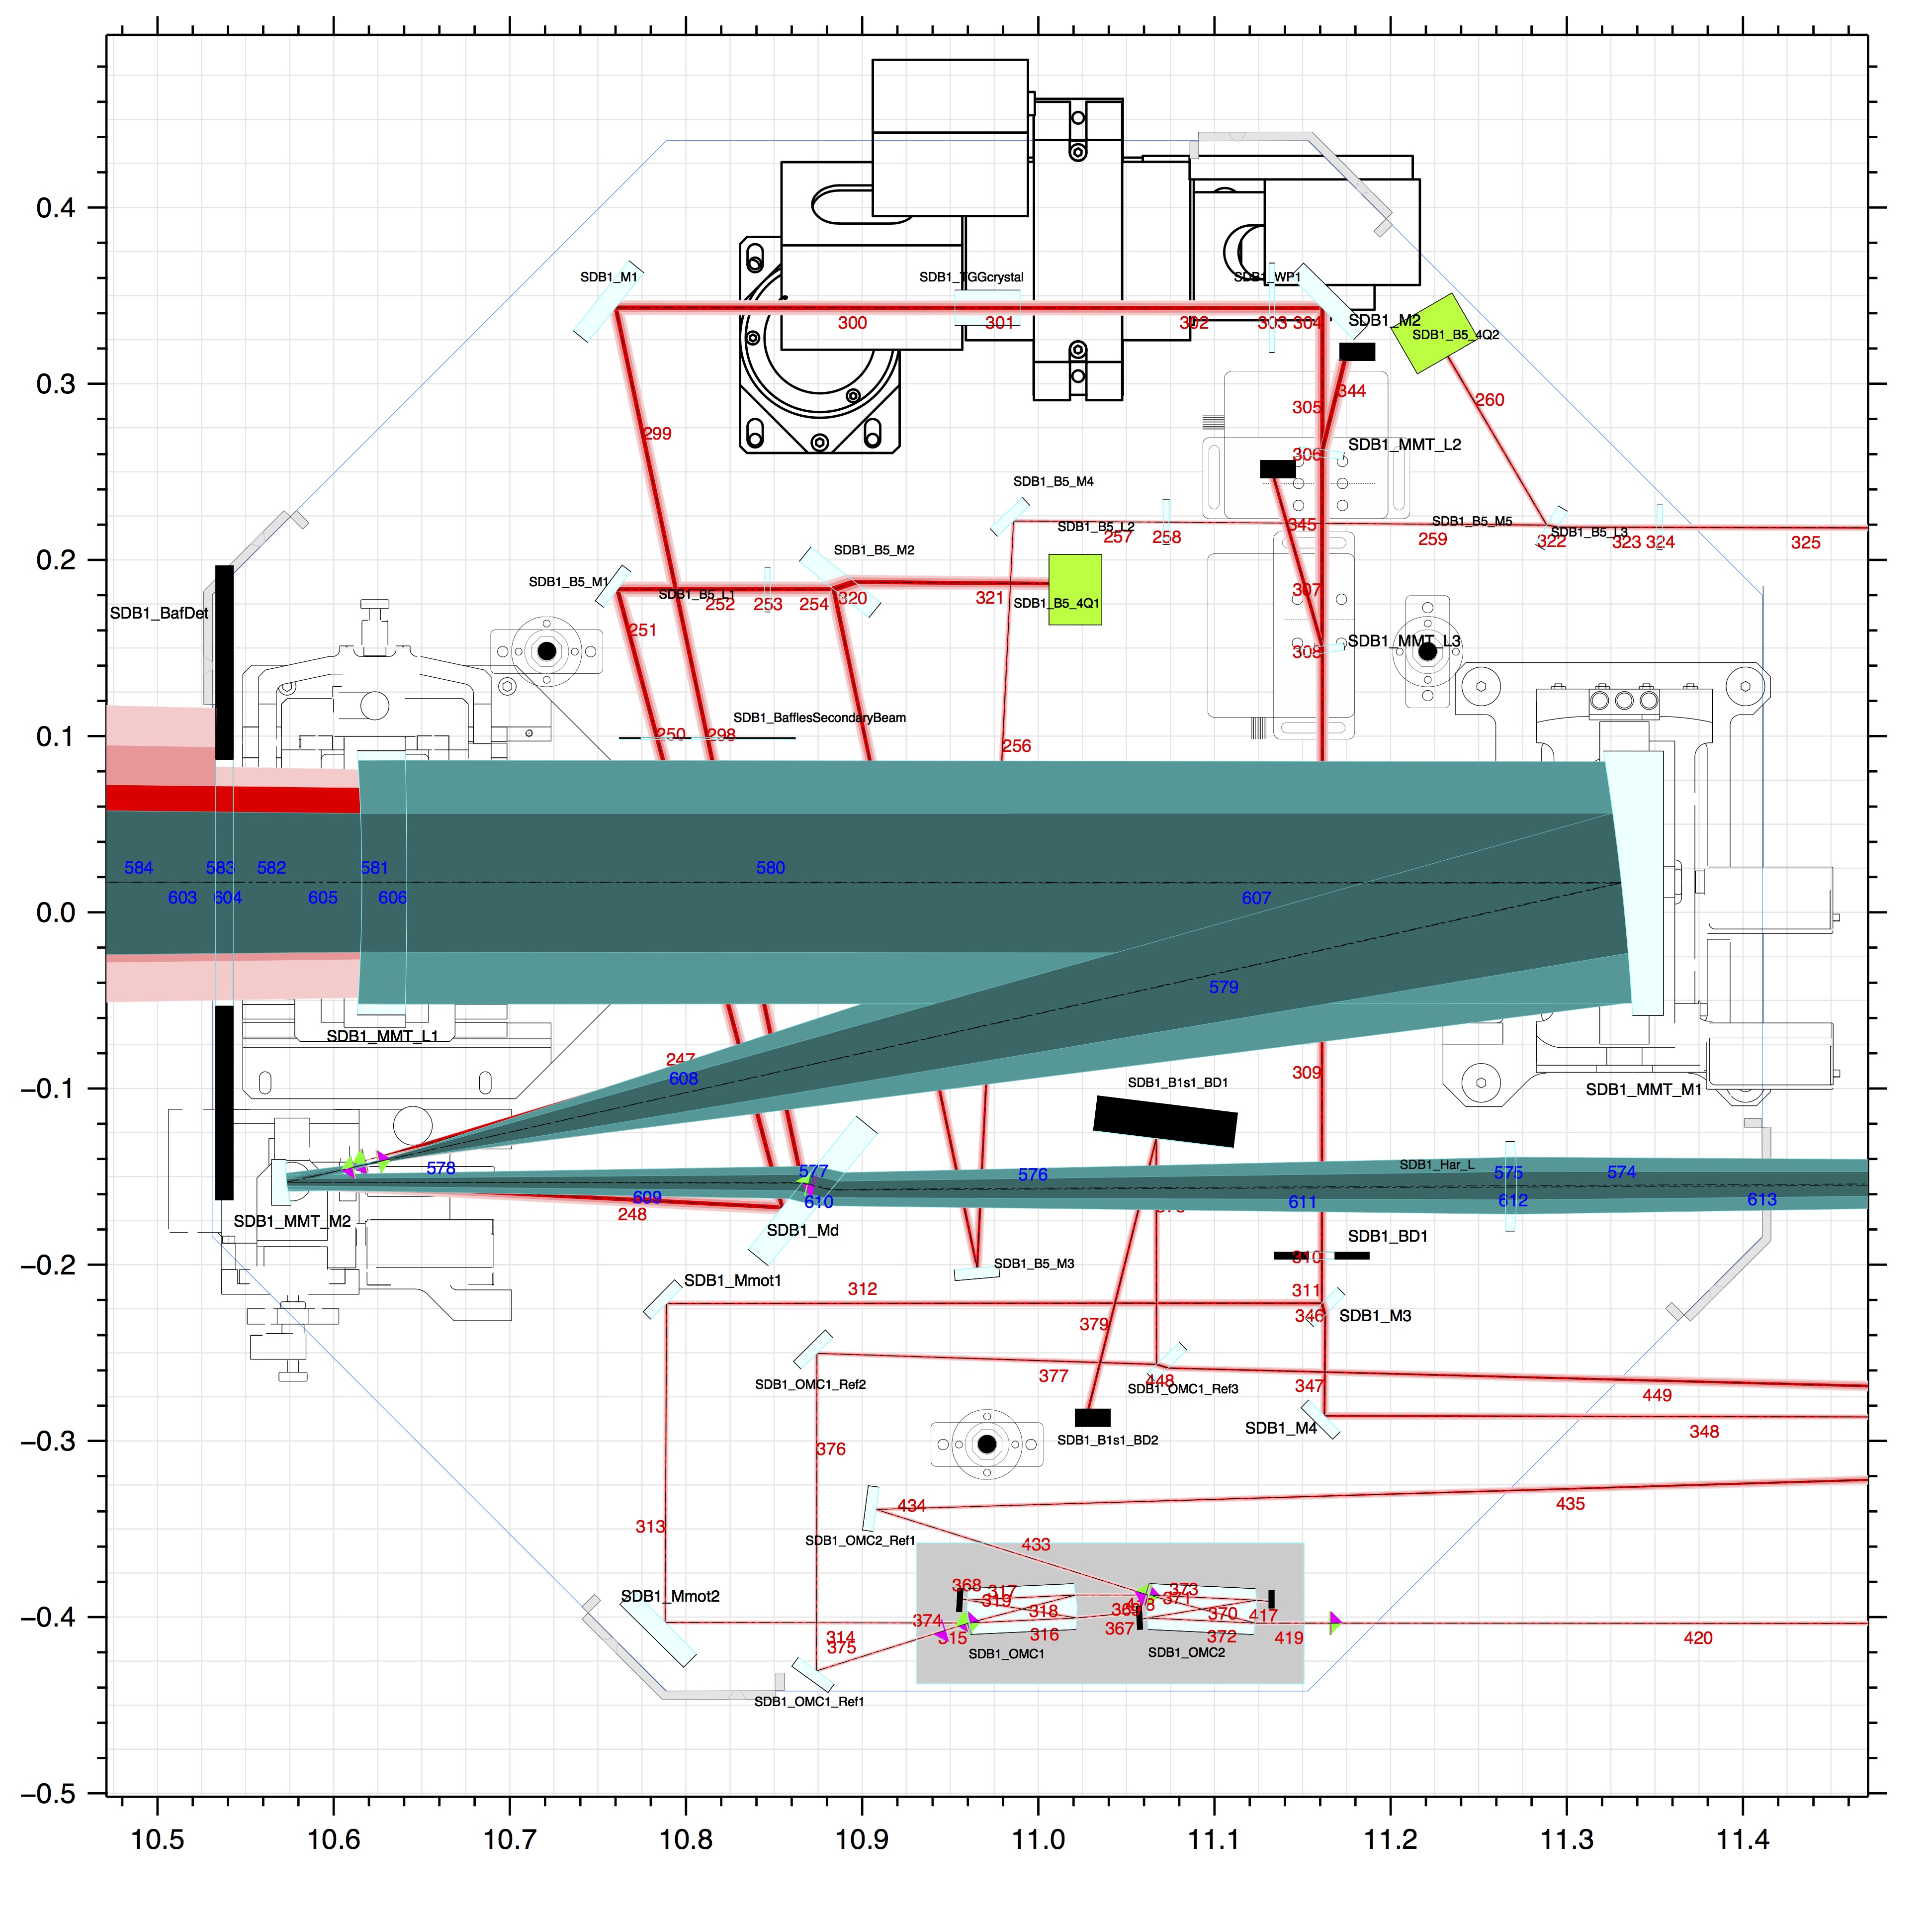
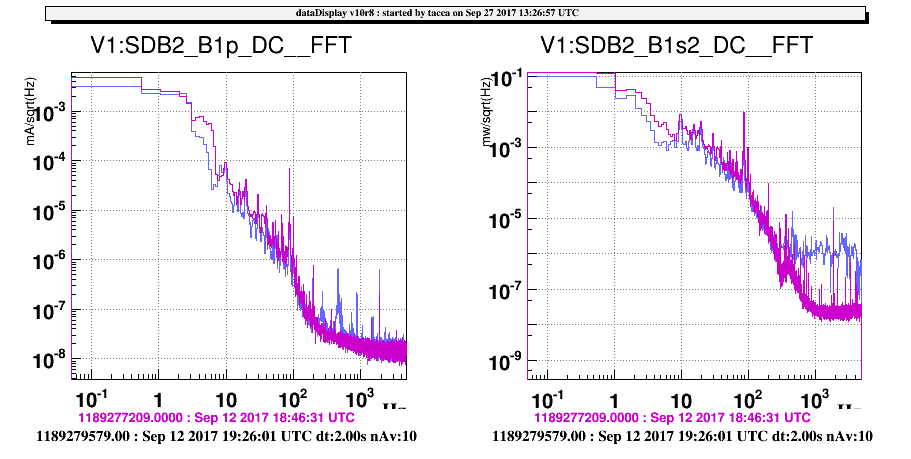
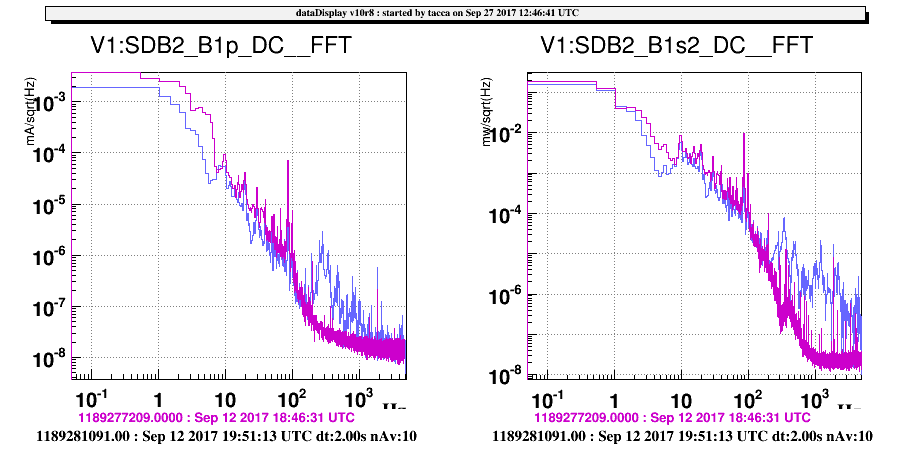
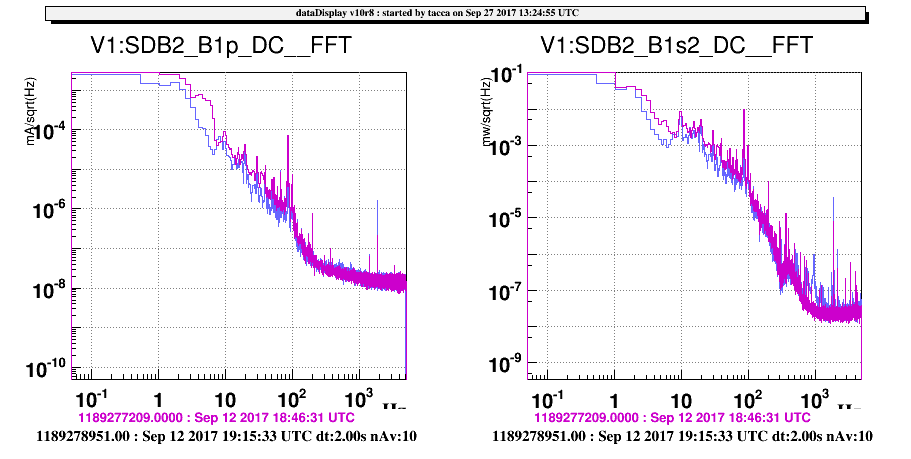
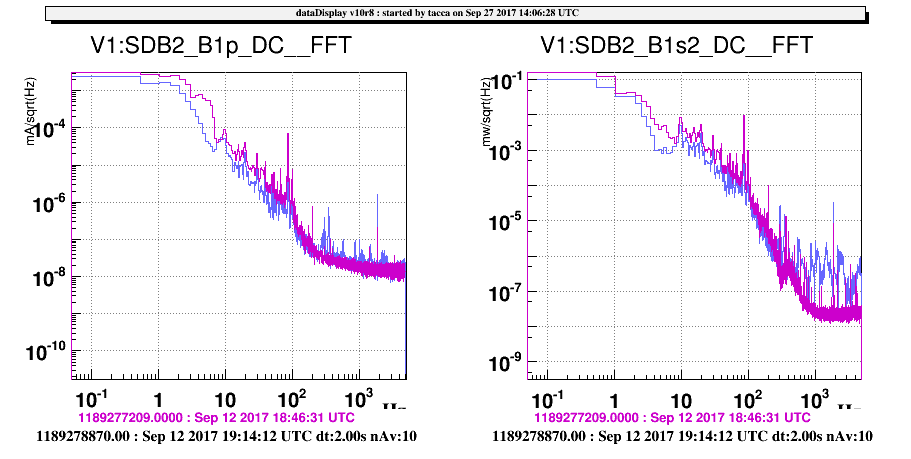
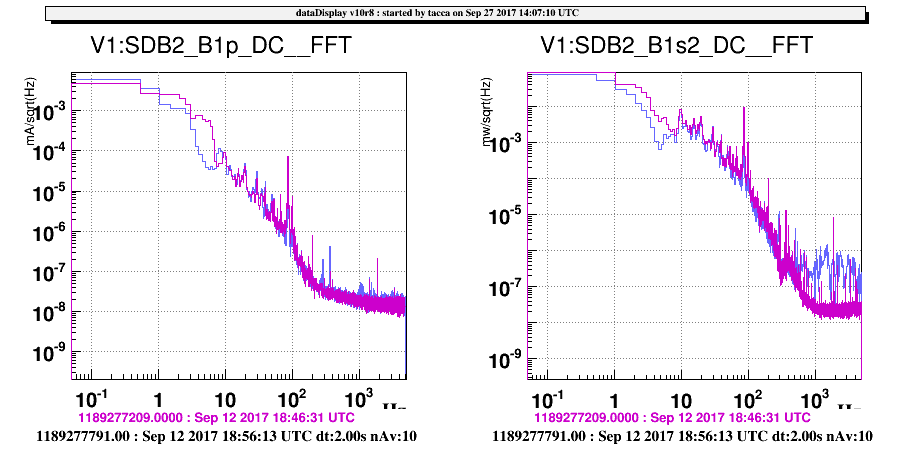
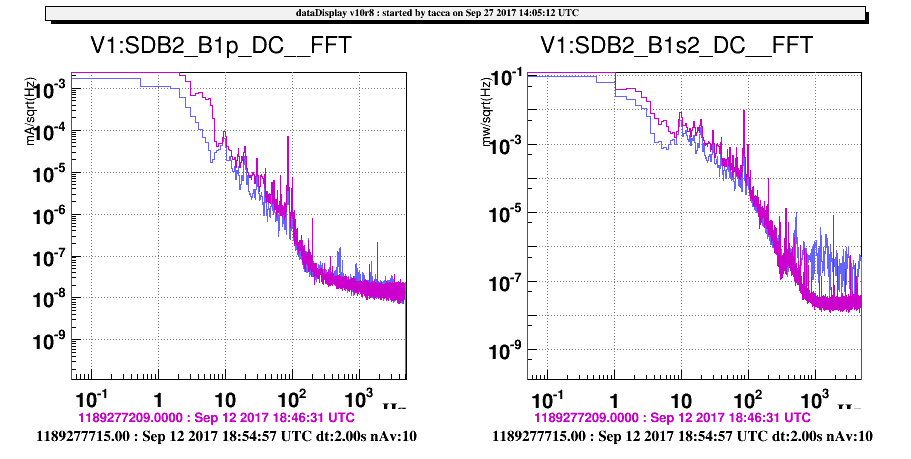
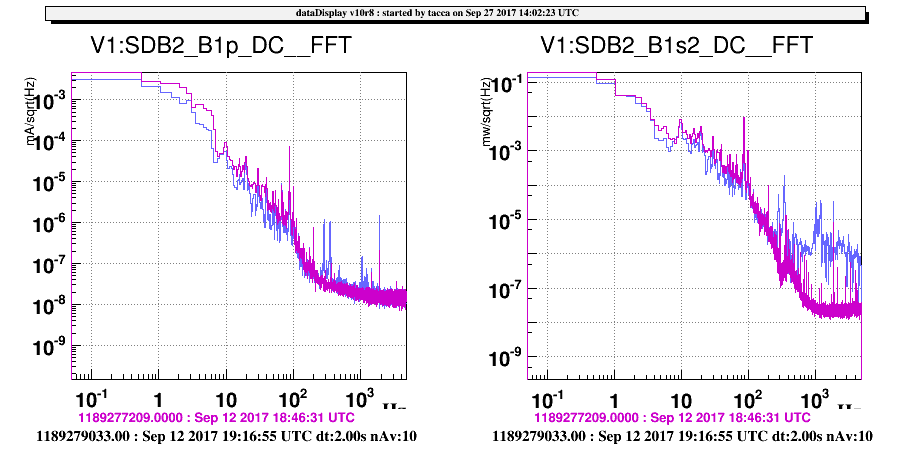
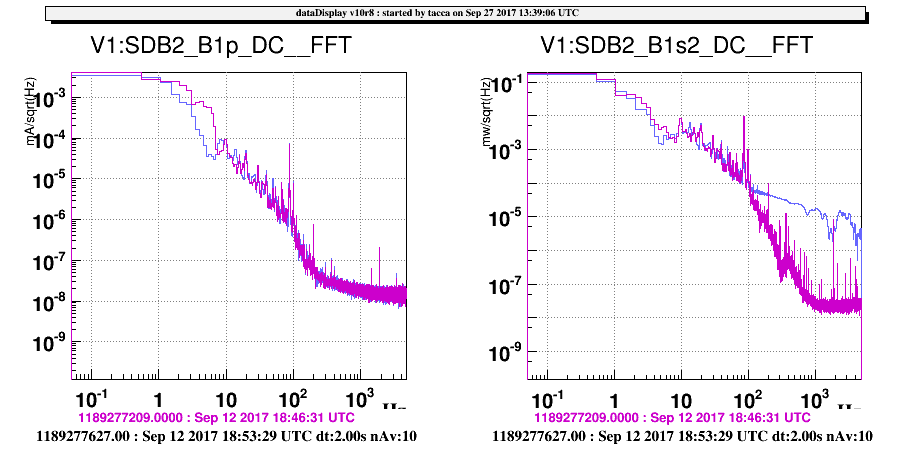
3/ Excitation of optics mounts with picomotors:

Pursuing the test started last friday (logbook 39366) with the ITF locked on B1p PD1, DIFF alignment loop engaged and OMC1 locked, we excited various optics mounts on SDB1 by applying 1 step on their picomotors. The list of GPS times and the list of mounts excited are reported below:

* SDB1_Mmot1 TX:    1189277236

* SDB1_OMC2 Z:       1189277620

* SDB1_M4 TX:           1189277708

* SDB1_M2 TX:           1189277784

* SDB1_M1 TX:           1189278863

* SDB1_Md TX:           1189278944

* SDB1_Mmot2 TX:    1189279026

* SDB1_OMC1_Ref2 TX:  1189279102

* SDB1_MMT_L3 Z:    1189279339

* SDB1_MMT_L2 Z:    1189279404

* SDB1_MMT_L1 Z:    1189279572

* SDB1_B5_M4 TX:    1189279871

* SDB1_OMC2_Ref1 TX:   1189280049

* SDB1_MMT_M2 TX (+1 step):    1189280960

* SDB1_MMT_M2 TX (-1 step):     1189281031

* SDB1_MMT_M1 TX (+1 step):    1189281084

* SDB1_MMT_M1 TX (-1 step):     1189281152

Analysis of these excitations is on-going, results to come later.

Comments to this report:
bersanetti - 20:13 Wednesday 13 September 2017 (39462) Print this report

Just for the sake of precision, for the activity 3/ (Excitation of optics mounts with picomotors), also the angular loops for both the PR DOFs were engaged. Both loops (DIFFp and PR) were in the same working conditions as in the usual LOW_NOISE_3 state.

bonnand - 17:53 Thursday 14 September 2017 (39477) Print this report

Here is an attempt to extract some informations about the peaks in DARM by combining the data from broadband injection (in z and all angular degree of freedom) and the data from the excitation of the optics mount using the pico-motors.


First figure shows DARM FFT during the broadband noise injection in z compared with a reference taken a few minutes before the injection (ref in purple).
One can see some structures and lines rising around the frequencies listed below :
- 93 Hz
- 157 Hz
- 164 Hz
- 195 Hz
- 208 Hz
- 289 Hz
- broad 340-360 Hz
- broad 420-440 Hz
- broad 455-485 Hz
- 518 Hz
- 520 Hz
- broad 1208-1230 Hz

Figure 2 shows DARM during TX broadband noise injection, one can see a large broadband noise between 30 and 130 Hz in addition to lines and structures at the following frequencies :
- 30 Hz
- 88 Hz
- 94 Hz
- 101 Hz
- 133 Hz
- 157 Hz
- 164 Hz
- 176 Hz
- 195 Hz
- broad 255-295 Hz
- broad with several peaks 335-520 Hz
- 875 Hz
- 1044 Hz
- 1162 Hz

Figure 3 shows DARM during TY broadband noise injection, one can see lines and structures rising at the following frequencies :
- 88 Hz
- 94 Hz (small)
- 101 Hz (small)
- 133 Hz
- 157 Hz
- 164 Hz
- 176 Hz
- 195 Hz
- 198 Hz
- 207 Hz
- 256 Hz
- broad 273-293 Hz
- broad with several peaks 335-545 Hz
- broad 670-690 Hz
- broad around 1220 Hz

Figure 4 shows DARM during TZ broadband noise injection, one can see lines and structures rising at the following frequencies :
- 29 Hz
- 88 Hz
- 114 Hz
- 133 Hz
- 157 Hz
- 164 Hz
- 176 Hz
- 195 Hz
- 198 Hz
- 207 Hz
- 256 Hz
- broad 255-295 Hz
- broad with several peaks 335-550 Hz
- several broad noises between centered around 640, 672, 722, 804, 875, 996, 1042, 1070, 1170, 1211 Hz


Most of the lines and structures are excited for each dof noise injection but with a more or less high amplitude.
In any case, the lines excited the more strongly are the ones between 50 and 300 Hz especially the ones at 133, 157, 164, 176, 195, 198, 207, 257 and the broad noise between 273 and 293 Hz.

Looking at the frequencies excited when exciting the pico-motors (in the B1s2_DC and B1p_DC spectrum), we can see some correspondance with the following mounts for the given frequencies :
- 133 Hz: none of the mount excited show that frequency
- 157 Hz: MMT_M1_TX
- 164 Hz: MMT_M1_TX (visible only in B1p spectrum)
- 176 Hz: none
- 195 Hz: peak visible in MMT_L1_Z and MMT_L3_z (smaller) at 194 Hz as well as in MMT_M1_TX and MMT_M2_TX (smaller for M2 than M1)
- 198 Hz: nothing but there is already a peak visible in quiet condition at 199 Hz in B1p and B1s2 spectrum.
- 207 Hz: broad peak in MMT_L3_z
- 257 Hz: peak visible in MMT_L1_Z and MMT_L3_z (smaller) in B1p only. Visible in MMT_M1_TX and MMT_M2_TX.
- 273-293 Hz: Large peak visible centered at 285 Hz with Mmot2_TX excited; broad noise for MMT_M1_TX and MMT_M2_TX at those frequencies; peak visible when MMT_L1/L3_Z excited at 270 Hz and 292 Hz for MMT_L3_Z, some kind of broadband noise between 270 and 300 Hz for M1_TX and M2_TX.

It has to be noted that when moving the OMC2 in Z by 1 step it produces a very large noise on B1s2 only from 10 Hz to the maximum frequency


As a reminder, the excitation of the mount is done by doing 1 step on the pico-motor of the mount with the ITF in a peculiar condition (LOW_NOISE_1 with OMC1 locked and DIFFp and PR loops in the same condition as in LOW_NOISE_3) and looking at B1p_DC and B1s2_DC spectrum.


It is hard to draw a definitive conclusion but as an attempt one could say that the most prominent lines excited via broadband injection (except for 133 HZ , 175 Hz and 198 Hz) on the local controls of SDB1 (either in z or angular) gets excited also when acting on the pico-motors of MMT_M1_TX, MMT_M2_TX, MMT_L1_Z and MMT_L3_Z mainly (Mmot2_TX, M1_TX and M2_TX seems to contribute also in the 273-293 Hz region).


It has to be noted that the three lines with no corresponding optics mount resonance frequencies, i.e. 133 Hz, 176 Hz and 198 Hz do not show up in DARM when injecting noise in z.

Could it mean that those lines are not related to diffused light but rather alignment issues as they rise when the angular d.o.f. are excited ?


Images attached to this comment
bertolini - 22:58 Monday 25 September 2017 (39570) Print this report
Based on the low frequency injections data from last week (39537), a rough estimate of the bench motion amplitude during the broadband noise excitation test on September 12th can be made.
At high frequency f, the SDB1 response along Tx and Tz can be approximated by ~4.4/f^2 [urad/V] while along Ty is ~5.6/f^2 [urad/V]. The response of the bench along Z is known already to be
~0.5/f^2 [um/V]. For a better estimate, the frequency response of the coil driver must also be taken into account; from the SPICE model of the circuit:
1
------------------------
(1+2e-3*s)*(1+1.5e-4*s)

The estimated bench motion during the noise injections is shown in the attached plot. The notch around 18Hz is due to a digital filter in the actuation path that prevents the excitation of the actuation coil support structure.
Images attached to this comment
tacca - 20:02 Tuesday 26 September 2017 (39581) Print this report

I made a comparison between the DARM spectrum during the different broadband noise injections and in a quiet condition (just before the injections). Meanwhile, I took the opportunity to compare the same spectra also with the DARM spectrum mesured last Sunday, September 24th around 20.00 UTC, when the BNS horizon was stable around 30 Mpc. I tried to focus not on all the peaks and structures excited by the noise injections, but only on the peaks that are present and visible also in the DARM spectrum in quiet conditions to understand if they are amplified by the injections. In all the following figures the blue curve is DARM during the noise injection, the purple curve is DARM in quiet conditions on September 12th and the gold curve is DARM on September 24th.

Figure 1 and 2 show DARM during the noise injection in Z. Peaks present in quiet conditions that seem to be aplified by the noise injection are:

  • Around 299-300 Hz. The peak seems to move and its amplitude on Spetember 24th is reduced with respect to Spetember 12th.
  • Around 377-378 Hz. The peak seems to be slightly amplified by the noise injection, but it disappears on September 24th.
  • Around 410 Hz. The peak seems to be slightly amplified and its width broadened by the noise injection; but it is clearly smaller on Spetember 24th.
  • All the other peaks and structures present in DARM in quiet conditions are either drowned in broadband structures or not amplified during the noise injection. Many structures disappear in DARM measured on September 24th.

Figure 3 and 4 show DARM during the noise injection in TX. Peaks present in quiet conditions that seem to be aplified by the noise injection are:

  • Around 100-101 Hz. The structure seems to be slightly amplified by the noise injection; the amplitude of the peak at 100 Hz is reduced on Spetember 24th.
  • Around 157 Hz. The peak is amplified by the noise injection, but it disappears on September 24th.
  • Around 410 Hz. The peak seems to be slightly amplified and its width broadened by the noise injection; but it is clearly smaller on Spetember 24th.
  • All the other peaks and structures present in DARM in quiet conditions are either drowned in broadband structures or not amplified during the noise injection. Many structures disappear in DARM measured on September 24th.

Figure 5 and 6 show DARM during the noise injection in TY. Peaks present in quiet conditions that seem to be aplified by the noise injection are:

  • Around 100-101 Hz. The structure seems to be slightly amplified by the noise injection; the amplitude of the peak at 100 Hz is reduced on Spetember 24th.
  • Around 157 Hz. The peak is amplified by the noise injection, but it disappears on September 24th.
  • Around 176 Hz. The structure is amplified by the noise injection, but it disappears on September 24th.
  • Around 195 Hz. The structure is amplified by the noise injection, but it disappears on September 24th.
  • Around 207 Hz. The structure is amplified by the noise injection, but it disappears on September 24th.
  • Around 370 Hz. The wide structure is amplified and its width broadened by the noise injection; but it disappears on Spetember 24th.
  • All the other peaks and structures present in DARM in quiet conditions are either drowned in broadband structures or not amplified during the noise injection. Many structures disappear in DARM measured on September 24th.

Figure 7 and 8 show DARM during the noise injection in TZ. Peaks present in quiet conditions that seem to be aplified by the noise injection are:

  • Around 100-101 Hz. The structure seems to be slightly amplified by the noise injection; the amplitude of the peak at 100 Hz is reduced on Spetember 24th.
  • Around 157 Hz. The peak is amplified by the noise injection, but it disappears on September 24th.
  • Around 176 Hz. The structure is amplified by the noise injection, but it disappears on September 24th.
  • Around 195 Hz. The structure is amplified by the noise injection, but it disappears on September 24th.
  • Around 207 Hz. The structure is slightly amplified by the noise injection, but it disappears on September 24th.
  • Around 370 Hz. The wide structure is amplified and its width broadened by the noise injection; but it disappears on Spetember 24th.
  • All the other peaks and structures present in DARM in quiet conditions are either drowned in broadband structures or not amplified during the noise injection. Many structures disappear in DARM measured on September 24th.

The broadband noise injections clearly excited many peaks and structures but most of them were not present in quiet conditions. It could suggest that the motion of the bench in standard quiet conditions is small enough, i.e. the motion of the bench seems to NOT be the cause of the peaks and the structures.

After the work made during the last two weeks, especially on the search for the best ITF working point and on the improvement of the Automatic Alignment control, many of the structures present in DARM disappeared. It could suggest that the "jitter" of the beam (and of the spurious/secondary beams) that is reaching SDB1 and its "optical path" on the bench have a large impact on the origin of the structures in DARM, reducing the range for the proper working point and increasing the requirements on the alignment. Repeat the noise injections whit the ITF in the new working point with the improved alignment control could give more hints.

Images attached to this comment
bertolini, tacca - 15:23 Thursday 28 September 2017 (39610) Print this report

We checked data about the excitations made using single picomotors on the different mecahnical mounts. We expected to see clear and quite narrow resonance frequencies peaks appearing in the spectra exicitng a mount giving a "kick" with a picomotor. We checked the behavior of the B1p_DC and B1s2_DC spectra. The two beams B1p and B1s2 have a part of their optical path in common, from the menisucs lens SDB1_MMT_L1 to the mirror SDB1_M3, where the B1p beam is extracted (for reference see figure 1). Therefore, we could expect that any excitation on the optical components on the B1s2 path made after the mirror SDB1_M3 will not affect the B1p spectrum. Then, two beams cross themselves in the minilink between SDB1 and SDB2.

In the following figures there are the spectra acquired for the excitation made on the optics from the first component on the bench, MMT_L1, up to the OMC:

  • Figure 2 shows the spectra induced by the excitation on SDB1_MMT_L1_Z: a broadband structure is visible above 200 Hz in the whole bandwidth in B1s2 spectrum; few narrower structures are visible in B1p spectrum.
  • Figure 3 shows the spectra induced by the excitation on SDB1_MMT_M1_TX: a broadband structure is visible above 200 Hz in the whole bandwidth in B1s2 spectrum; a broadband structure above 200 Hz is visible also in B1p spectrum.
  • Figure 4 shows the spectra induced by the excitation on SBD1_MMT_M2_TX: few structures are visible between 200 Hz and 400 Hz and a broadband structure is visible above 400 Hz in the whole bandwidth in B1s2 spectrum; few narrower structures are visible in B1p spectrum.
  • Figure 5 shows the spectra induced by the excitation on SDB1_Md_TX: few structures are visible above 500 Hz in B1s2 spectrum; nothing is visible in B1p spectrum.
  • Figure 6 shows the spectra induced by the excitation on SDB1_M1_TX: few structures are visible between 200 Hz and 500 Hz and a broadband structure is visible above 500 Hz in the whole bandwidth in B1s2 spectrum; some narrower structures are visible in B1p spectrum.
  • Figure 7 shows the spectra induced by the excitation on SDB1_M2_TX: few structures are visible between 200 Hz and 500 Hz and a broadband structure is visible above 500 Hz in the whole bandwidth in B1s2 spectrum; three narrower structures are visible in B1p spectrum.
  • Figure 8 shows the spectra induced by the excitation on SDB1_MMT_L2_Z: few structures are visible above 800 Hz in B1s2 spectrum; nothing is visible in B1p spectrum.
  • Figure 9 shows the spectra induced by the excitation on SDB1_MMT_L3_Z: a broadband structure is visible above 200 Hz in the whole bandwidth in B1s2 spectrum; few narrower structures are visible in B1p spectrum.
  • Figure 10 shows the spectra induced by the excitation on SDB1_M4_TX (mirror ONLY on B1p optical path): a broadband structure is visible above 400 Hz in the whole bandwidth in B1s2 spectrum; few narrower structures are visible in B1p spectrum.
  • Figure 11 shows the spectra induced by the excitation on SDB1_MMot1_TX (mirror ONLY on B1s2 optical path): a broadband structure is visible above 400 Hz in the whole bandwidth in B1s2 spectrum; some narrower structures are visible in B1p spectrum.
  • Figure 12 shows the spectra induced by the excitation on SDB1_MMot2_TX (mirror ONLY on B1s2 optical path): a broadband structure is visible above 300 Hz in the whole bandwidth in B1s2 spectrum; some narrower structures are visible in B1p spectrum.
  • Figure 13 shows the spectra induced by the excitation on SDB1_OMC_Z (ONLY on B1s2 optical path): a broadband structure is visible above 100 Hz in the whole bandwidth in B1s2 spectrum; nothing is visible in B1p spectrum.
  • Figure 14 shows the spectra induced by the excitation on SDB1_OMC1_Ref2_TX (mirror neither on B1s2 nor on B1p optical paths): a broadband structure is visible above 100 Hz in the whole bandwidth in B1s2 spectrum; some structures are visible in B1p spectrum.
  • Figure 15 shows the spectra induced by the excitation on SDB1_OMC2_Ref1_TX (mirror ONLY on B1s2 optical path): a broadband structure is visible above 200 Hz in the whole bandwidth in B1s2 spectrum; some structures are visible in B1p spectrum.

A broadband structure on the B1s2 spectrum is excited acting on the picomotors of almost all the mechanical mounts, while very few narrow structures are visible only on the B1p spectrum This seems to suggest that "kicking" the mounts using the picomotor is moving the beam increasing its "jitter" along the path, not exciting the resonances of the single mounts, which are NOT clearly visible in the spectra.

An interesting result is the broaddband structure visible on B1s2 when the mirror SBD1_M4 is excited, while this mirror is not on its optical path. Other interesting results are the broaddband structure visible on B1s2 and the structures visible on B1p when the mirror SBD1_OMC1_Ref2 is excited, while this mirror is not on these optical paths. On the other hand, few structures are visible on B1p exciting SDB1_Mmot1, SDB1_Mmot2 and SDB1_OMC2_Ref1, while these mirrors are not on the optical path. This suggests that light from one path is coupling with the other one slightly moving the beam (almost everywhere).

Images attached to this comment
Search Help
×

Warning

Error

The present report has been modified outside this window. Please check for its integrity in the main page.

Refreshing this page will move this report into drafts.

×