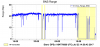
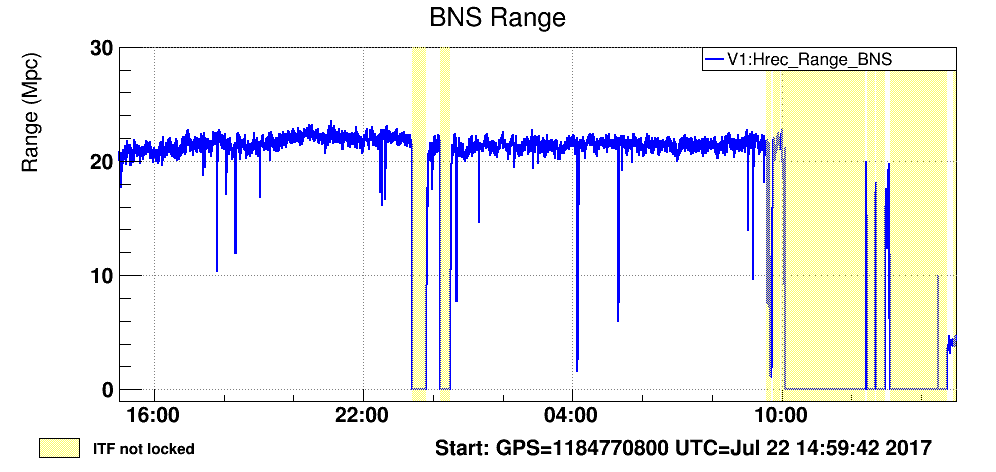
was between 21 and 22 Mpc (plot1), I tried to have a closer
look at the bumps in the spectrograms and the glitches located
around some frequencies.
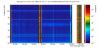
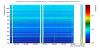
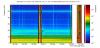
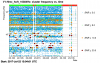
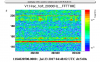
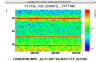
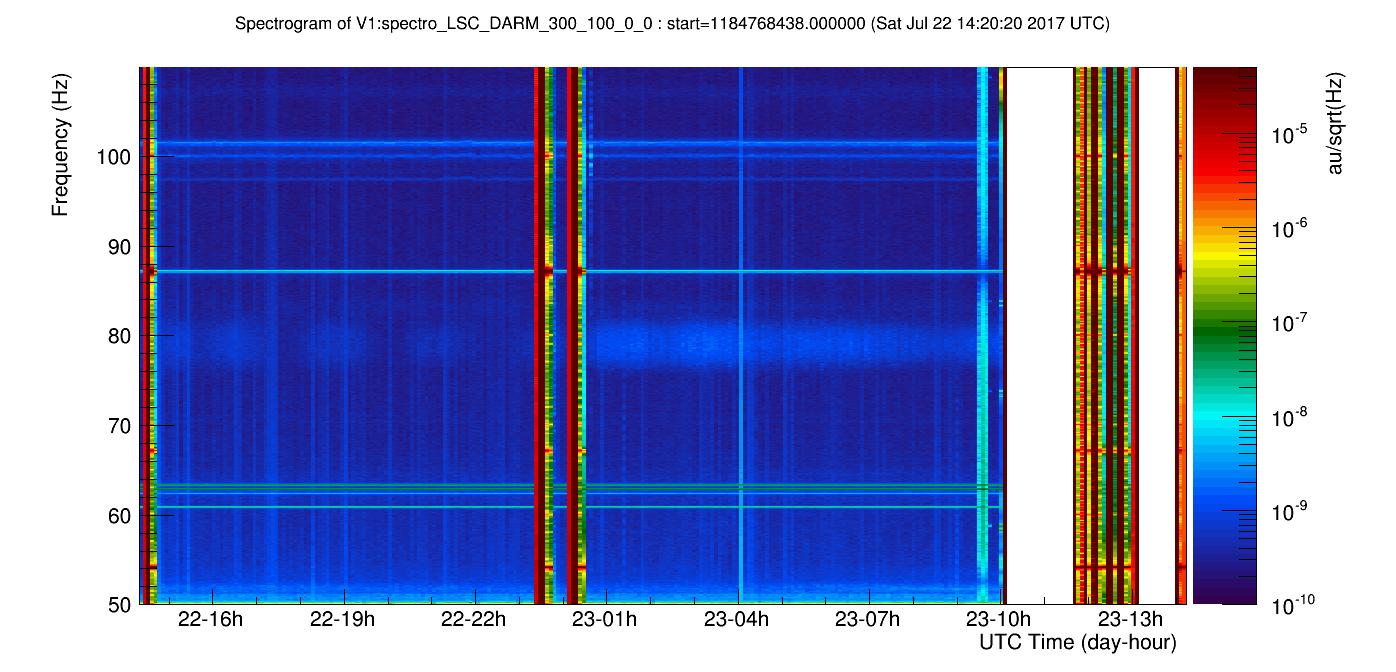
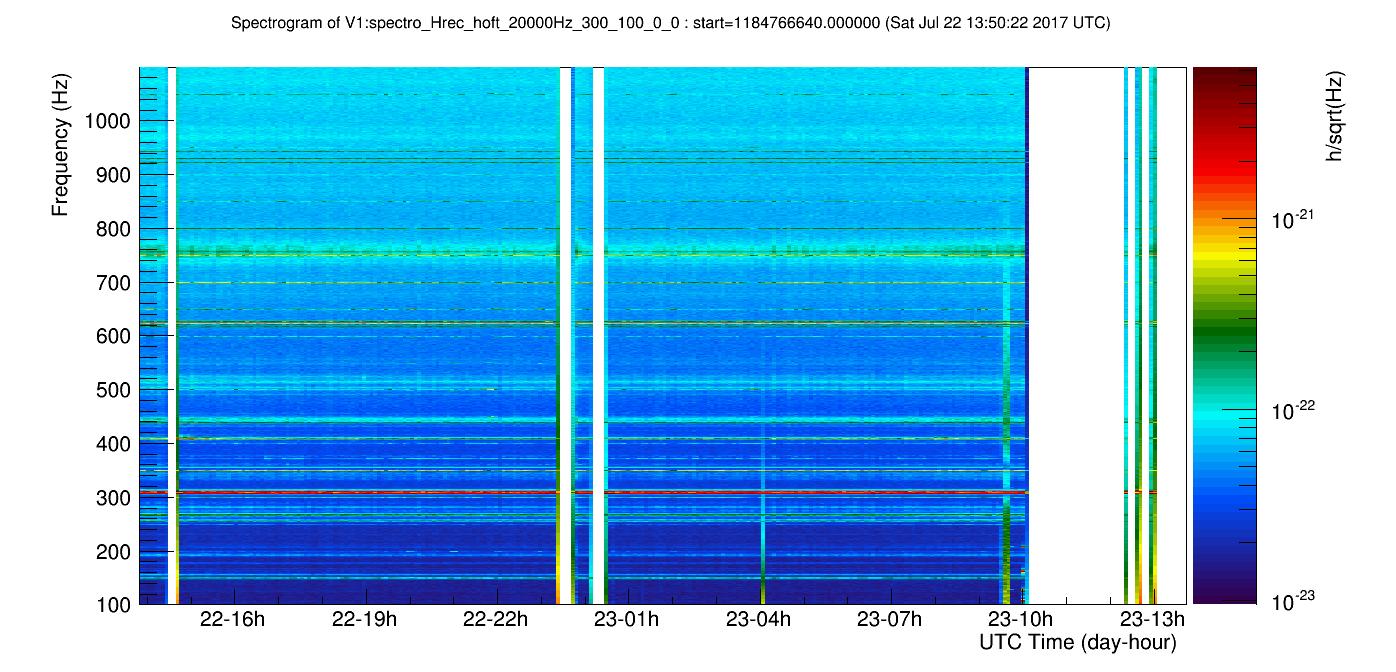
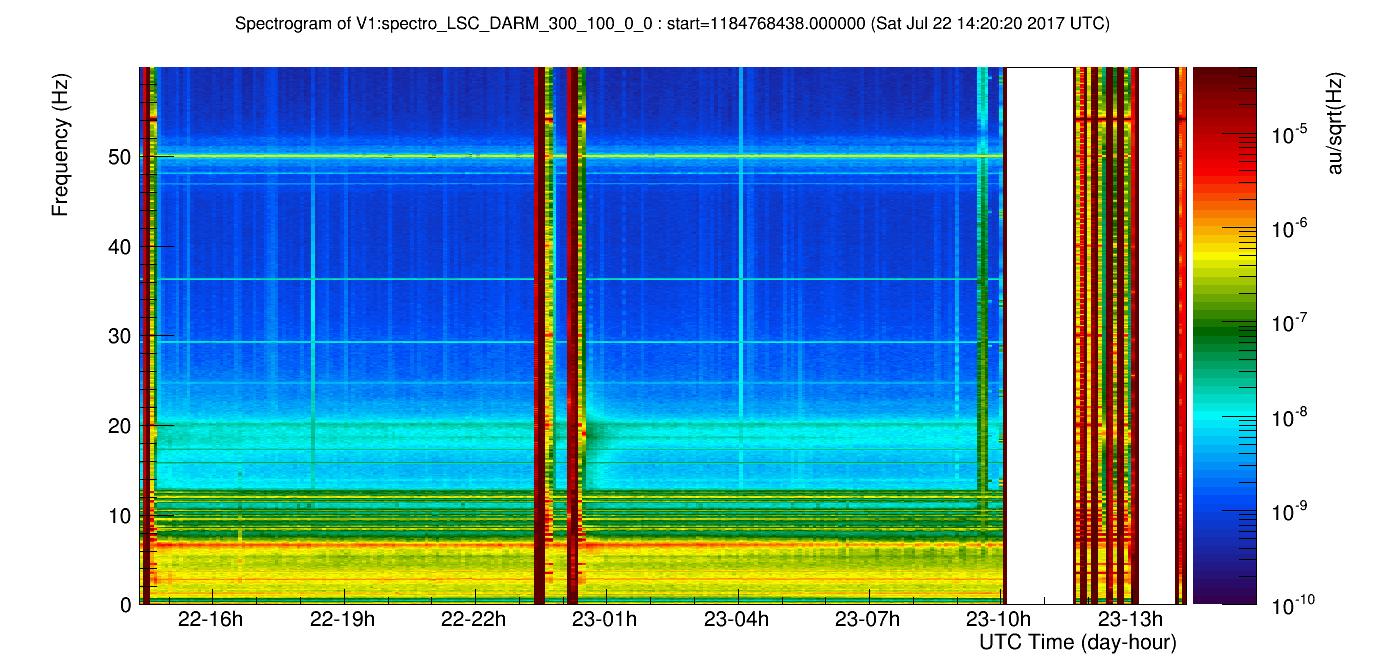
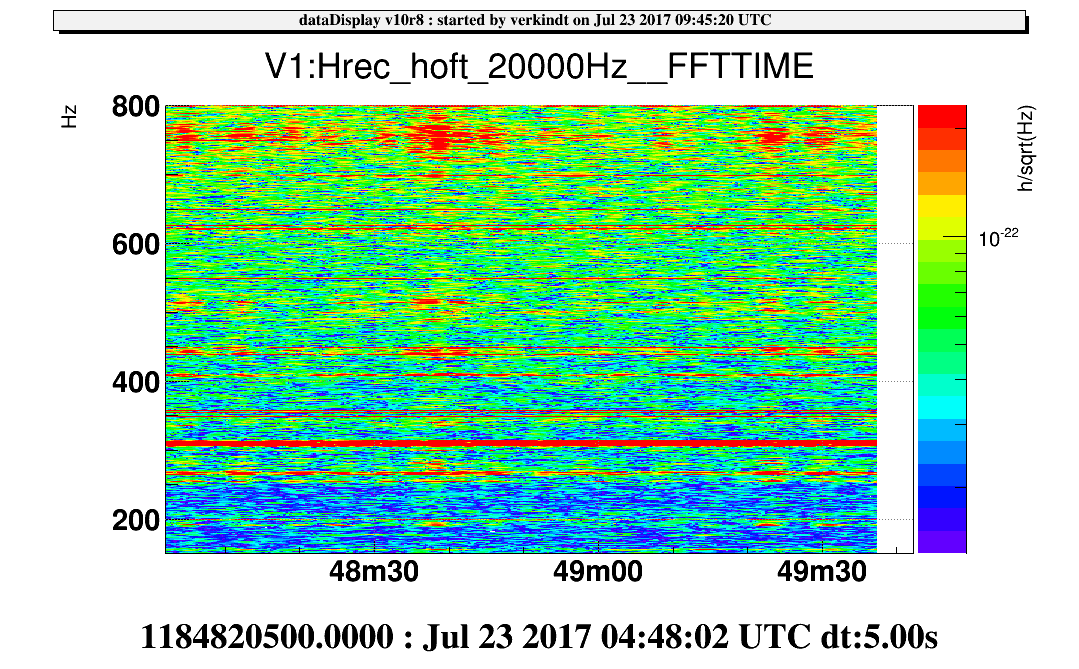
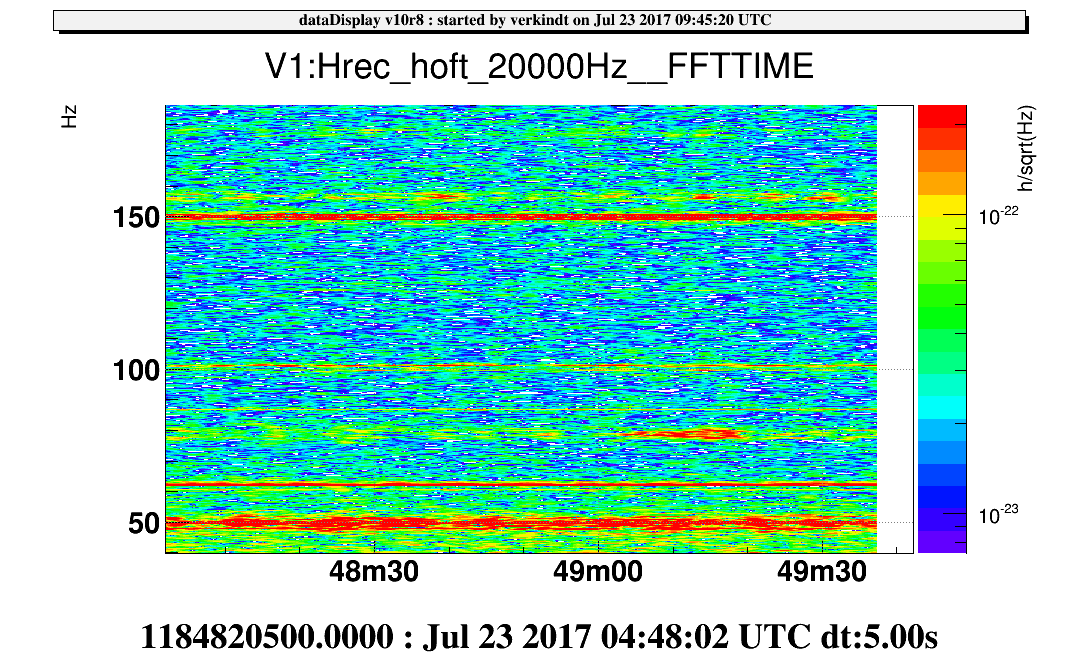
Plots 2,3,4 show spectrograms where are visible:
- a non-stationary large bump around 80 Hz
- but also bumps at 50Hz, 101Hz, 155Hz, 270 Hz, 400 Hz, 510 Hz, 750 Hz...
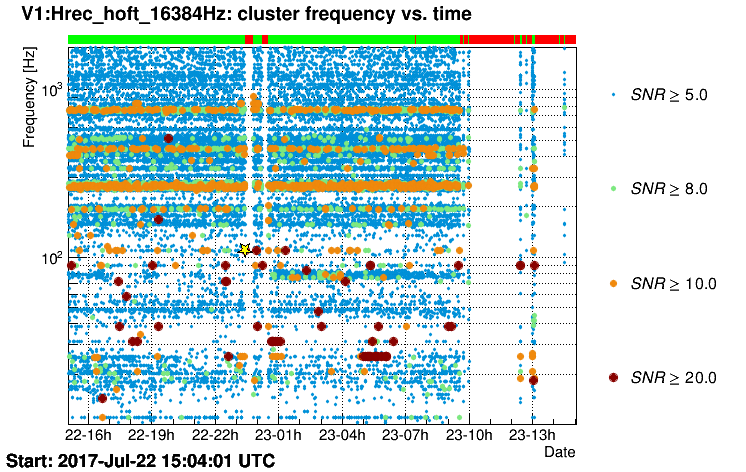
Plot 5 shows Omicron triggers where lines of glitches (orange, green or blue)
visible around 50Hz, 80Hz, 101Hz, 165 Hz, 270 Hz, 430 Hz, 750Hz.
We can suspect those glitches to be due to the non-stationarity of
the bumps near the same frequencies.
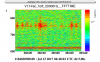
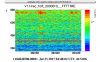
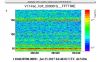
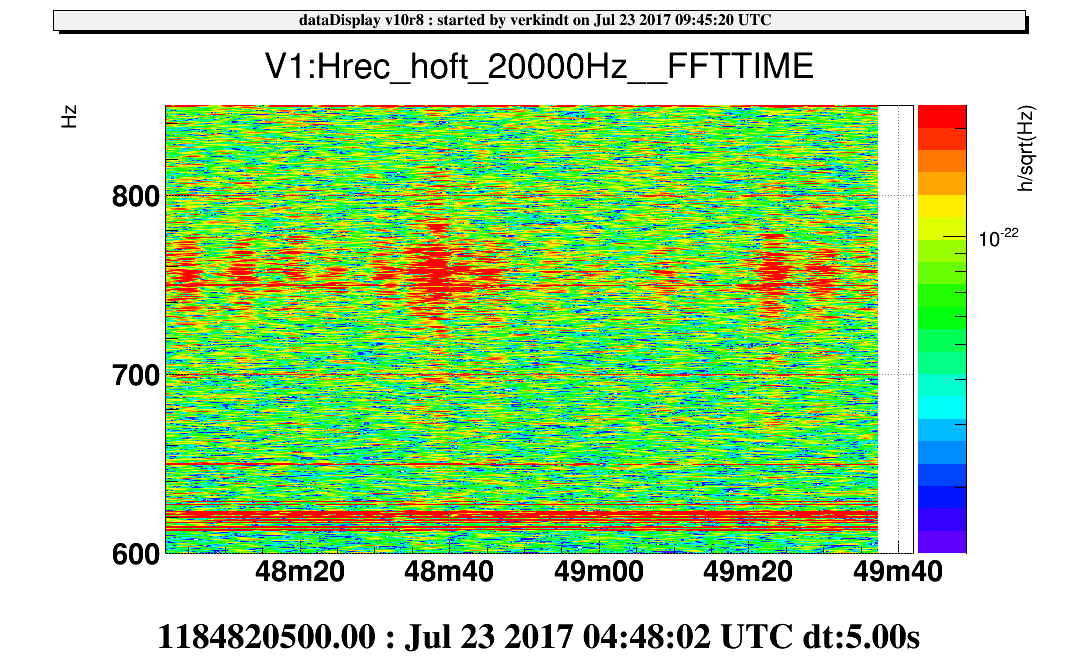
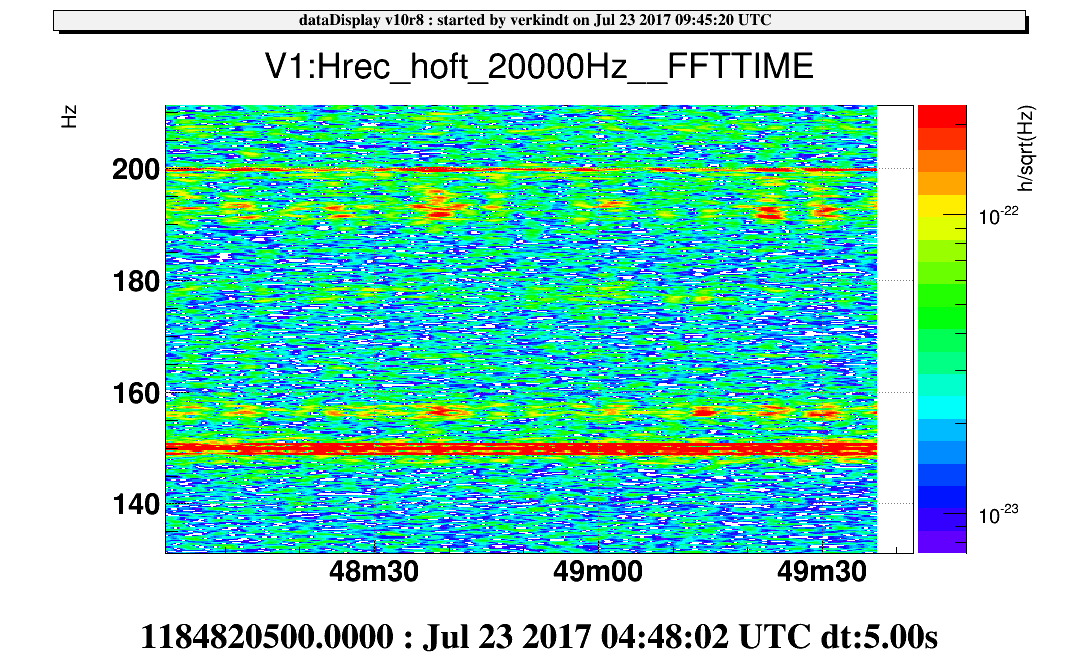
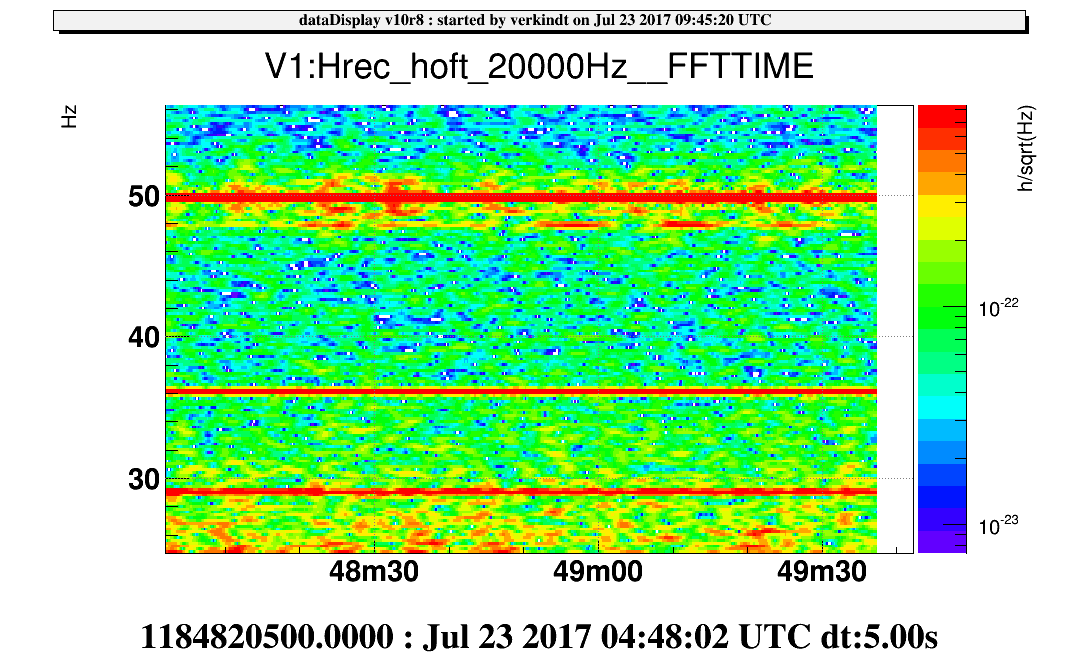
Plots 6,7,8 show dataDisplay spectrograms giving a closer view
to the bumps and their fluctuations over a 100sec time scale.
Plot 6 shows the 750 Hz bump which is clearly associated to the
glitches around this frequency.
Plot 7 shows that bumps around 192Hz, 270Hz, 440Hz or 510Hz have the same
fluctuations as the 750Hz bump. The guess is that several glitches around
those frequencies have the same origin as the glitches around 750Hz.
Plot 8 shows that the 155Hz bump is of the same family while the 80Hz bump
has a different origin.
Plot 9 shows a closer look at the 155Hz and 192Hz bumps.
Plot 10 shows a closer look at the fluctuations of the bumps around
the 50Hz line and below 30Hz. Their fluctuations does not seem correlated
neither between each other nor with the 750Hz bump fluctuations.
A good progress in the sensitivity and in the glitchiness could come
from finding the common origin of the 155Hz, 192Hz, 270Hz, 440Hz, 510Hz, 750Hz
non-stationary bumps.