In order to find more signals useful for the pre-alignment of the North arm cavity, the possibility of extracting the amplitude of the 01/10 modes from the cavity free swinging was explored. Indeed, the order 1 modes arise when the cavity is affected by misalignment with respect to the input beam.
Moreover, information about both cavity alignment and matching can also be extracted from the amplitude of the order 2 mode. Therefore, an algorithm was developed in order to automatically extract their amplitude in time.
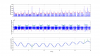
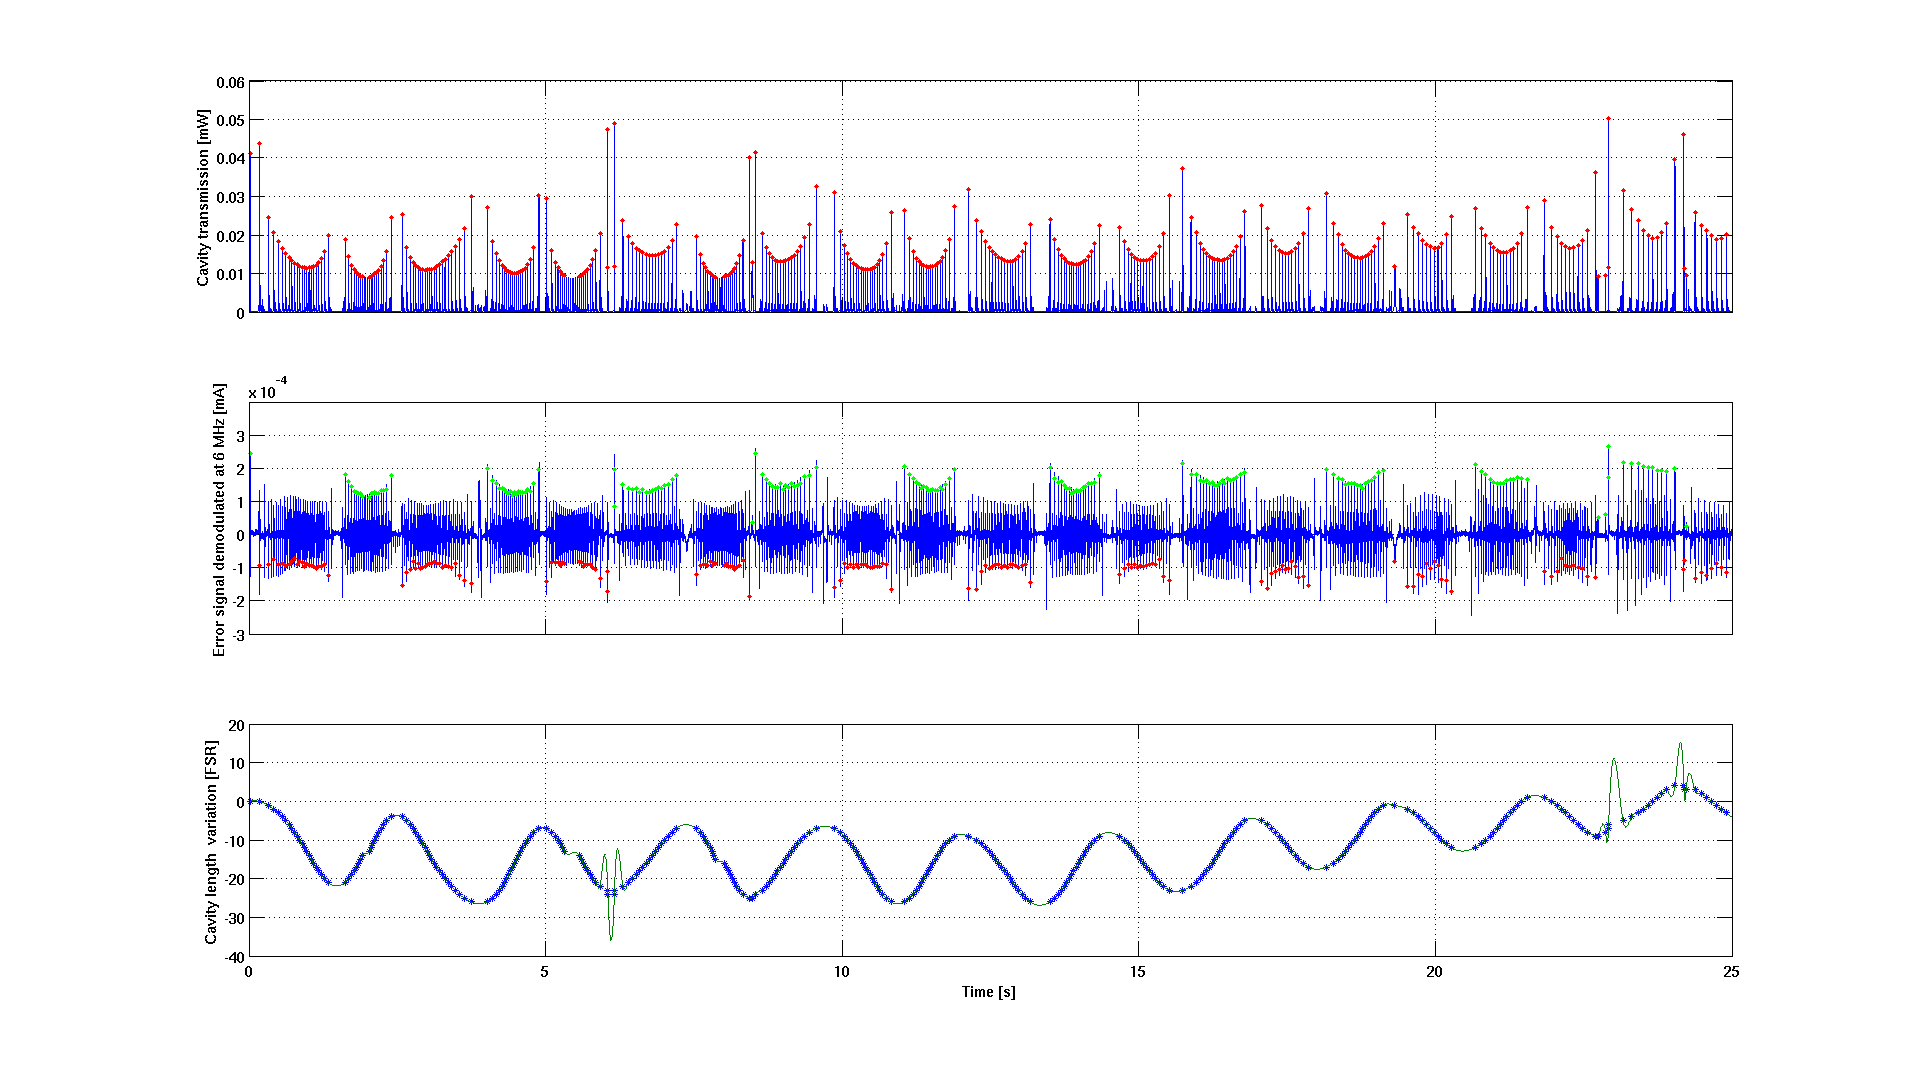
A cavity free swinging dataset was analyzed right after a cavity unlock: this allowed to have very clear fringes due to the excitation of the cavity length after the unlock. The analyzed dataset is show in figure 1, and the starting GPS is 1152539840 (for a duration of 25 sec).
First, the carrier peaks where identified, and they are shown as red dots in the first subplot of figure 1. This allowed to split up the dataset in shorter subset, each containing one free spectral range.
In order to reconstruct the cavity length and velocity, the sign of the error signal corresponding to each peak was used. Notice that the sign of the error signal at the resonance peak position and not the sign of its slope at the zero-crossing was used: it is because, due to the ringing effect, the zero crossing of the error signal does not correspond exactly to the carrier peak. In subplot 2, of Figure 1, the error signal is shown, while in the third subplot the cavity length in FSR is plotted. The latter plot highlights the cavity oscillation, with a frequency of about 0.4 Hz.
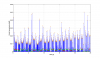
For each free spectral range the amplitude of the modes of order 1 and order 2 were extracted. In figure 2 the amplitude of modes of order 1 and order 2 are shown as red and green stars, respectively.
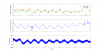
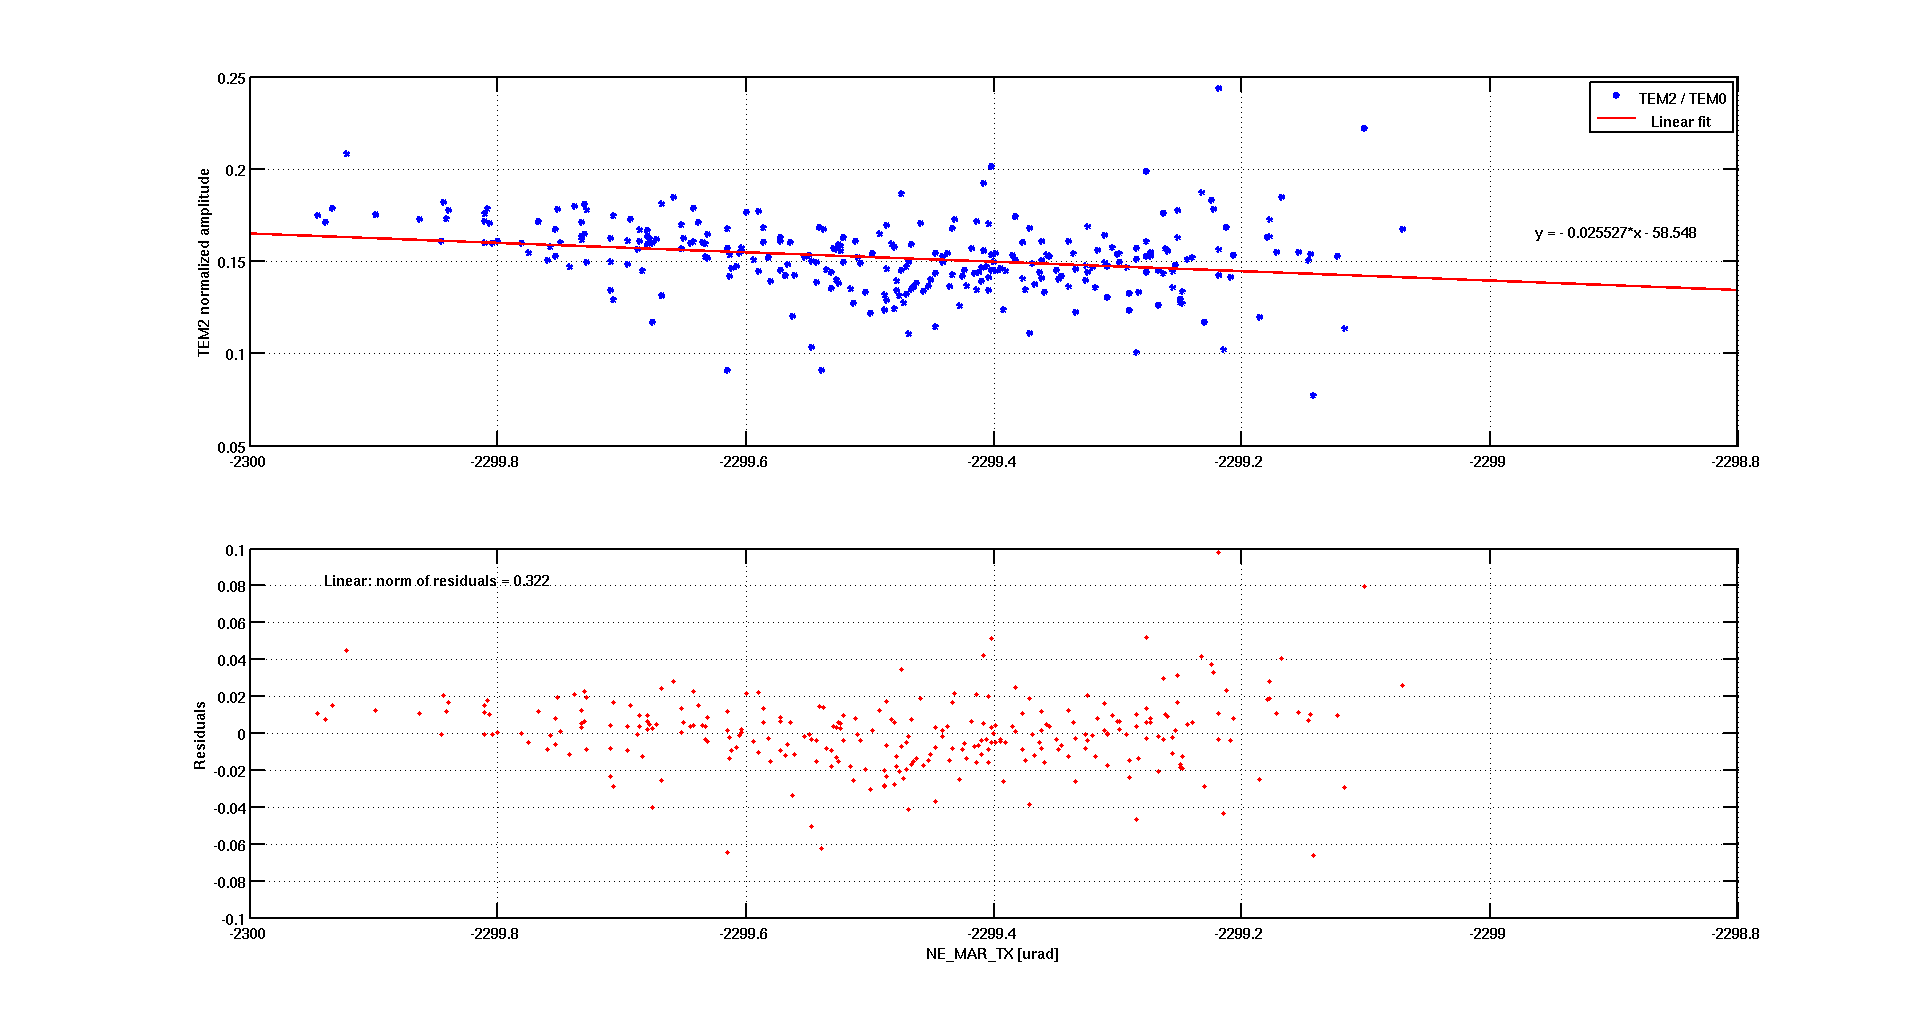
In the first plot of figure 3 the trend of the amplitude of the TEM1 and TEM2 peaks normalized to the closest TEM0 is plotted. While the TEM2 seems not to vary significantly with the cavity length (reported in the second subplot), the TEM1 shows some variation. In order to find a correlation between the high order modes peaks trend and the mirrors angular motion, the suspension signals for Input and End mirrors were investigated, although the actuation for the previous lock was performed only on the End mirror. In particular, it was found that the NE motion shows up in the tx mirror oscillation, as expected. In the third subplot is shown the NE_MAR_TX signal.
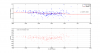
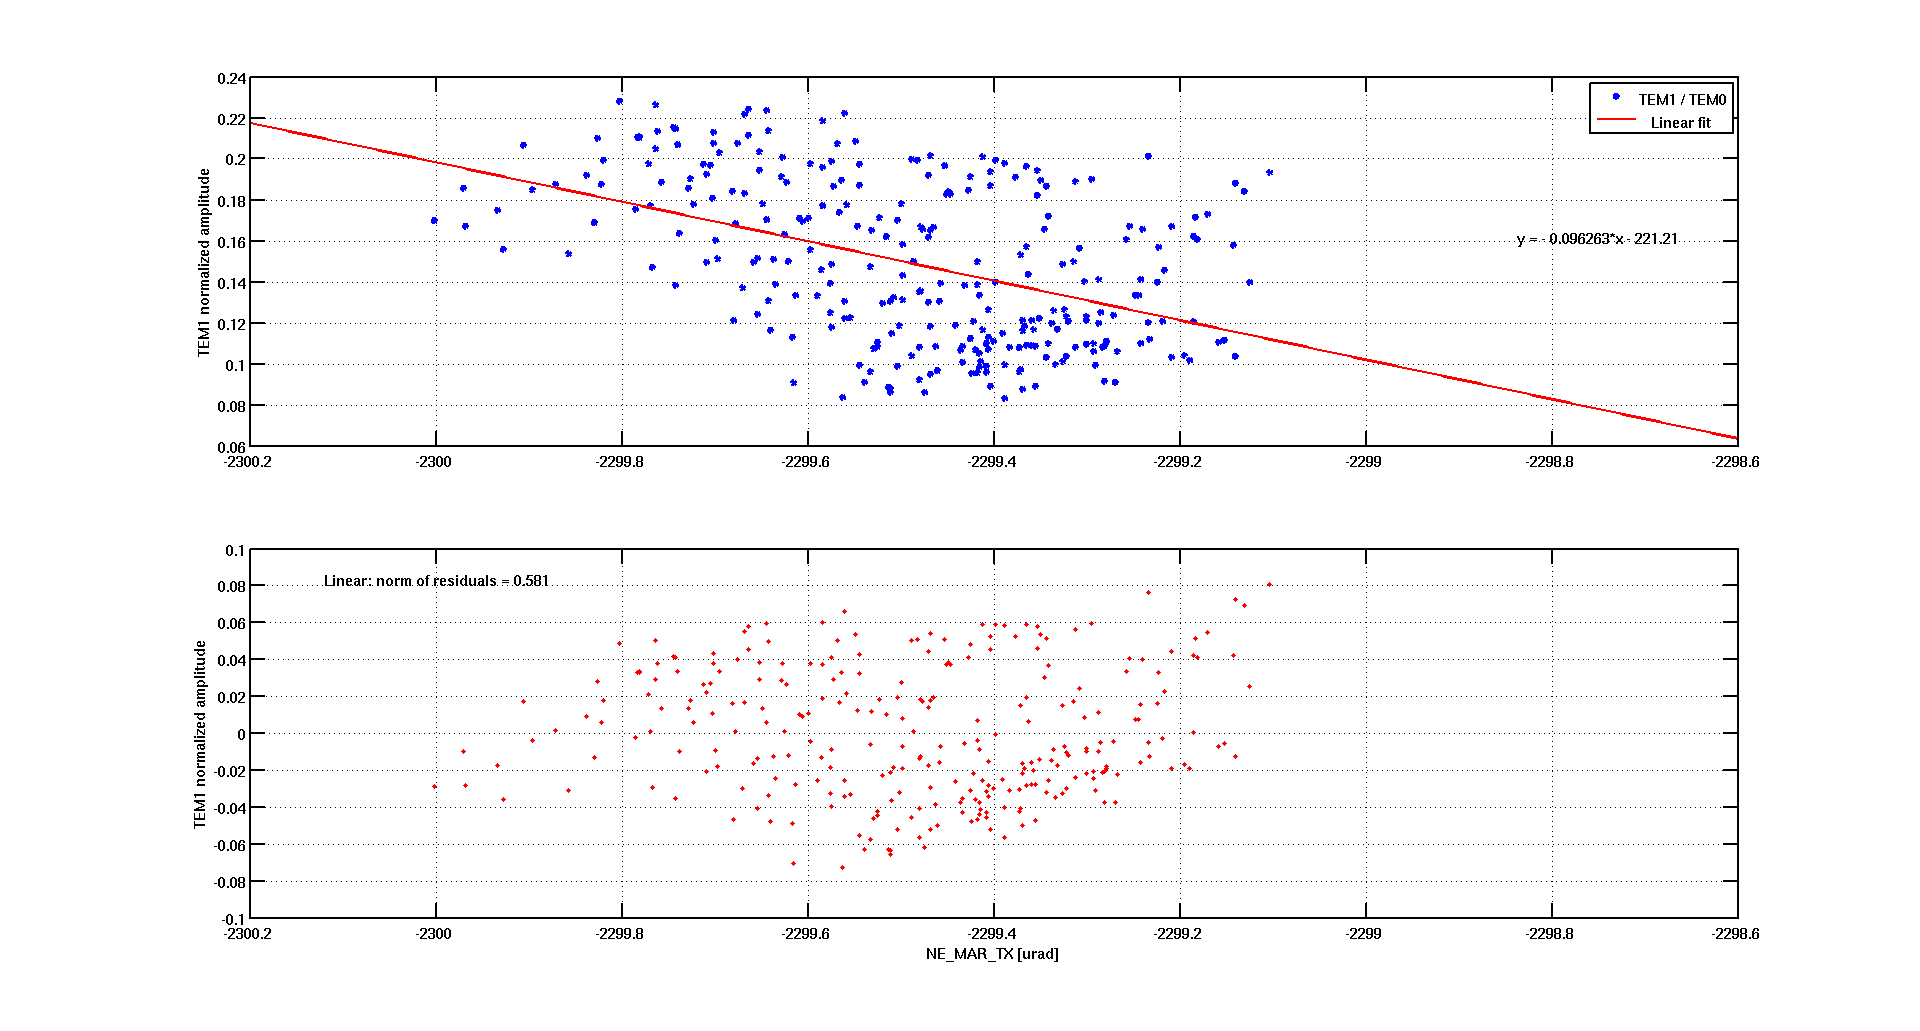
Finally, the TEM1 and TEM2 peaks were plotted against the NE_MAR_TX mirror motion and are shown in figure 4 and 5, respectively.
In particular, let's focus on the order 1 modes, which are directly related to the cavity misalignment. The TEM1 normalized peaks distribution has a small slope: this information can be used as error signal to pre-align the NE mirror tx tilt, which is the value minimizing the peak amplitude.
Having this correlation, we are exploring the possibility to generate these error signals for the implementation of an automatic control loop for the the cavity pre-alignment.
