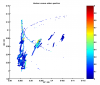
The best horizon (ignoring some single points) has so far been achieved with WI a bit above half fringe and NI either at minimum or a bit above. There is however not enough statistics to clearly state which is the best position. We might have been unlucky with weather conditions or maybe a possible gain in sensitivity was masked by problems related to a high finesse asymmetry, which could potentially be cured. It seems however easy to say that the bottom-left corner, where we spent most of the run so-far, is not the best position.
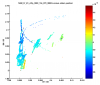
Figure 2 is a similar plot, but now with the rms in the band 270-328 Hz as calculated by NonStatMoni, lower values are better. This is probably the lowest frequency-band that is limited by shot-noise and is not spoilt by other non-stationary noise sources. This graph seems to confirm more to the theory, which says that we should go to the upper left corner. We should probably explore the upper left quadrant of this graph in the coming weeks, not only the exact corner.