The attached plot shows an example of the impact of DAS tuning on carrier contrast defect. Carrier contrast defect is computed as the ratio of calibrated B4 power to calibrated B1p carrier power, where the fraction of carrier in B1p is extracted from the B1p phase camera. Data refer to the DAS tuning done after WE mirror replacement, and span from June 10 to August 17 2025, i.e. after the ETM RH tuning was over.
Here's another example dating back to input laser changes in early 2024, when a 50% improvement in contrast defect follwed a tuning of WI DAS power.
The example from early 2024 is not very clean, as there is a differential change in EM RH correction 3 hours before the DAS power change. The RH response is delayed and has a few hours long time scale, so the effect othe DAS change will overlap with change in B1p carrier power due to EM RH which is well understood and modeled.
A somewhat cleaner recent example of B1p power change with DAS tuning in LN3 is from the tuning to try to recover from the not understood change in interferometer state in October: https://logbook.virgo-gw.eu/virgo/?r=68015
One needs to be wary of using the phase camera for quantative analysis as the phase camera status is not being monitored.
Figure 1. After the EDB OMC installation in April the B1p phase camera has been realigned, but then the alignment has drifted over the following few months, with the power on the phase camera dropping by a factor 3, likely the reference beam is not well centered on the photodiode anymore. The normalized channels remove some of that effect, but it may biased for large changes in power by a factor few, and the normalized channels may not be the ones used in all analysis. It is probably the explanation for the trend in carrier contrast defect reported by Fiodor in VIR-1178A-25.
The conclusion that in LN2 a significant fraction of the power on the dark fringe is due to the 56MHz sidebands is in disagreement with the EDB OMC measurements.
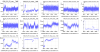
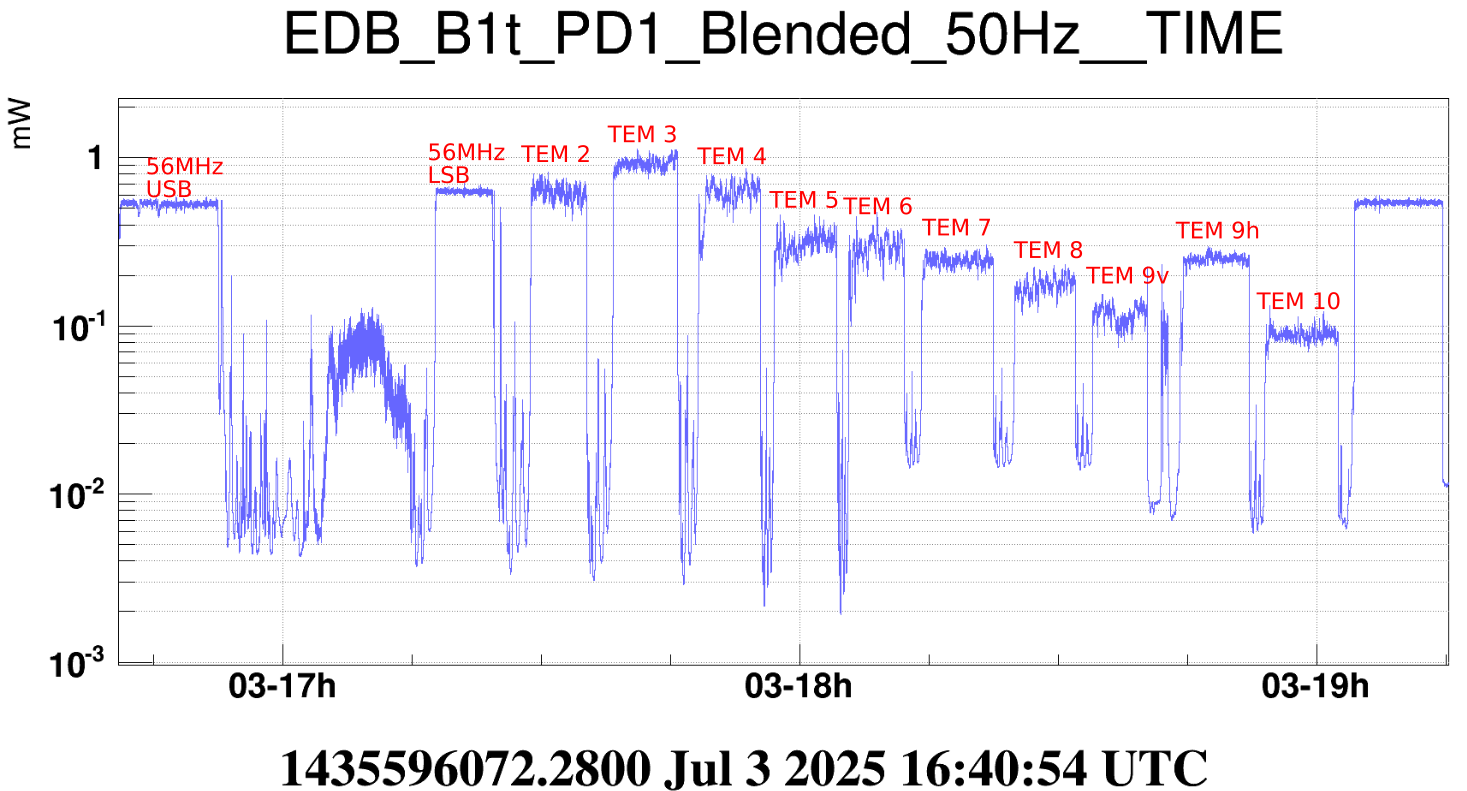
Figure 2 shows the EDB OMC transmitted power when locked on the 56MHz sidebands and on the higher order modes. The OMC alignment was performed in 4 degrees of freedom by maximizing the 56MHz USB transmission, and minimizing the beam jitter coupling when locked on that mode.
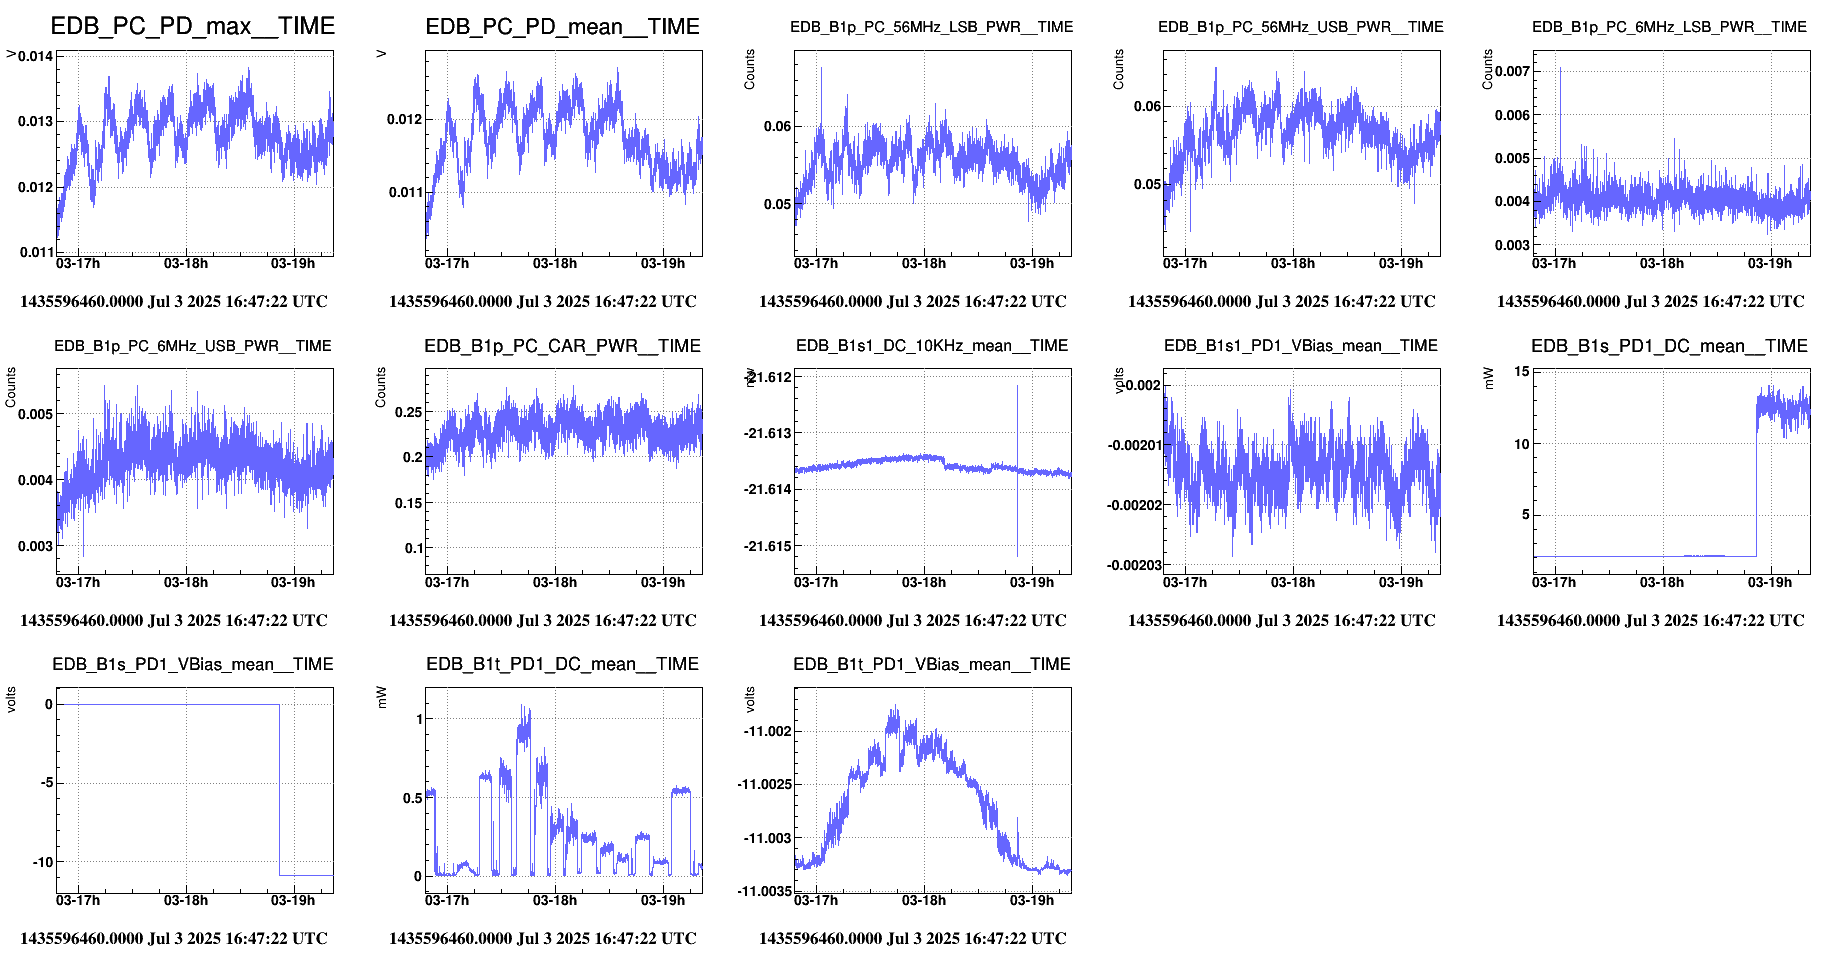
Figure 3 shows that during that measurement the total power arriving on the EDB OMC was ~12.5mW, while there is ~0.5mW in transmission of the OMC when it is locked on the 56MHz LSB or USB. This would mean that the total power of the sidebands is ~1mW, or 10% of the total power on the dark fringe.
Figure 4. During the EDB OMC installation it was locked in single bounce, the alignment was not perfect, but it shows that the cross-calibration of B1s and B1t photodiodes is roughly correct, when 2.2mW of power disappears from the OMC reflection (B1s) it appears instead on the OMC transmission (B1t).
Some of the 56MHz sideband power can be in higher order modes instead of the TEM00, but that should not be significant as the other higher order modes shown on Figure 2 have power less than 0.1mW, so less than 1% of the total power arriving on the OMC. Note that the unlabelled mode just right from the 56MHz LSB is the carrier order 1 mode.
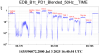

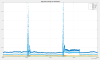
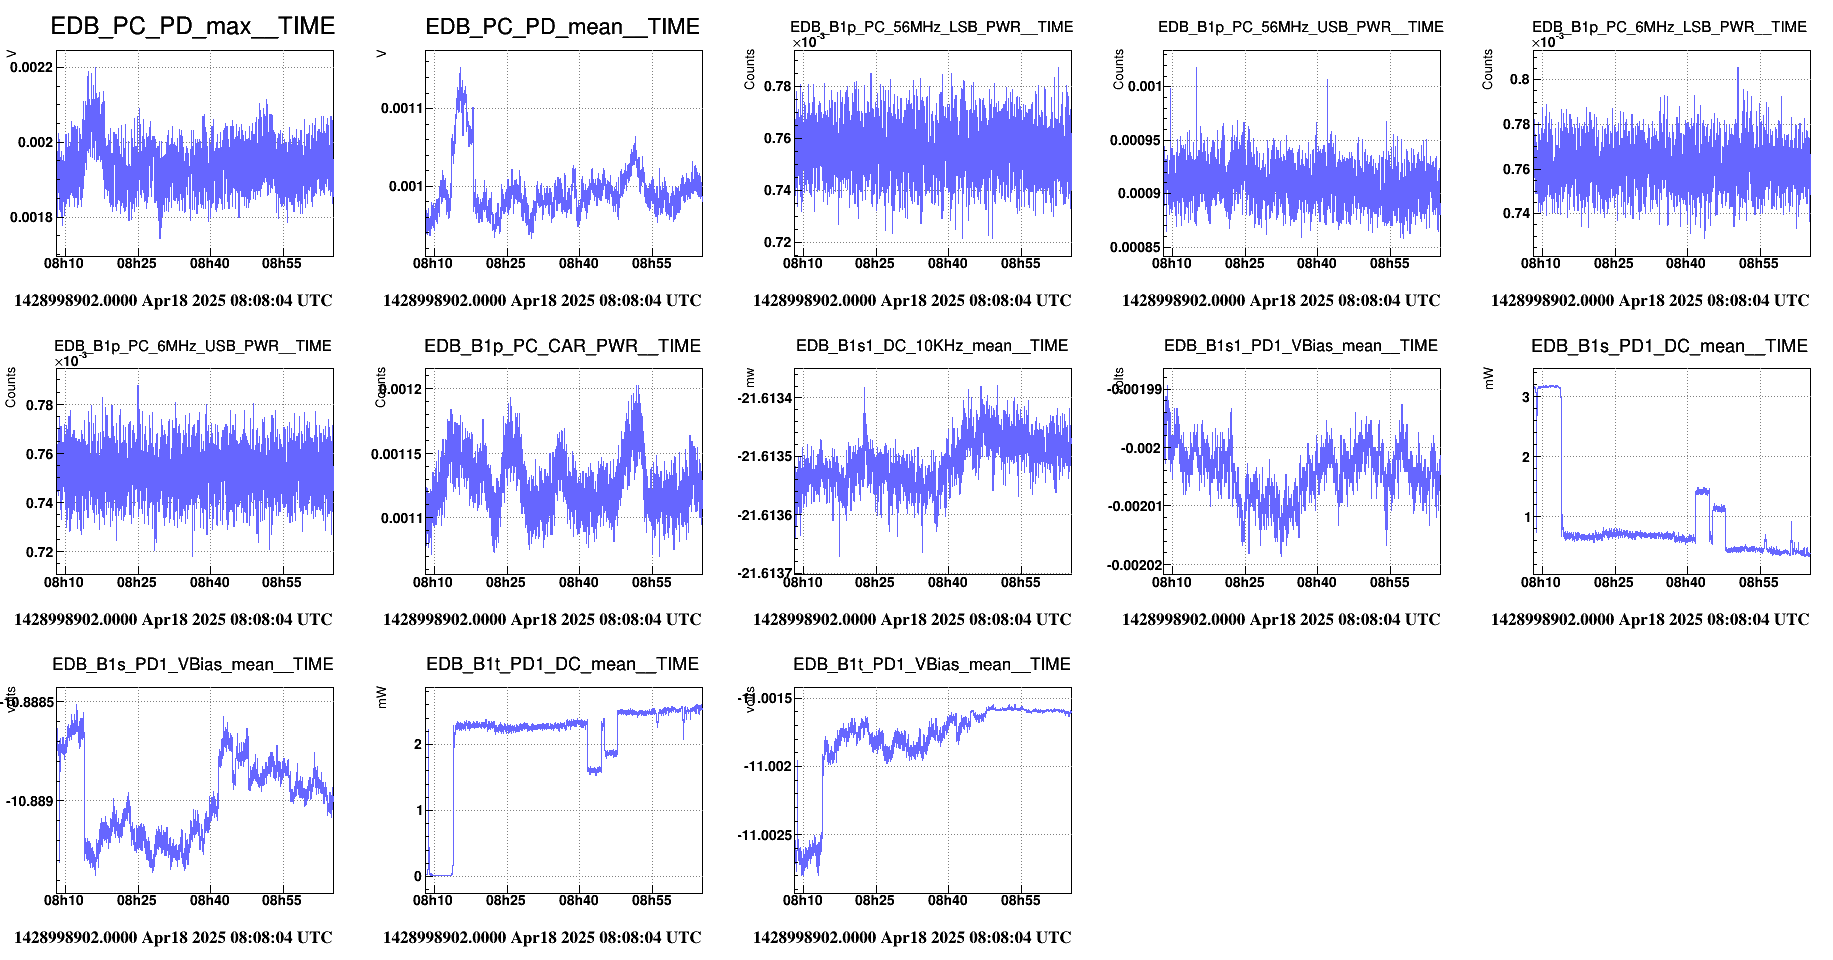
Indeed the data from EDB OMC scan, if properly analysed, confirm phase camera data about 56 MHz sidebands to contribute significantly to dark fringe power. The total power on carrier HOMs up to order 10 in the July 3 scan (first attached plot) is about 4 mW. The plot includes 56 MHz fundamental modes which amount to about 1 mW, but it lacks 56 MHz HOMs. Typical powers for 56 MHz HOMs can be seen in other scans of the EDB OMC, e.g. from July 25, see red arrows in the second attached plot. A conservative estimate for the 56 MHz HOMs up to order 10 is around 2 mW including upper and lower sidebands; so the total power from the 56 MHz on B1p is around 3 mW including TEM00 and HOMs up to order 10, which is about 75% of the carrier power up to HOMs order 10.
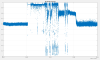
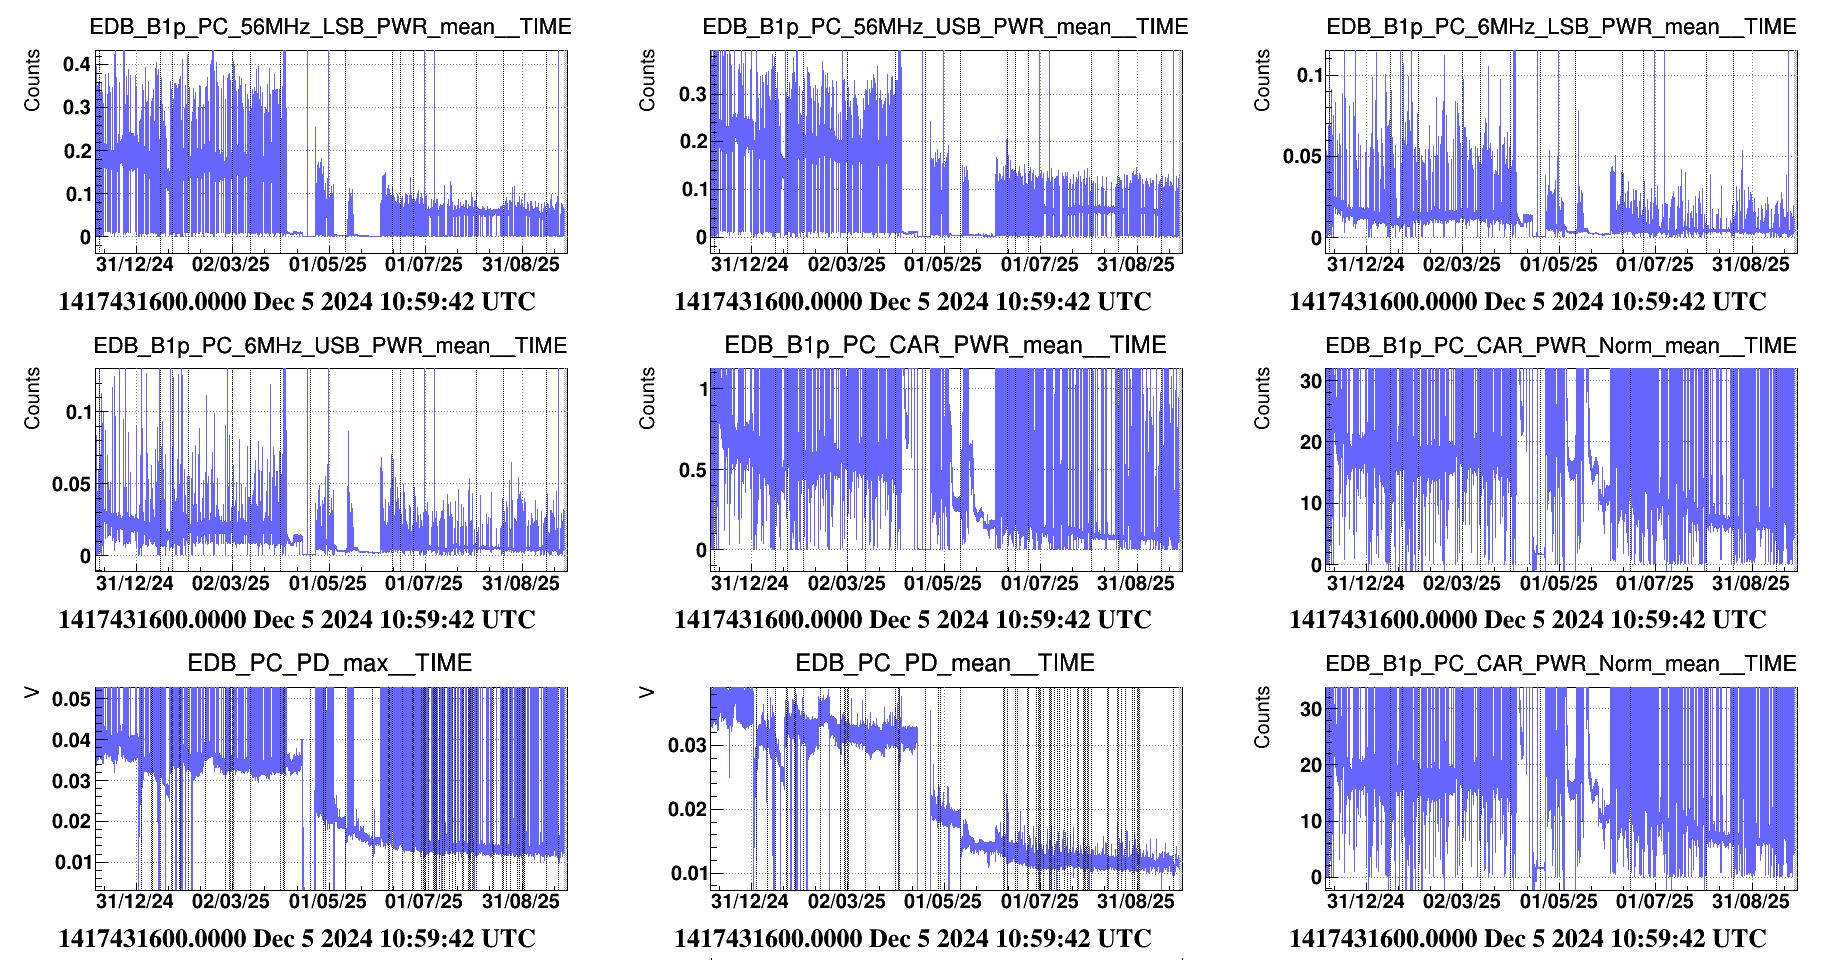
For comparison, the power ratio between 56 MHz sideband and carrier measured from phase camera data is about 50% in LN2, and increases to about 100% in LN3, see third and fourth plot in attachment. The sum of PC signals for carrier and sidebands matches B1p photodiode quite well when dark fringe power drops in the LN2-LN3 transition. Using normalised phase camera signals or not concerns total power only, and does not make any difference when calculating the power ratio between carrier and SBs.


A proper analysis of the OMC transmission spectrum requires looking directly at the data, and more effort and critical thinking than just adding arrows on an existing figure made for a different purpose. The peaks that are highlighted with the arrows are not the HOM of the sidebands, these are the carrier HOM of order between 13 and 21. These modes are located about halfway in between the lower order modes (modes 1-11) as expected, as the OMC FSR is almost exactly 11.5 times the spacing between higher order modes. The spacing between HOM is ~72MHz, which means that the HOM of the 56MHz sidebands are 16MHz below and above the HOM of the carrier, about +/- one quarter of the spacing between HOM, and not halfway between the spacing of HOM.
An example of a more detailed analysis of OMC scans in CARM NULL 1F can be found here: https://logbook.virgo-gw.eu/virgo/?r=58613, it shows the position of the sidebands and of the carrier HOM between 1 and 21. All of the other modes are below thes 21 modes, with the exception of sidebands TEM00 modes. In addition it shows that just measuring the height of a peak doesn't allow to measure the power of a HOM, because the OMC has an astigmatism that is resolved by its finesse of 1000. Starting from the order 2 mode the modes are increasingly split, and start to look like increasingly wide bandpass functions. A crude upper limit for that would be to multiply the height of the peak by the order of the mode, so for example for the order 9 mode multiply the peak height by 9 as there are actually 9 modes next to each other. A more accurate analysis would be to integrate the area under each peak. However, the scans of the EDB OMC where done on purpose too fast to be linea in order to have a measurement within the ~30 minute of each IPATSiA pointing, which means that a proper integration will not work as the time axis is not proportional to the OMC length.
An example of looking more on the power of the 56MHz sidebands HOM in CARM NULL 1F: https://logbook.virgo-gw.eu/virgo/?r=60924 , shows 10% of the power in the order 1 mode, and 6% of the power of the order 2 mode. So most of the 56MHz sideband power is in the TEM00 mode.
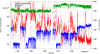
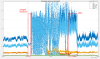
So putting the arrows in the right places woud reduce the estimated ratio of 56 MHz to carrier power by roughly a factor 2, that is, closer to the phase camera result. However the uncertainty in OMC scan analysis is very large. A simpler check is to compare B1p phase camera and B1p photodiode in conditions of different ratio of carrier and sidebands. During CITF lock the carrier power in the ITF is largely suppressed, and dark fringe power is dominated by the 56 MHz SB. The attached plot from 12/10/25 compares the B1p camera DC signals and the B1p photodiode. The total power on B1p phase camera, i.e. the sum of carrier, 56 MHz, and 6 MHz powers, is displayed in dark green. In the left part the ITF is locked in CITF, and carrier power is negligible. In the right part carrier power is higher than individual 56 MHz sidebands. The trend of total power from phase camera matches the B1p PD, showing that the ratio of carrier to sidebands from phase camera signal is basically correct.
An independent analysis of carrier contrast defect is displayed on VIM, where carrier power from B1p and B4 phase cameras are compared to reference values in single bounce to get rid of calibration drifts:
CD = 2 * TSR* [ Power(B1p_PC) / Power(B1p_PC single bounce)] / [ Power(B4_PC) / Power(B4_PC single bounce) ]
(B1p_PC and B4_PC, are the Phase Camera signals taken for the Carrier)
The VIM computation is in good agreement with the analysis in VIR-1178A-25. In particular, around October 12 the VIM computation shows a contrast defect around 50 ppm in LN3 and 200 PPM in LN2.


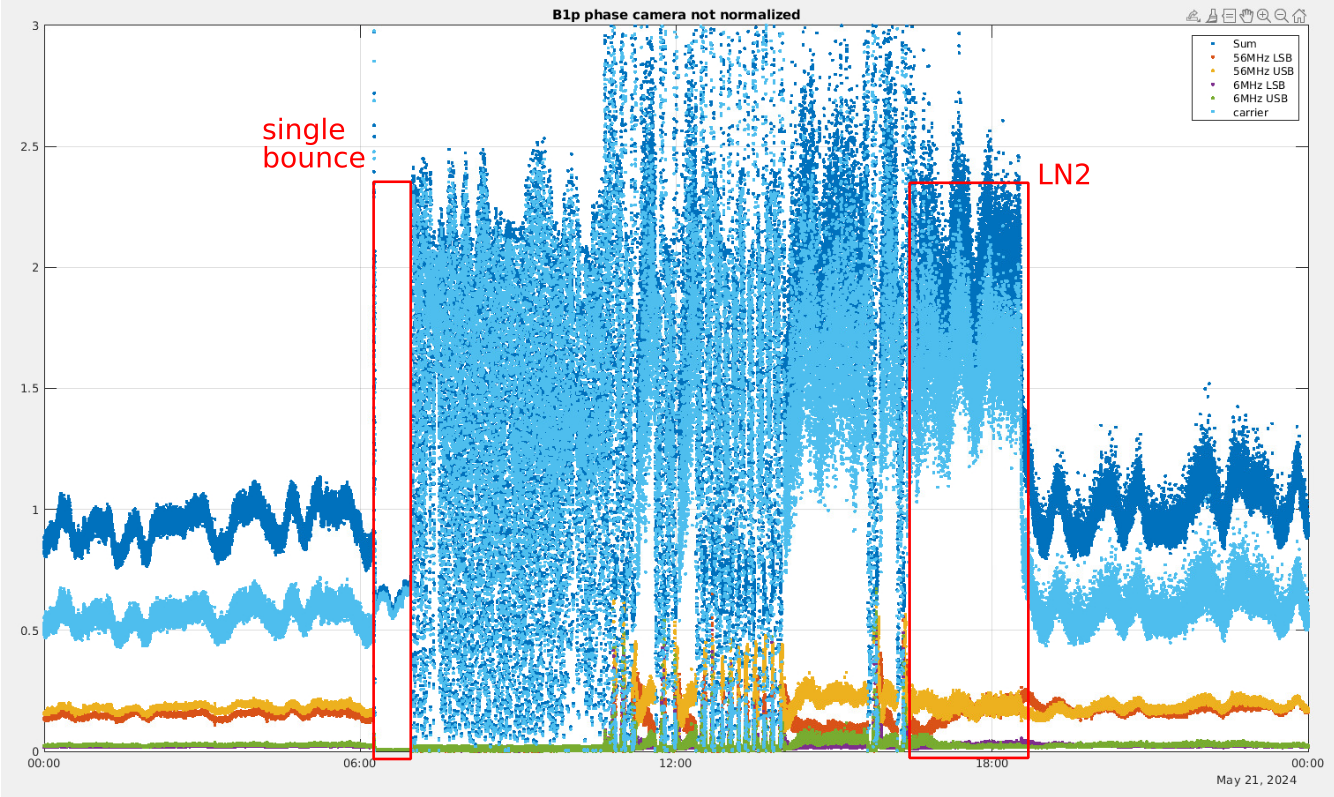
The phase camera data for an aligned phase camera confirms that most of the power on B1p in LN2 is due to the carrier.
Figure 1 shows data from phase camera power of sidebands and carrier and the total of all curves shown. Highlighted is time in single bounce when almost all the power is in the carrier light and in LN2 where most of the power (~80%) is in carrier light. Which is compatiable with the OMC scan measurements that 10% of the power is in the 56MHz TEM00 modes, with a few more percent in sideband higher order modes.
Figure 2 shows the ratio between the PC carrier and total, making it clearer that it is 80% of the power.
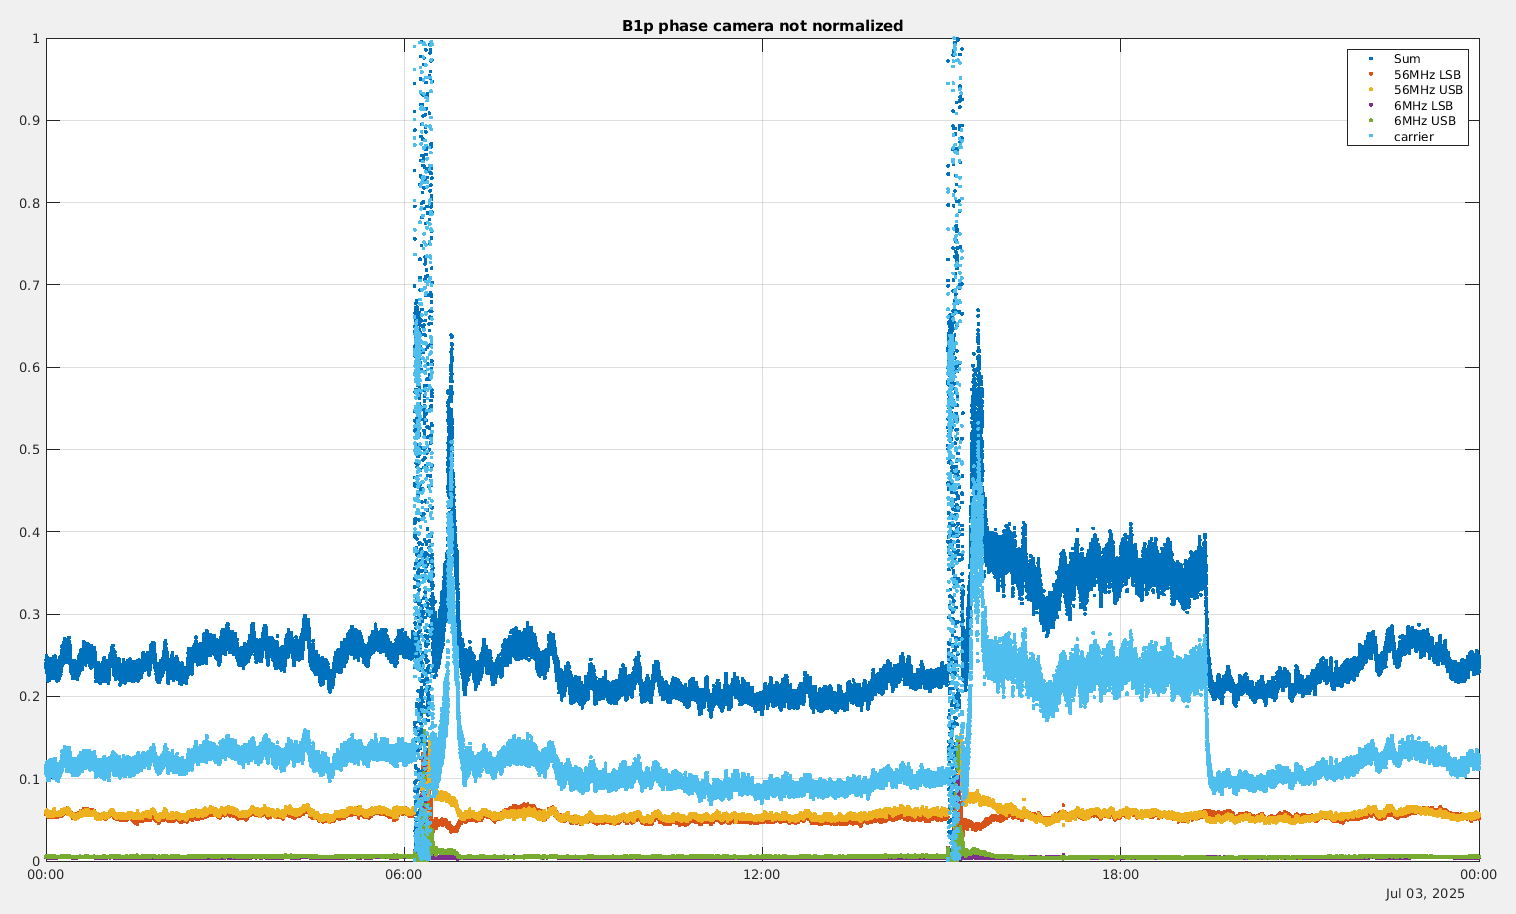
In April/May 2025 the EDB OMC was installed, this has misaligned the phase camera as reported previously. It was realigned during that break, but the alignment drifted away again over a month following the break.
Figure 3 shows data in July 2025, with the PC misaligned, and the interferometer in LN2 around 18:00 UTC. Note that the vertical scale is the same as in figure 1, highlighting there is 5 times less power on the phase camera than there used to be.
Figure 4 zooms the horizontal axis, about 65% of the power detected by the phase camera is in the carrier light in LN2. However, given that the phase camera is strongly misaligned this data may be misleading, as most of the light is likely actually not reaching the phase camera.
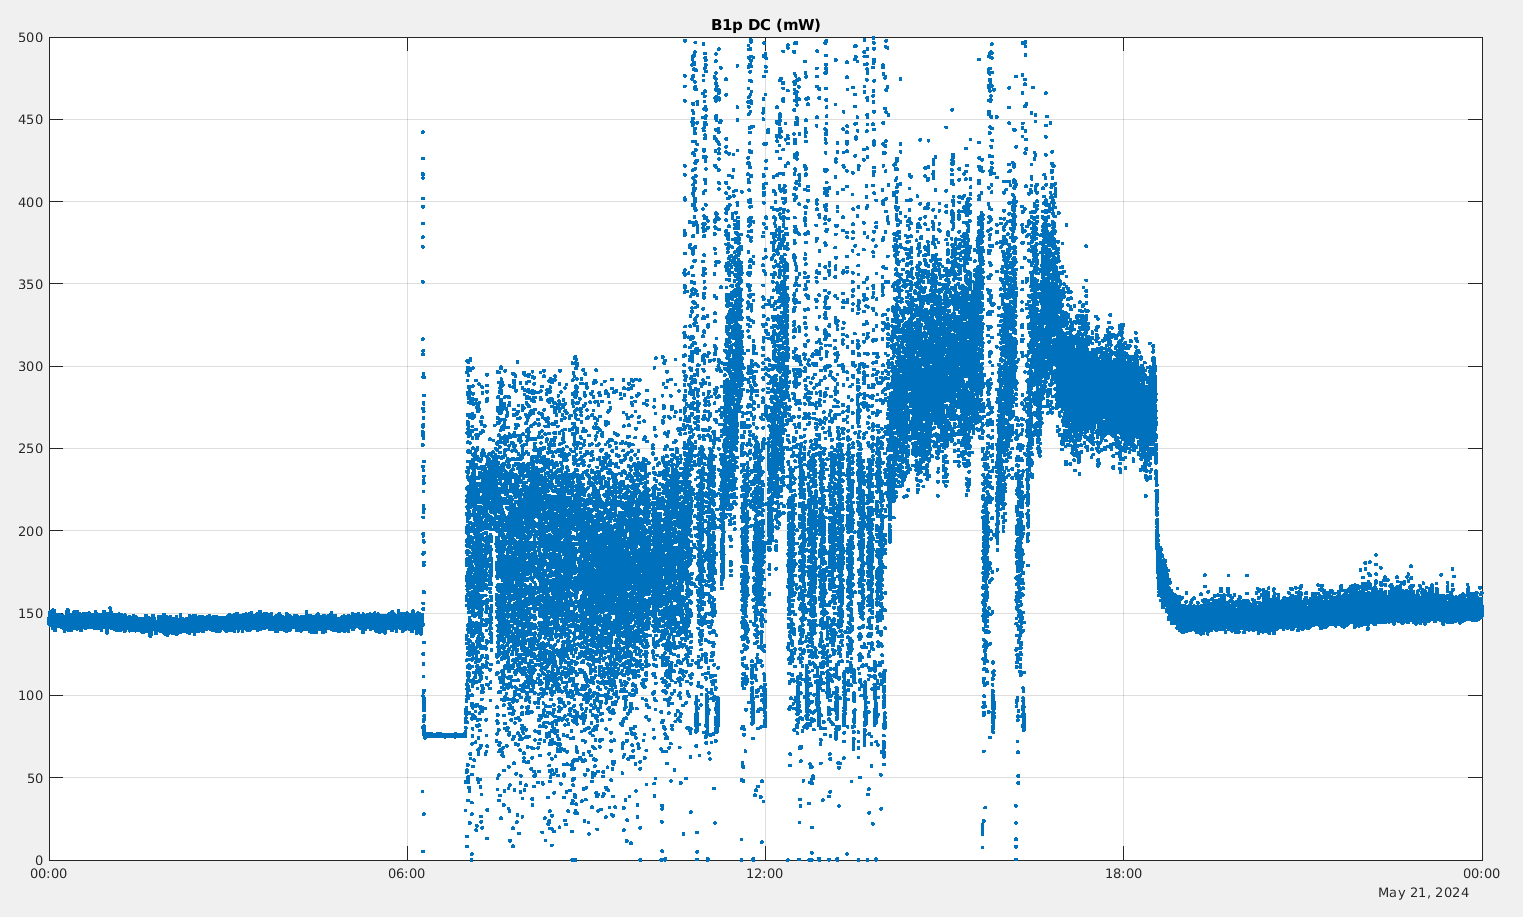
Figure 5. Coming back to the 2024 data that should be reliable, the power on B1p in LN2 is ~275mW. With 80% of carrier light that corresponds to 220mW. The contrast defect of CD = 2 * B1p / P_PRC = 2*220e-3/17/39 = 660ppm. In LN3 the power on B1p is 150mW, with 60% of it in carrier light, so 90mW of carrier light, and a contrast defect of 2*90e-3/17/39 = 270ppm, which is within the error bars of the 286+/-24ppm reported in the O4 optical characterization paper (VIR-0710B-24).
/users/mwas/PC/PC_contrast_20251211/longTermTrend.m


In 2024, Antonella Bianchi did also the power decomposition at the dark fringe for various input powers. The results are summarized in the wiki page:
https://wiki.virgo-gw.eu/Commissioning/OptChar/O4_param
In the section " TABLE FOR WHEN THE IFO IS 1h after CARM NULL STATE IS REACHED", the results are comparable to what Michal reported for the dark fringe (not identical but in the same range for most).