At around 08:30 UTC we went in TCS room where the power supply is located, and also looking at its analog display, we saw that it was delivering intermittently, as indicated by the LSC_WI_HB_moni signal.
We replaced the power supply with a spare one of the same kind (Kert 420). During the replacement (from 08:34 to 08:40 UTC) the operator temporarily opened the WI etalon loop, as recommended by Maddalena.
Now the loop seems working regularly (attached fig).

Glitches might have stopped because the WI etalon loop error signal has finally become negative. The loop is asking for cooling the WI tower, which means turning the heating belt off. This switch off didn't happen immediately, but with an on/off for 10 minutes, so it is most likely due to the loop itself and not from an intentional switch off.


I have run a cross-correlation analysis using deltas for each glitch time, and all the _mean and _rms channels from the trend frame. I confirm what was highlighted by Bas in the previous comment:
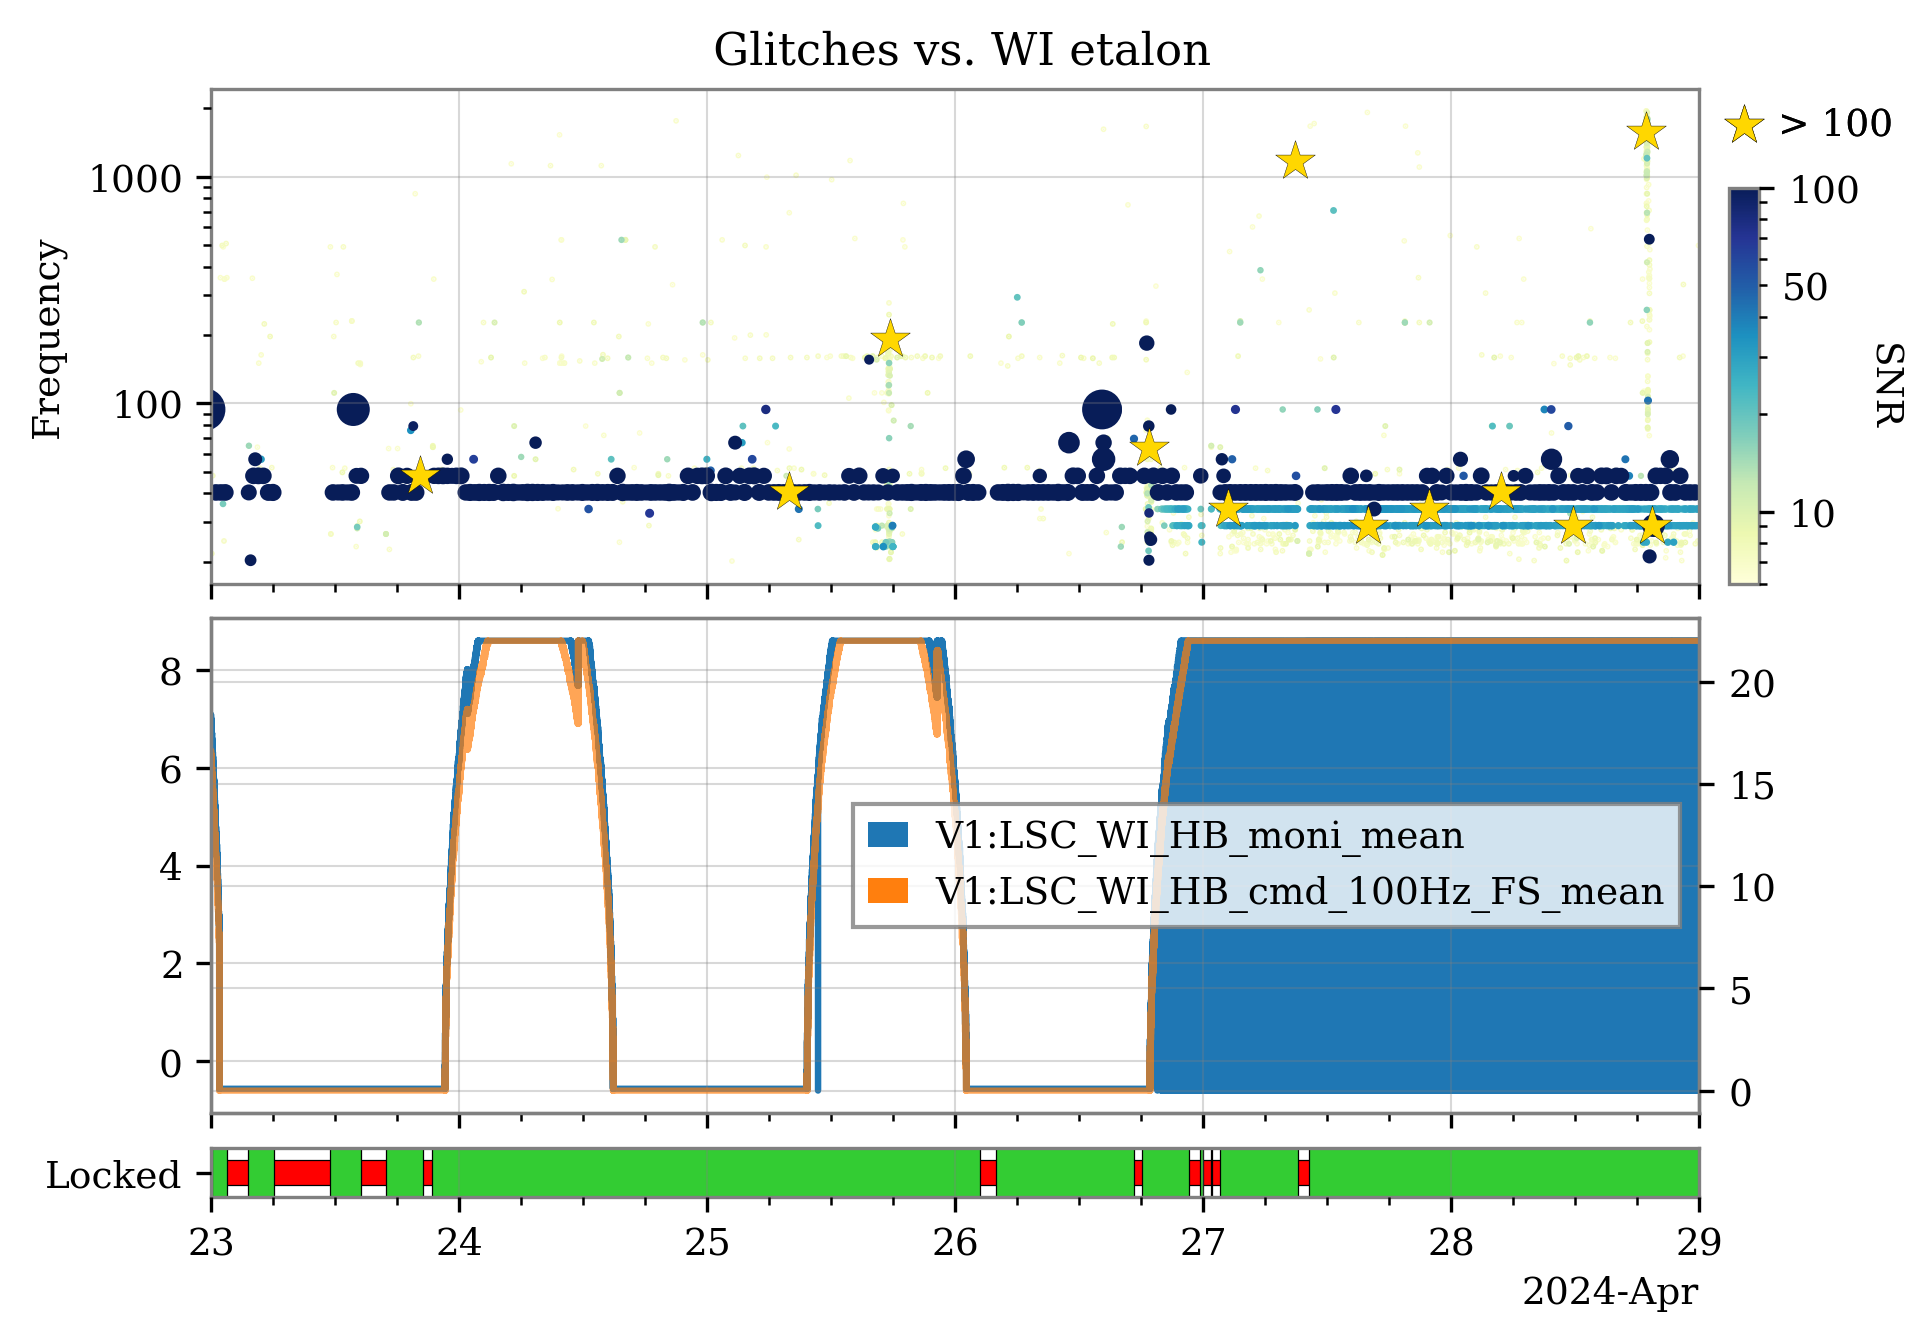
1) Since April 26 20:00 UTC, the LSC_WI_HB_moni channel has started behaving oddly, with a sequence of square waves from zero to the set point. This is simultaneous with the appearance of the new glitches. The channel monitoring the electric potential, LSC_WI_HB_cmd_100Hz_FS, doesn't present similar behaviour. Figure 1 shows the glitchgram, with the new glitches showing up at the end of Apr 26, and the time series of the two channels monitoring the WI etalon.
2) The glitches in hrec are synchronous with the steps in the square wave visible in LSC_WI_HB_moni.
3) The correlation analysis with the _rms and the _mean trend channels has produced no other correlated channel with these glitches.


Glitches disappeared around 6:45 UTC. Has some action been taken? Indeed, square waves were seen also in the CEB UPS CURR T monitor, as for the old problem with WI heating belts that Bas pointed out.


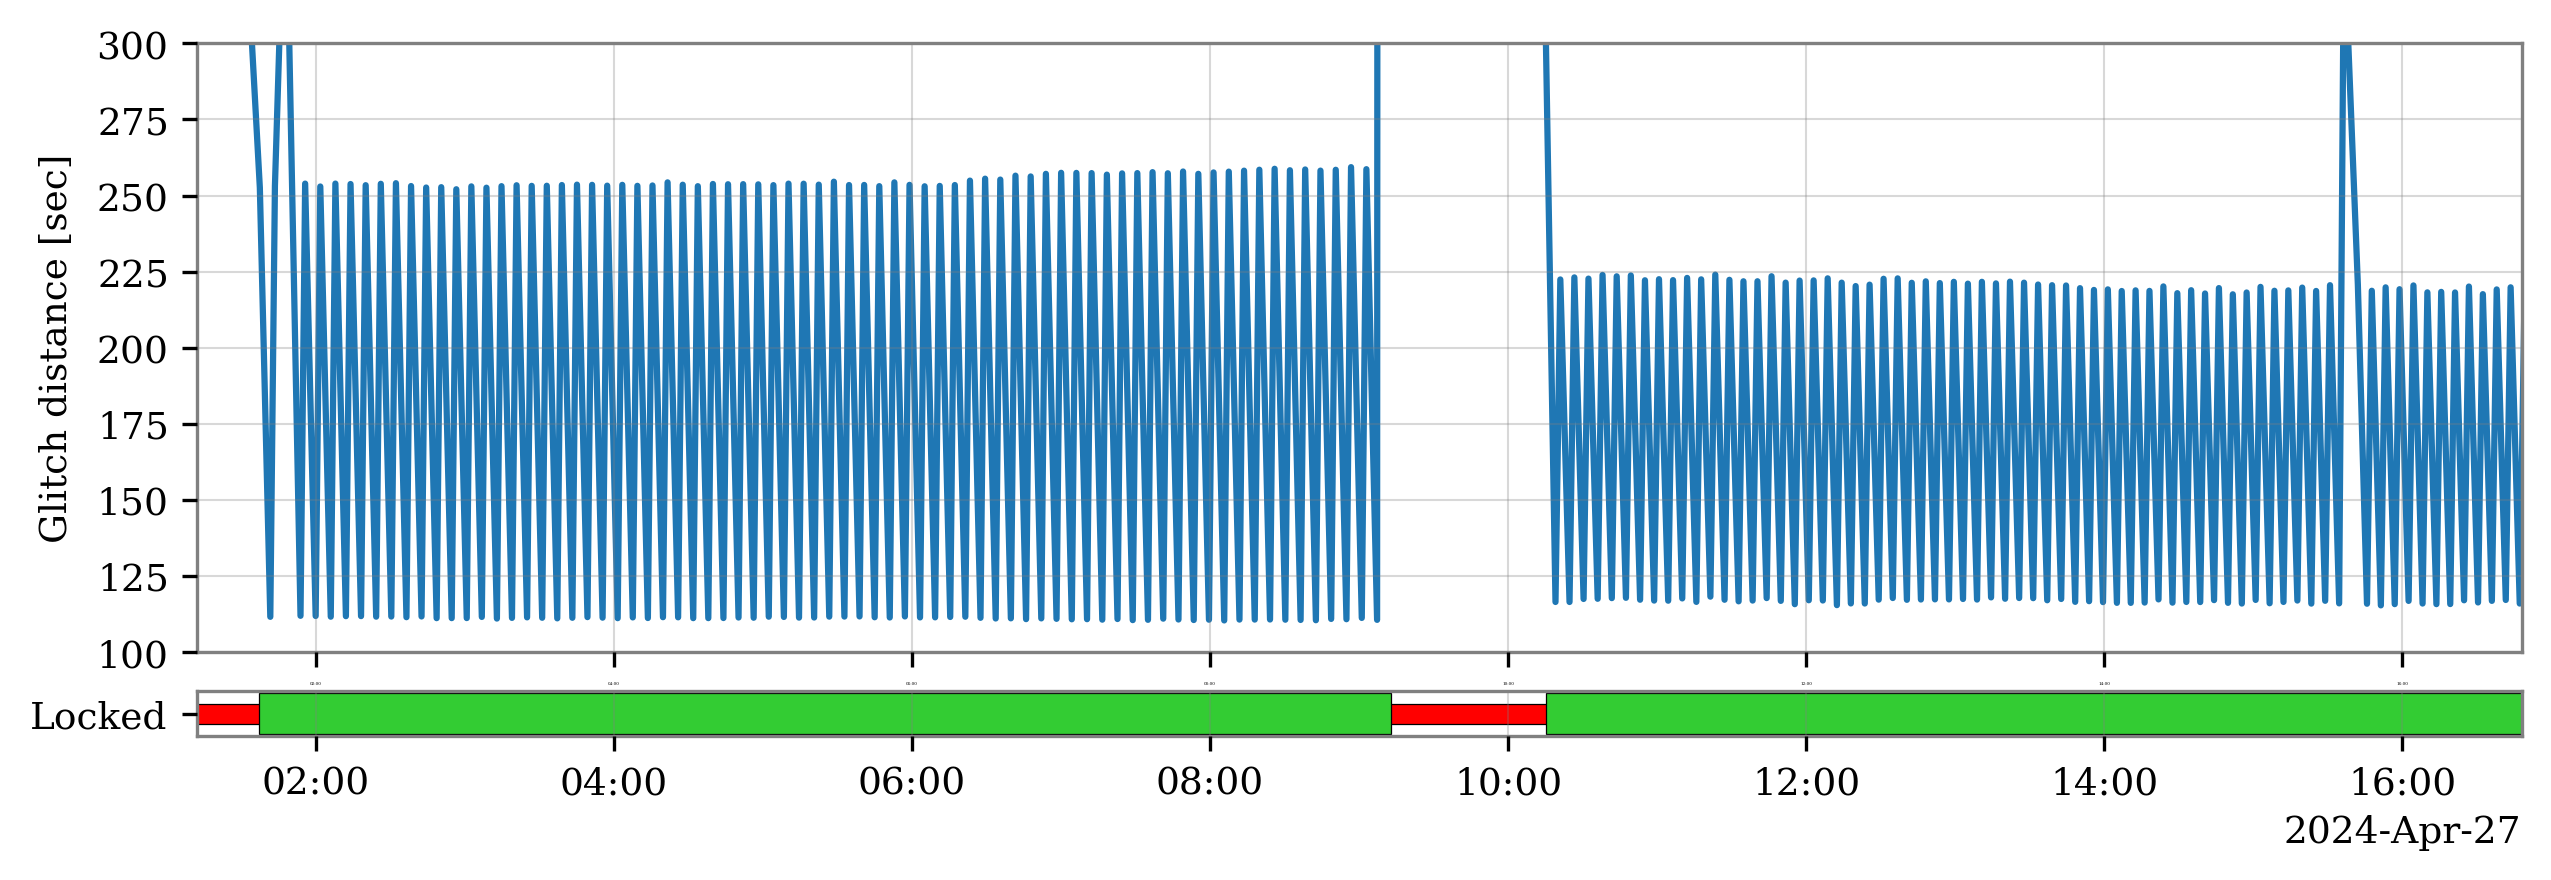
These new glitches seem to originate from some noise source activating for ~2 minutes and off for ~4, similar to a square wave.
First of all, I identified the new glitch family selecting the omicron triggers with peak frequency lower than 40 Hz and SNR between 15 and 60. Then, plotting the temporal distances in the occurrences of consecutive glitches (similarly to what has been done for the 25-minute glitches), I noticed that these alternate between ~115 seconds and 250 or 225 seconds in the examined time interval: figure 1.
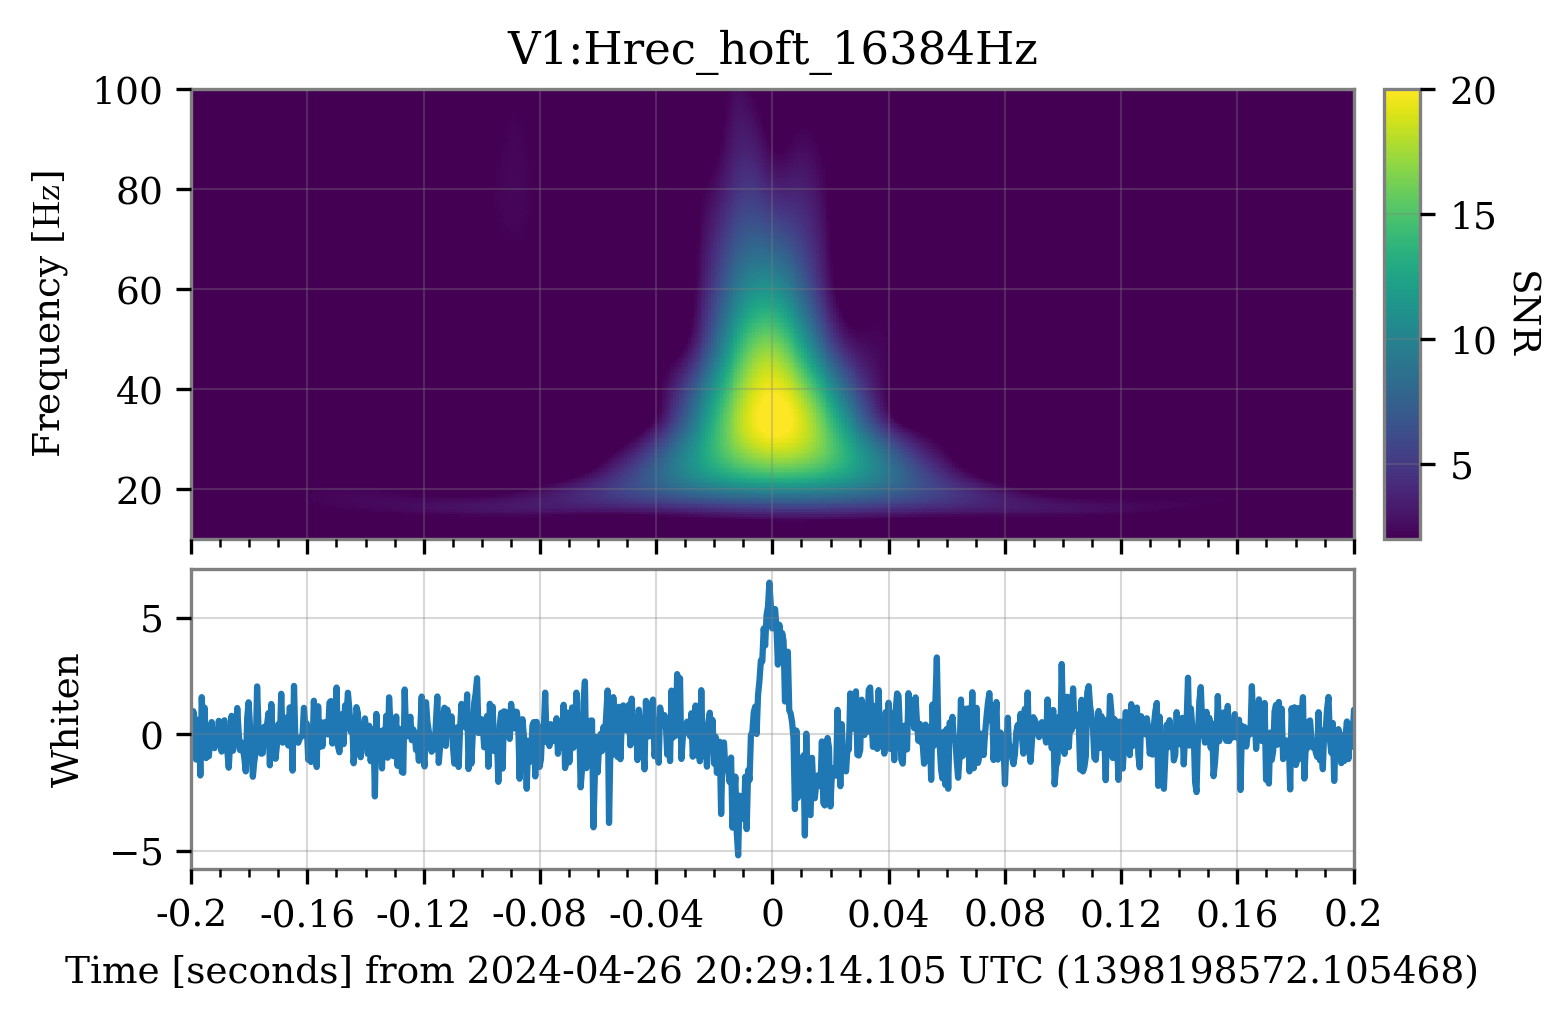
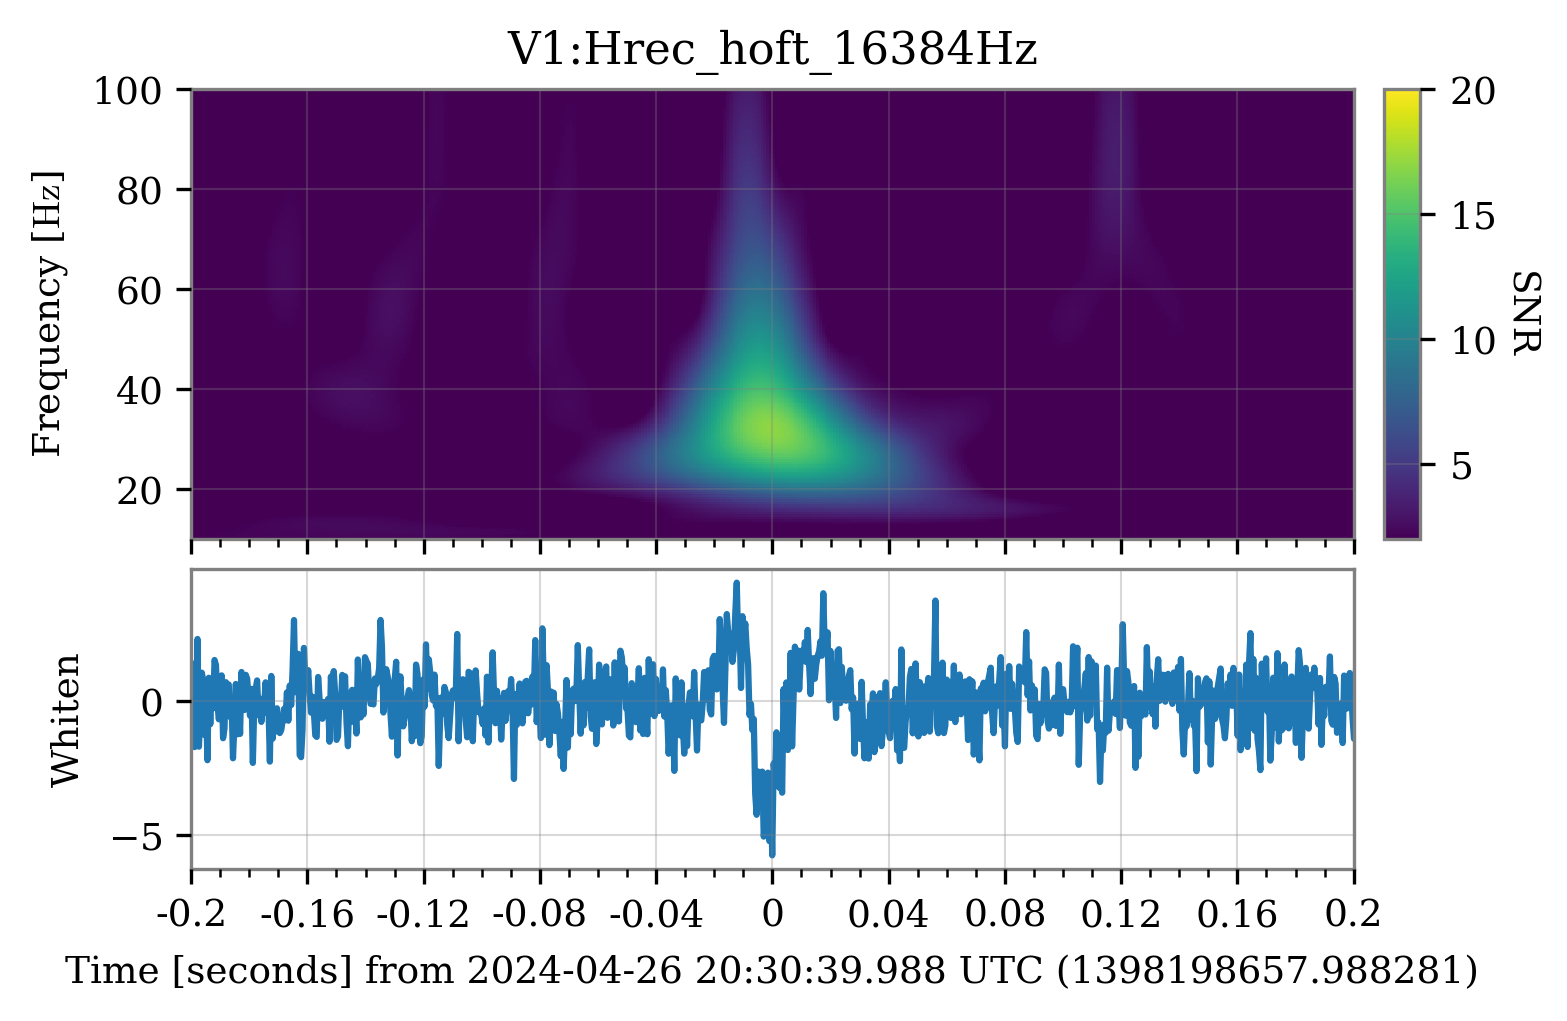
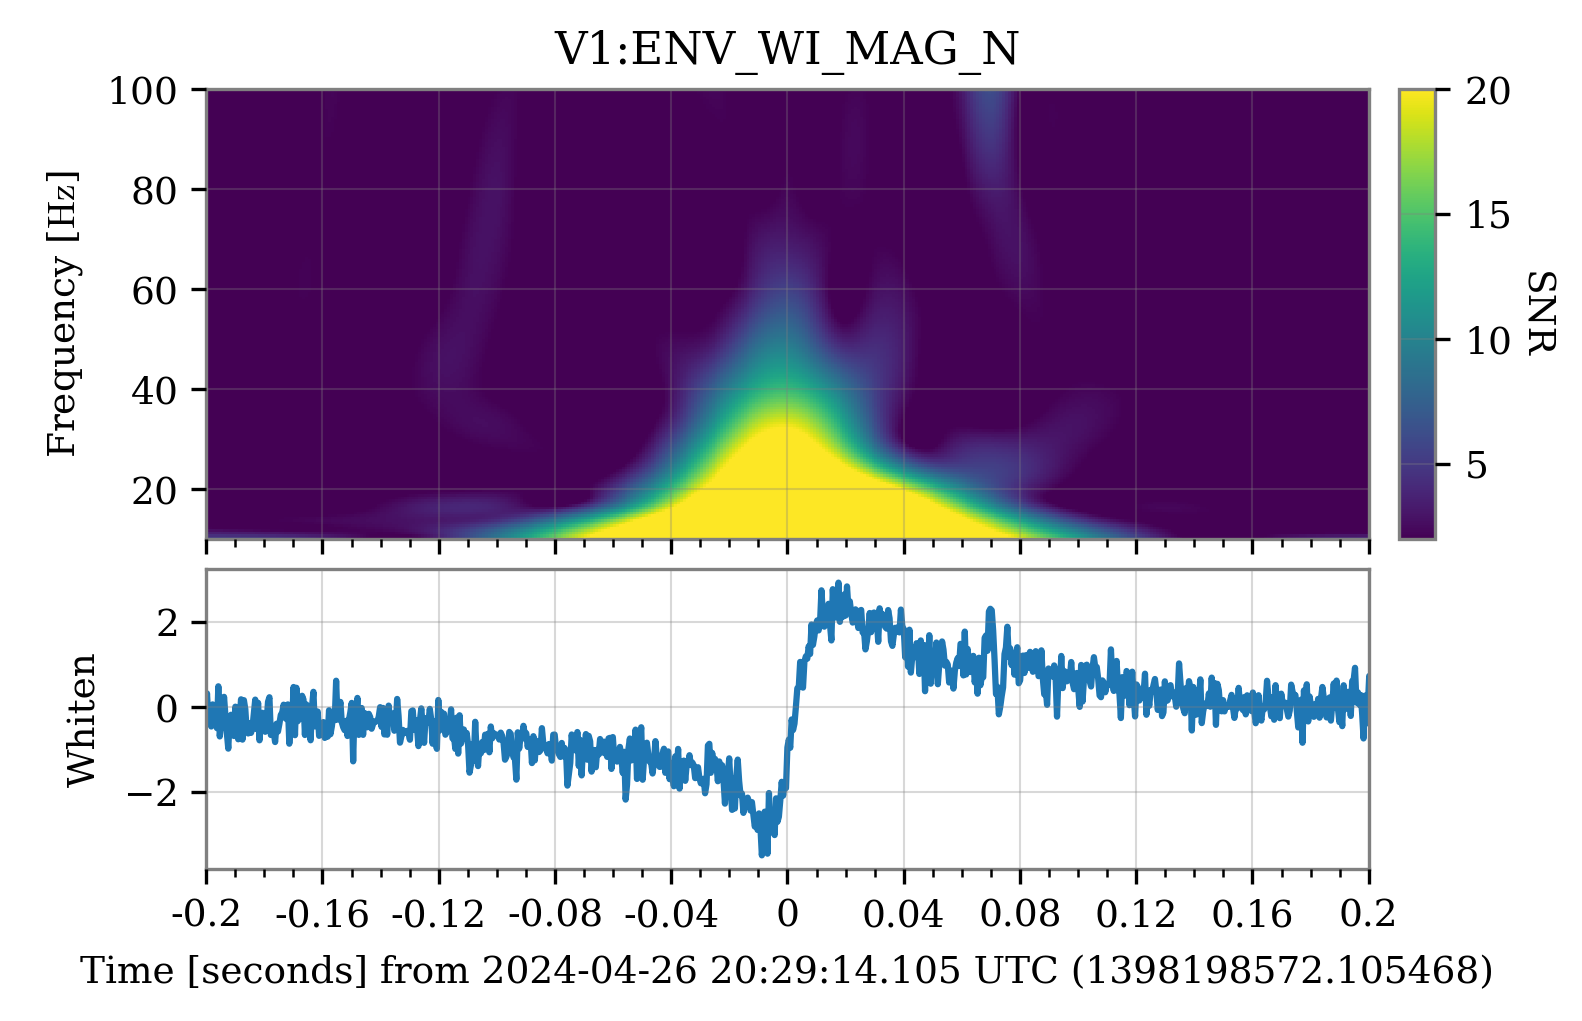
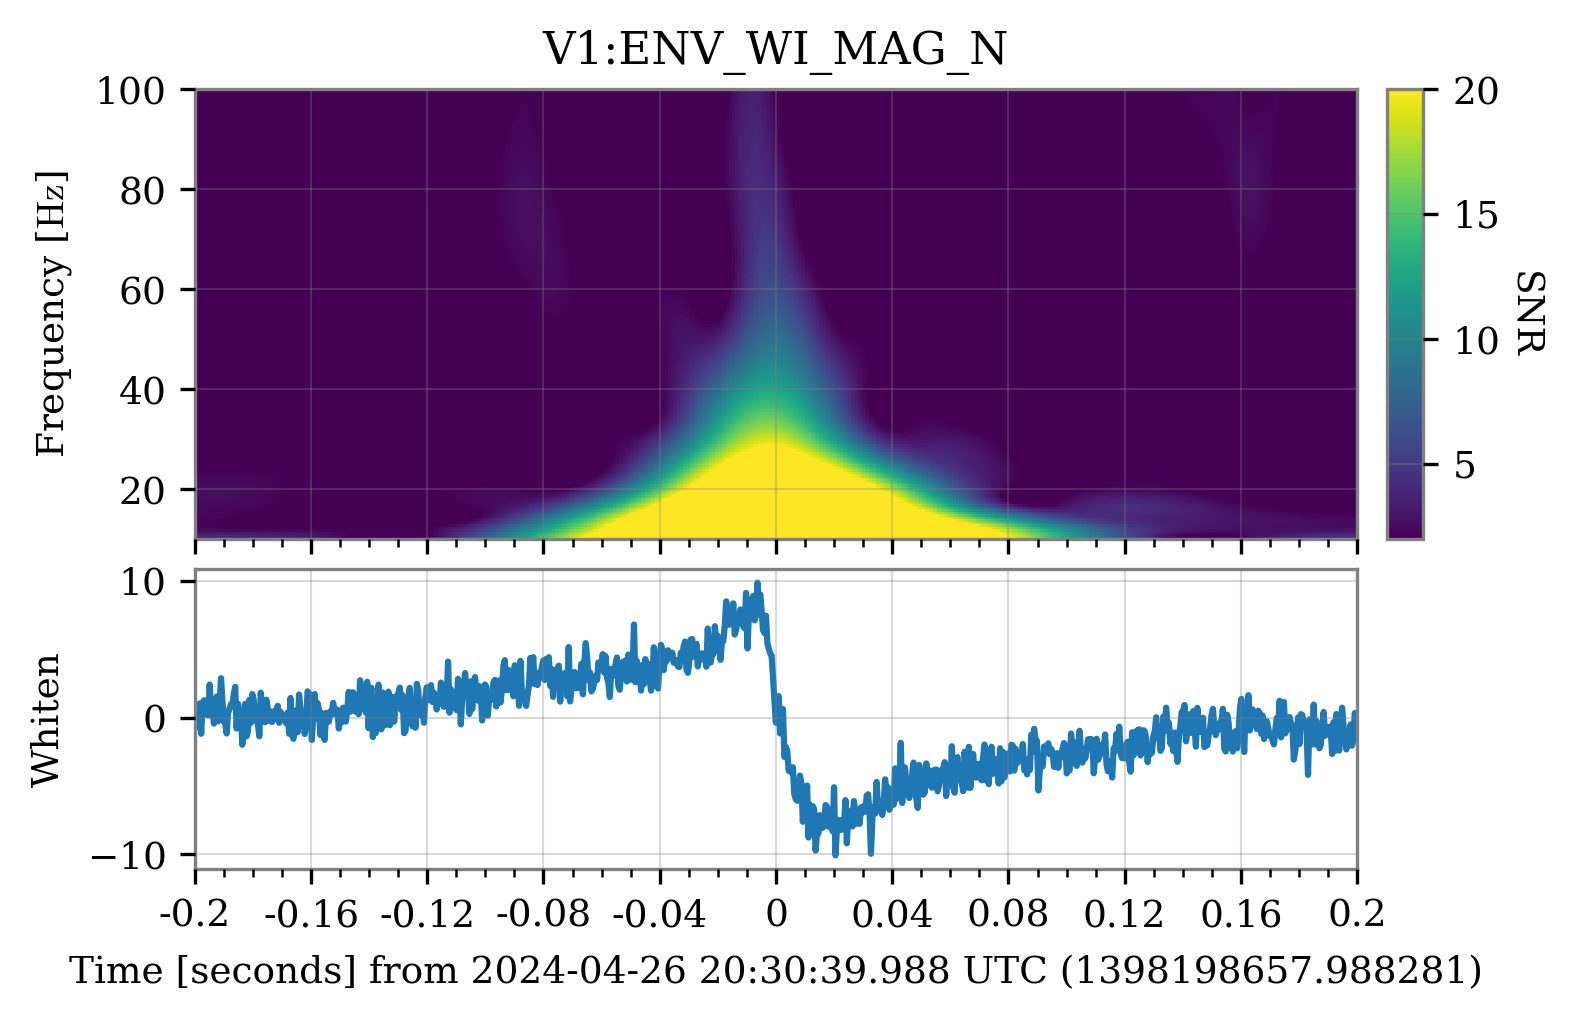
Figure 2 and 3 show the spectrograms of two consecutive glitches in hrec, and their whiten time series. The latter show opposite behaviours, with a spike up in one glitch, followed by a spike down in the next one.
Similar plots for the magnetometers at the West Input, show a step-like behaviour: figure 4 and 5.
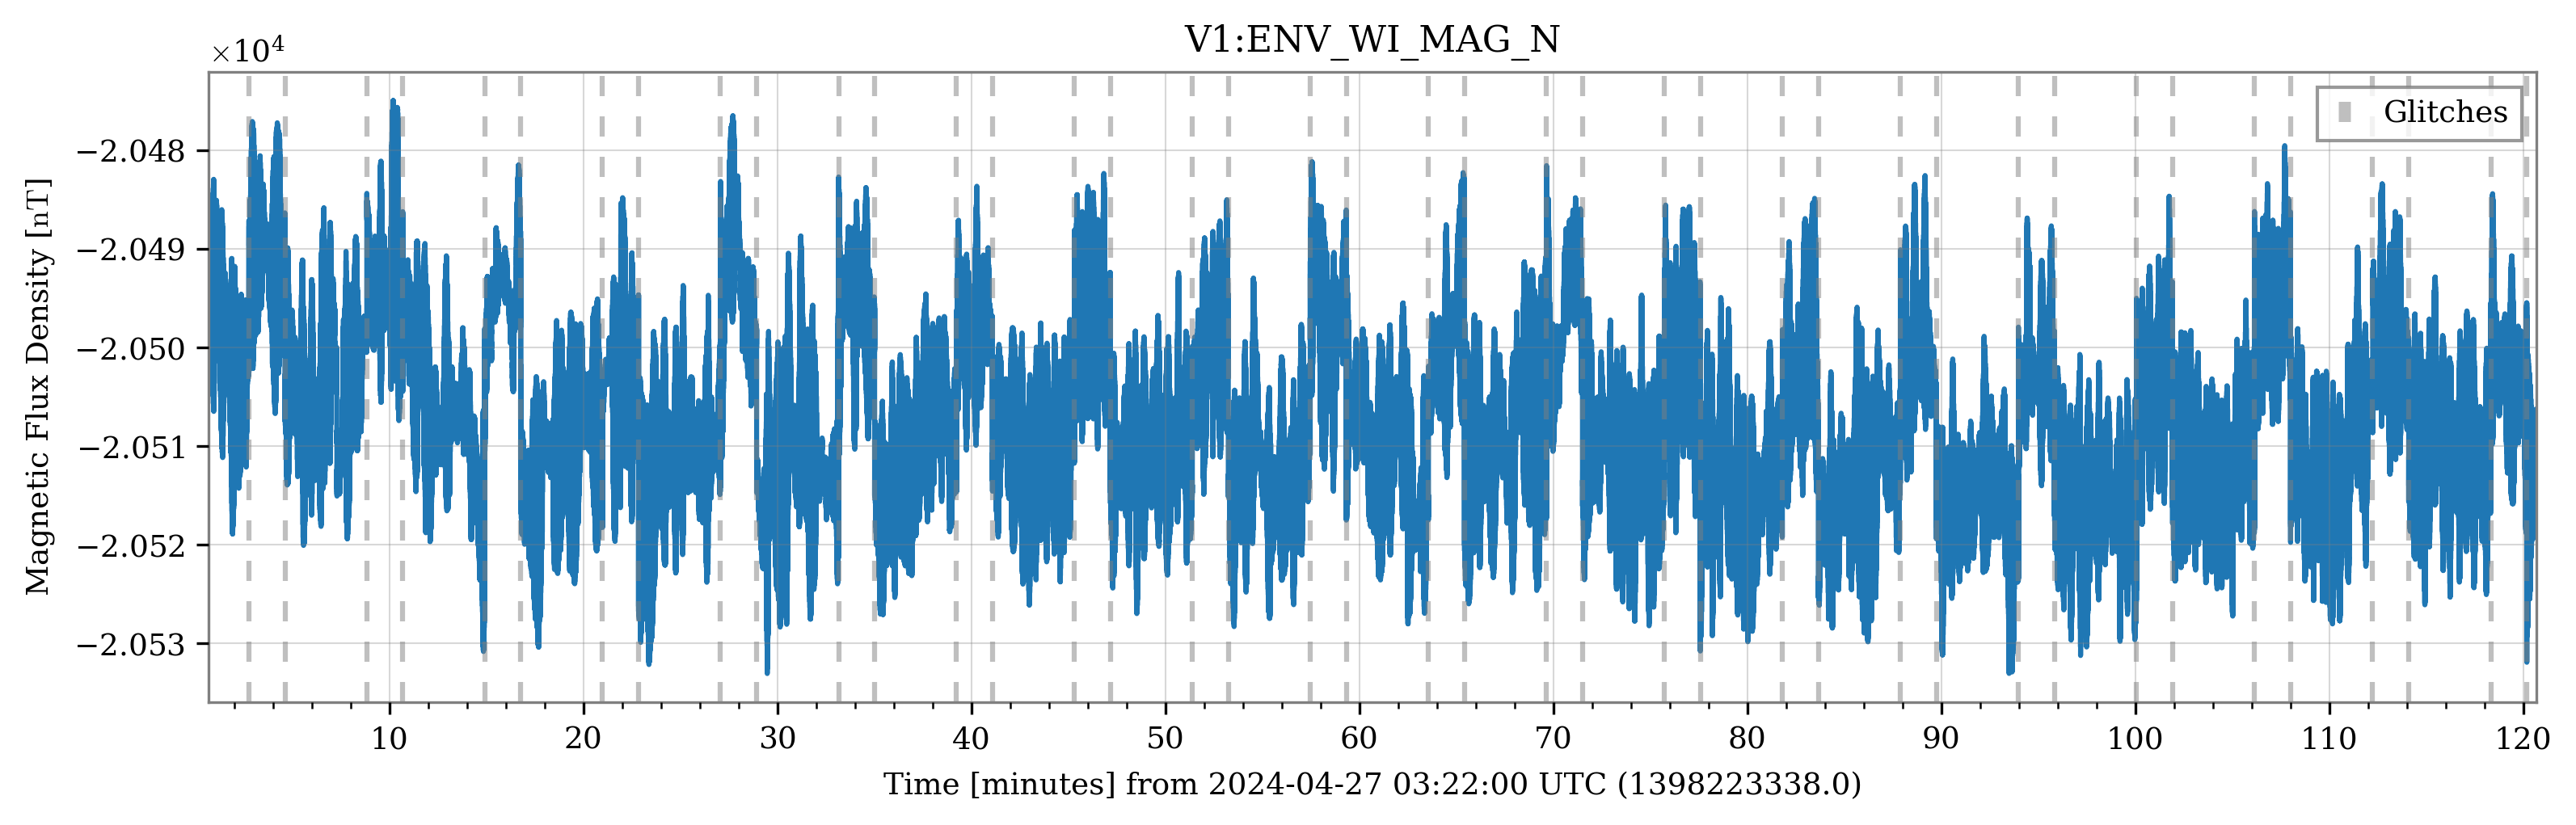
The (non-whitened) time series of this magnetometer channel shows more clearly the square wave behaviour in the correspondence of each pair of glitches: figure 6.
The next task is finding what source is activating with a similar timing.


Nice find. Figure 1 and 2 made using omicron-plot show that these glitches in the WI MAG started at the same time as the glitches in h(t) around 20:00 UTC, and that they have not been happening the day before, and have been happening since then. There are magnetic glitches between 150Hz and 200Hz that have stopped a few hours before the glitches at ~30Hz started. The two might be related.
Figure 3 shows that this glitches are not visible on the NI MAG. So it is likely that the issue is close to the WI.
Next steps should be:
- Use the veto based on the WI MAG channel between 10Hz and 40Hz for GW analysis
- Try to find the source of the WI MAG glitches. Is there a piece of hardware that is starting to fail near WI


UPV + VetoPerf point to the following channels (without the _0 which is added in UPV to label the corresponding veto):
V0 → V1:ENV_WI_MAG_W_0, vetoed clusters: 454 (80.927 %)
V1 → V1:ENV_WI_MAG_N_0, vetoed clusters: 452 (80.570 %)
V2 → V1:ENV_WI_MAG_V_0, vetoed clusters: 452 (80.570 %)
V3 → V1:TCS_WI_CO2_ISSIN_0, vetoed clusters: 172 (30.660 %)
V4 → V1:ENV_CEB_ELECTRIC_0, vetoed clusters: 121 (21.569 %)
See https://scientists.virgo-gw.eu/DataAnalysis/DetCharDev/users/narnaud/UPV/20240428_glitches/V1:Hrec_hoft_16384Hz/perf/vp.html#V0 -> Click here to expand -> Time-frequency trigger distribution: before/after veto.
In attachment the Omicron plots of h(t) and V1:ENV_WI_MAG_W, for comparison.

Figure 1. From about 20:00 UTC yesterday there are many glitches in h(t) around 30Hz. The glitches between 18:00-19:00 UTC are normal, these are due to injections to measure coupling to h(t) of various of degree of freedom. What happens starting from ~20:00 UTC is in science mode, and needs understanding.
Figure 2 The SNR of these glitches has grown from ~15 to ~30 over 1 hour, and has been relatively steady since then. There were several unlocks since the problem started and the glitches have continued at the same SNR after the relocks.


UPV + VetoPerf point to the following channels (without the _0 which is added in UPV to label the corresponding veto):
V0 → V1:ENV_WI_MAG_W_0, vetoed clusters: 454 (80.927 %)
V1 → V1:ENV_WI_MAG_N_0, vetoed clusters: 452 (80.570 %)
V2 → V1:ENV_WI_MAG_V_0, vetoed clusters: 452 (80.570 %)
V3 → V1:TCS_WI_CO2_ISSIN_0, vetoed clusters: 172 (30.660 %)
V4 → V1:ENV_CEB_ELECTRIC_0, vetoed clusters: 121 (21.569 %)
See https://scientists.virgo-gw.eu/DataAnalysis/DetCharDev/users/narnaud/UPV/20240428_glitches/V1:Hrec_hoft_16384Hz/perf/vp.html#V0 -> Click here to expand -> Time-frequency trigger distribution: before/after veto.
In attachment the Omicron plots of h(t) and V1:ENV_WI_MAG_W, for comparison.
Nice find. Figure 1 and 2 made using omicron-plot show that these glitches in the WI MAG started at the same time as the glitches in h(t) around 20:00 UTC, and that they have not been happening the day before, and have been happening since then. There are magnetic glitches between 150Hz and 200Hz that have stopped a few hours before the glitches at ~30Hz started. The two might be related.
Figure 3 shows that this glitches are not visible on the NI MAG. So it is likely that the issue is close to the WI.
Next steps should be:
- Use the veto based on the WI MAG channel between 10Hz and 40Hz for GW analysis
- Try to find the source of the WI MAG glitches. Is there a piece of hardware that is starting to fail near WI
These new glitches seem to originate from some noise source activating for ~2 minutes and off for ~4, similar to a square wave.
First of all, I identified the new glitch family selecting the omicron triggers with peak frequency lower than 40 Hz and SNR between 15 and 60. Then, plotting the temporal distances in the occurrences of consecutive glitches (similarly to what has been done for the 25-minute glitches), I noticed that these alternate between ~115 seconds and 250 or 225 seconds in the examined time interval: figure 1.
Figure 2 and 3 show the spectrograms of two consecutive glitches in hrec, and their whiten time series. The latter show opposite behaviours, with a spike up in one glitch, followed by a spike down in the next one.
Similar plots for the magnetometers at the West Input, show a step-like behaviour: figure 4 and 5.
The (non-whitened) time series of this magnetometer channel shows more clearly the square wave behaviour in the correspondence of each pair of glitches: figure 6.
The next task is finding what source is activating with a similar timing.
Glitches disappeared around 6:45 UTC. Has some action been taken? Indeed, square waves were seen also in the CEB UPS CURR T monitor, as for the old problem with WI heating belts that Bas pointed out.
I have run a cross-correlation analysis using deltas for each glitch time, and all the _mean and _rms channels from the trend frame. I confirm what was highlighted by Bas in the previous comment:
1) Since April 26 20:00 UTC, the LSC_WI_HB_moni channel has started behaving oddly, with a sequence of square waves from zero to the set point. This is simultaneous with the appearance of the new glitches. The channel monitoring the electric potential, LSC_WI_HB_cmd_100Hz_FS, doesn't present similar behaviour. Figure 1 shows the glitchgram, with the new glitches showing up at the end of Apr 26, and the time series of the two channels monitoring the WI etalon.
2) The glitches in hrec are synchronous with the steps in the square wave visible in LSC_WI_HB_moni.
3) The correlation analysis with the _rms and the _mean trend channels has produced no other correlated channel with these glitches.
Glitches might have stopped because the WI etalon loop error signal has finally become negative. The loop is asking for cooling the WI tower, which means turning the heating belt off. This switch off didn't happen immediately, but with an on/off for 10 minutes, so it is most likely due to the loop itself and not from an intentional switch off.
At around 08:30 UTC we went in TCS room where the power supply is located, and also looking at its analog display, we saw that it was delivering intermittently, as indicated by the LSC_WI_HB_moni signal.
We replaced the power supply with a spare one of the same kind (Kert 420). During the replacement (from 08:34 to 08:40 UTC) the operator temporarily opened the WI etalon loop, as recommended by Maddalena.
Now the loop seems working regularly (attached fig).
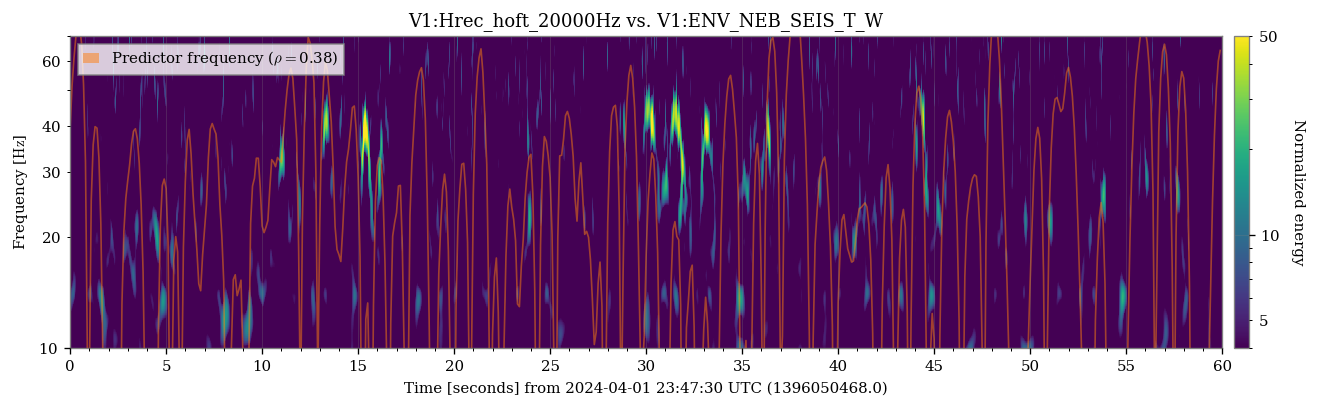
I have refined the analysis in the main entry to include more glitches and all the auxiliary channels measuring positions, velocities and accelerations, as described in this git issue. The results are contained in the attached text files. These confirm and expand what is already presented in the main entry, that is, a strong correlation of these glitches with the movement of the West End bench and suspension. Correlations with velocity and acceleration sensors are instead much smaller. They tend to point to the motion of parts of the North End building, but plotting the predictor frequencies superimposed to the spectrogram of Hrec shows in fact no convincing correlations. Example in figure 1.

This is very interesting. My interpretation of to these results is:
- The work on improving the EIB control has been effective. The scattered light glitches that its motion produces during bad weather is at frequencies below 20Hz, and maybe even 15Hz, which will be more difficult to improve on.
- The main source of scattered light glitches 30Hz-50Hz during bad weather comes from the west end building. The WE suspension local control signal Sa_WE_F0_X_500Hz, may mean the suspension is moving, or that the ground around the suspension is moving. A more detailed analysis of all the position sensors in the WE building is needed to determine what is the source of scattered light in the WE building, but it is unlikely to be the mirror itself.
Prompted by Michal, I verified if the occurrence of Scattered Light glitches from External Injection Bench motion associated with bad weather conditions has changed after the recent intervention and improvement of the EIB ground noise correction: #63763.
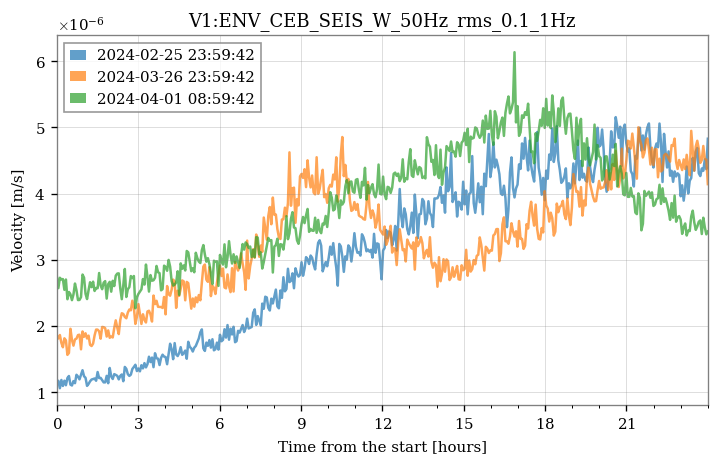
I examined the conditions during the last three main events of bad weather and Scattered Light glitches: February 25-26, March 26-27, and April 1-2.
Figure 1: time series of the V1:ENV_CEB_SEIS_W_50Hz_rms_0.1_1Hz during the three examined periods. In all three cases, the level of ground motion in the CEB is comparable.
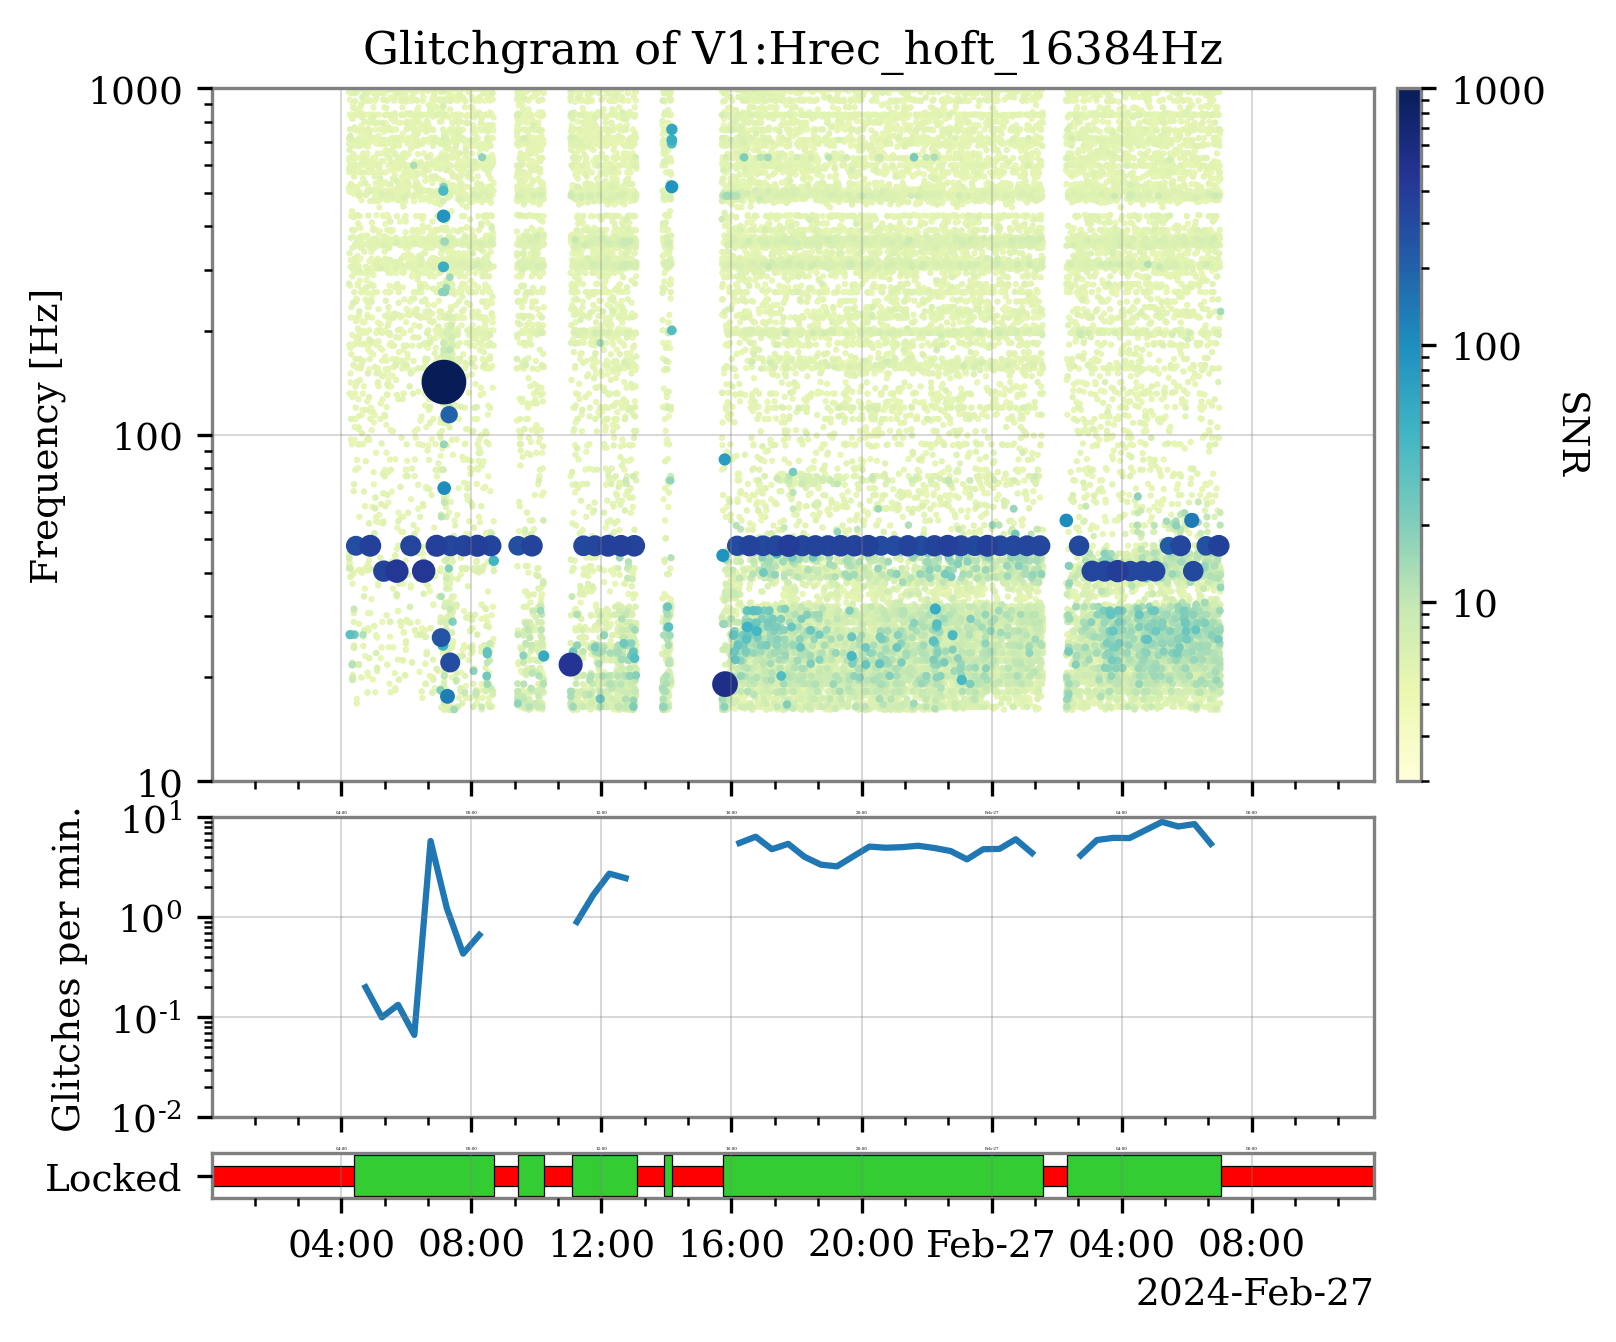
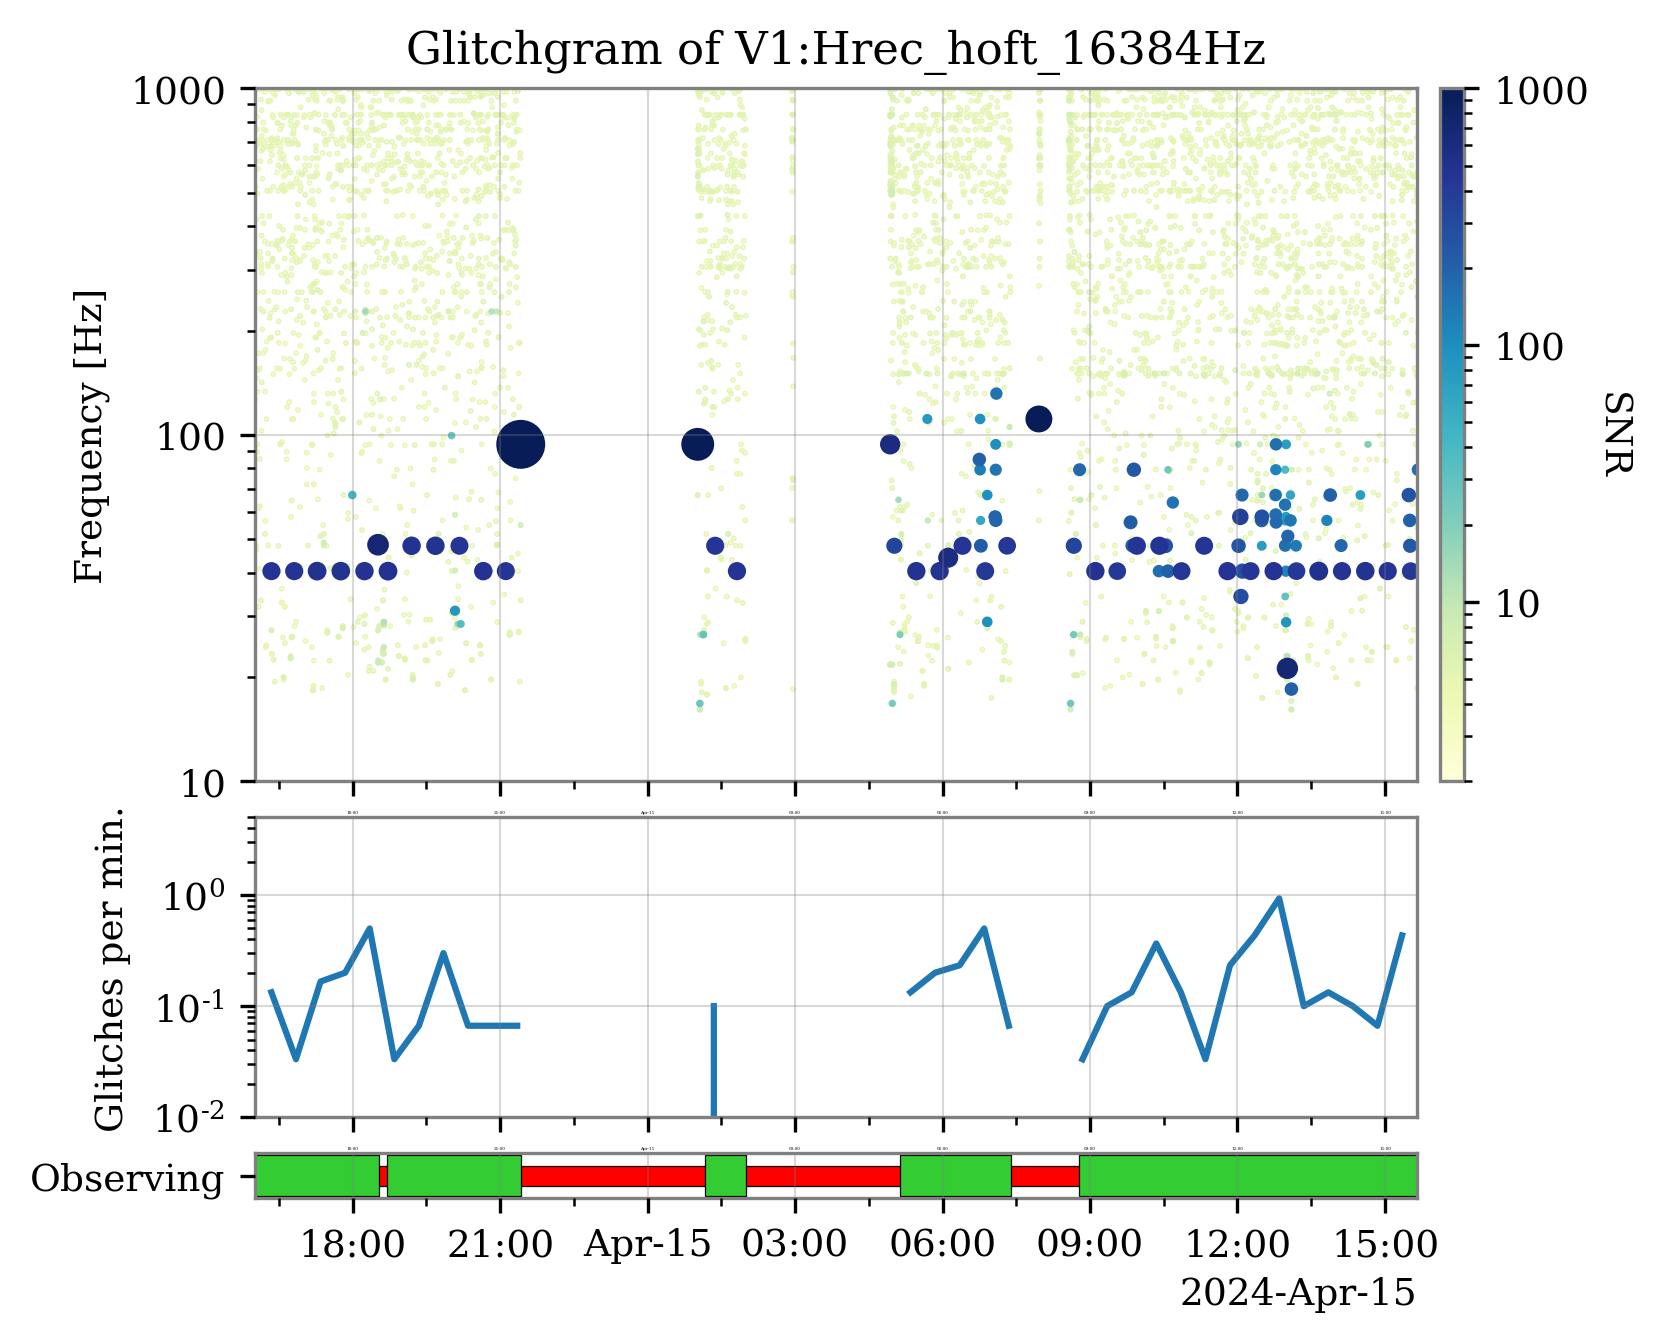
Figures 2, 3 and 4: glitchgrams for Hrec during the three examined periods. The bottom time series represent the glitch rates for those triggers with frequency at peak between 20 and 2048 Hz, and SNR > 6.5. One interesting thing to notice is the presence of additional, very loud glitches with frequency at peak of about 90-100 Hz, associated with the last period of bad weather. Investigations are ongoing to understand their origin and if they are related or not to the ground motion.
Figures 5, 6 and 7: same as above but for the V1:LSC_SRCL channel, which in previous entries (#63761 and , #63420) was observed with Scattered Light glitches most correlated with the motion of the EIB, represented by the channel V1:SBE_EIB_GEO_H2_200Hz. In the period April 1-2, almost no glitches are present above 20 Hz, while in the other two periods, the rate is very high and correlated with the ground motion. The fact that a similar reduction in the rate of glitches is not visible in Hrec suggests a different origin for them.
Figure 8: a few Scattered Light glitches present in LSC_SRCL and their prediction with the SBE_EIB_GEO_H2_200Hz channel, as described in #63761.
Figure 9: the Scattered Light visible in Hrec is mostly explainable by the motion of the West End mirror. Using the technique described in #63761, the most correlated channel found is Sa_WE_F0_X_500Hz. In the attached text file, the list of all channels with correlation larger than 20%. The reconstruction is not perfect due to the sparseness and irregular shape of the glitches.


This is very interesting. My interpretation of to these results is:
- The work on improving the EIB control has been effective. The scattered light glitches that its motion produces during bad weather is at frequencies below 20Hz, and maybe even 15Hz, which will be more difficult to improve on.
- The main source of scattered light glitches 30Hz-50Hz during bad weather comes from the west end building. The WE suspension local control signal Sa_WE_F0_X_500Hz, may mean the suspension is moving, or that the ground around the suspension is moving. A more detailed analysis of all the position sensors in the WE building is needed to determine what is the source of scattered light in the WE building, but it is unlikely to be the mirror itself.
I have refined the analysis in the main entry to include more glitches and all the auxiliary channels measuring positions, velocities and accelerations, as described in this git issue. The results are contained in the attached text files. These confirm and expand what is already presented in the main entry, that is, a strong correlation of these glitches with the movement of the West End bench and suspension. Correlations with velocity and acceleration sensors are instead much smaller. They tend to point to the motion of parts of the North End building, but plotting the predictor frequencies superimposed to the spectrogram of Hrec shows in fact no convincing correlations. Example in figure 1.
Transients are see also in DET B8 DC (Figure 1). Signal SBE_SWEB_F0_z_LVDT_500Hz converted into velocity and low pass filtered (fcut 0.5 Hz, in order to remove large high frequency noise in this signal) seems to reproduce sufficiently well the shape: Figure 2. Also the second order of arches (weakly seen in the photodiode) is similarly reproduced doubling the velocity, although not plotted. Maybe there is a better signal to use that measure the bench motion?


Are the transients corresponding to time that where outside of science mode during the same hour due to adjustments?
Yes for the first two, not completely for the third transient -- see attached plot. Are there some guidances to assess when switching back to science after one such adjustment?

Are the transients corresponding to time that where outside of science mode during the same hour due to adjustments? See figure 1.
These should be nice scattered light injections from moving SWEB https://logbook.virgo-gw.eu/virgo/?r=63997. It would be nice if someone could confirm it by looking at the same spectrogram for DET_B8_DC, and also see if the frequency corresponds to the speed of the bench in the Z direction (along the beam).

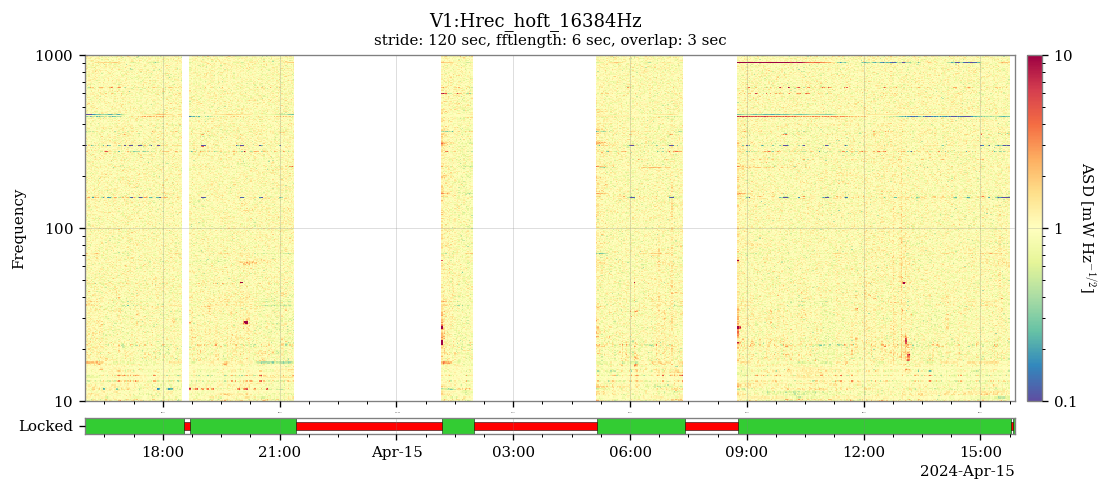
This morning, three transient noises, lasting several tens of seconds and limited to the 10-100 Hz frequency band, occured around 9h08 UTC, 9h38 UTC, 9h45 UTC.
Plot1 shows them in the spectrograms of LSC_DARM and Hrec_hoft_raw (on the same plot we can see also two 25' glitches).
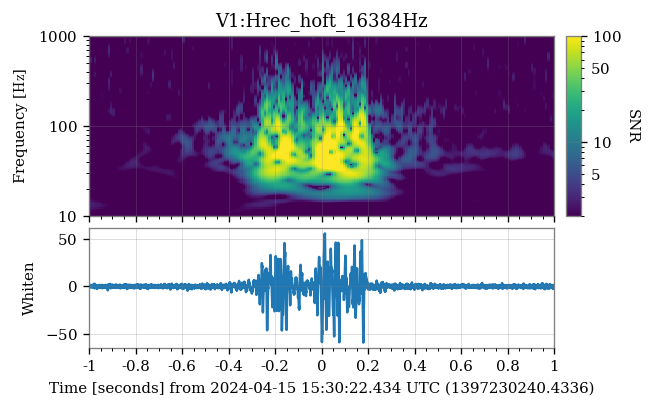
Plot2 is a zoom on the third of those transient noises.


Are the transients corresponding to time that where outside of science mode during the same hour due to adjustments? See figure 1.
These should be nice scattered light injections from moving SWEB https://logbook.virgo-gw.eu/virgo/?r=63997. It would be nice if someone could confirm it by looking at the same spectrogram for DET_B8_DC, and also see if the frequency corresponds to the speed of the bench in the Z direction (along the beam).
Are the transients corresponding to time that where outside of science mode during the same hour due to adjustments?
Yes for the first two, not completely for the third transient -- see attached plot. Are there some guidances to assess when switching back to science after one such adjustment?
Transients are see also in DET B8 DC (Figure 1). Signal SBE_SWEB_F0_z_LVDT_500Hz converted into velocity and low pass filtered (fcut 0.5 Hz, in order to remove large high frequency noise in this signal) seems to reproduce sufficiently well the shape: Figure 2. Also the second order of arches (weakly seen in the photodiode) is similarly reproduced doubling the velocity, although not plotted. Maybe there is a better signal to use that measure the bench motion?
I'm investigating this issue, without much success for the moment. From the point of view of data analysis, they are not a major problem, as long as their duration is short, their number/rate remains low enough, and they are just glitches, not increased baseline noise. I add just a couple of plots to motivate the previous statements.
Figure 1: glitchgram showing the omicron triggers of the last 24 hours. The bottom plot shows their rate, which remains under control and below the 1-per-minute level (the one from O3).
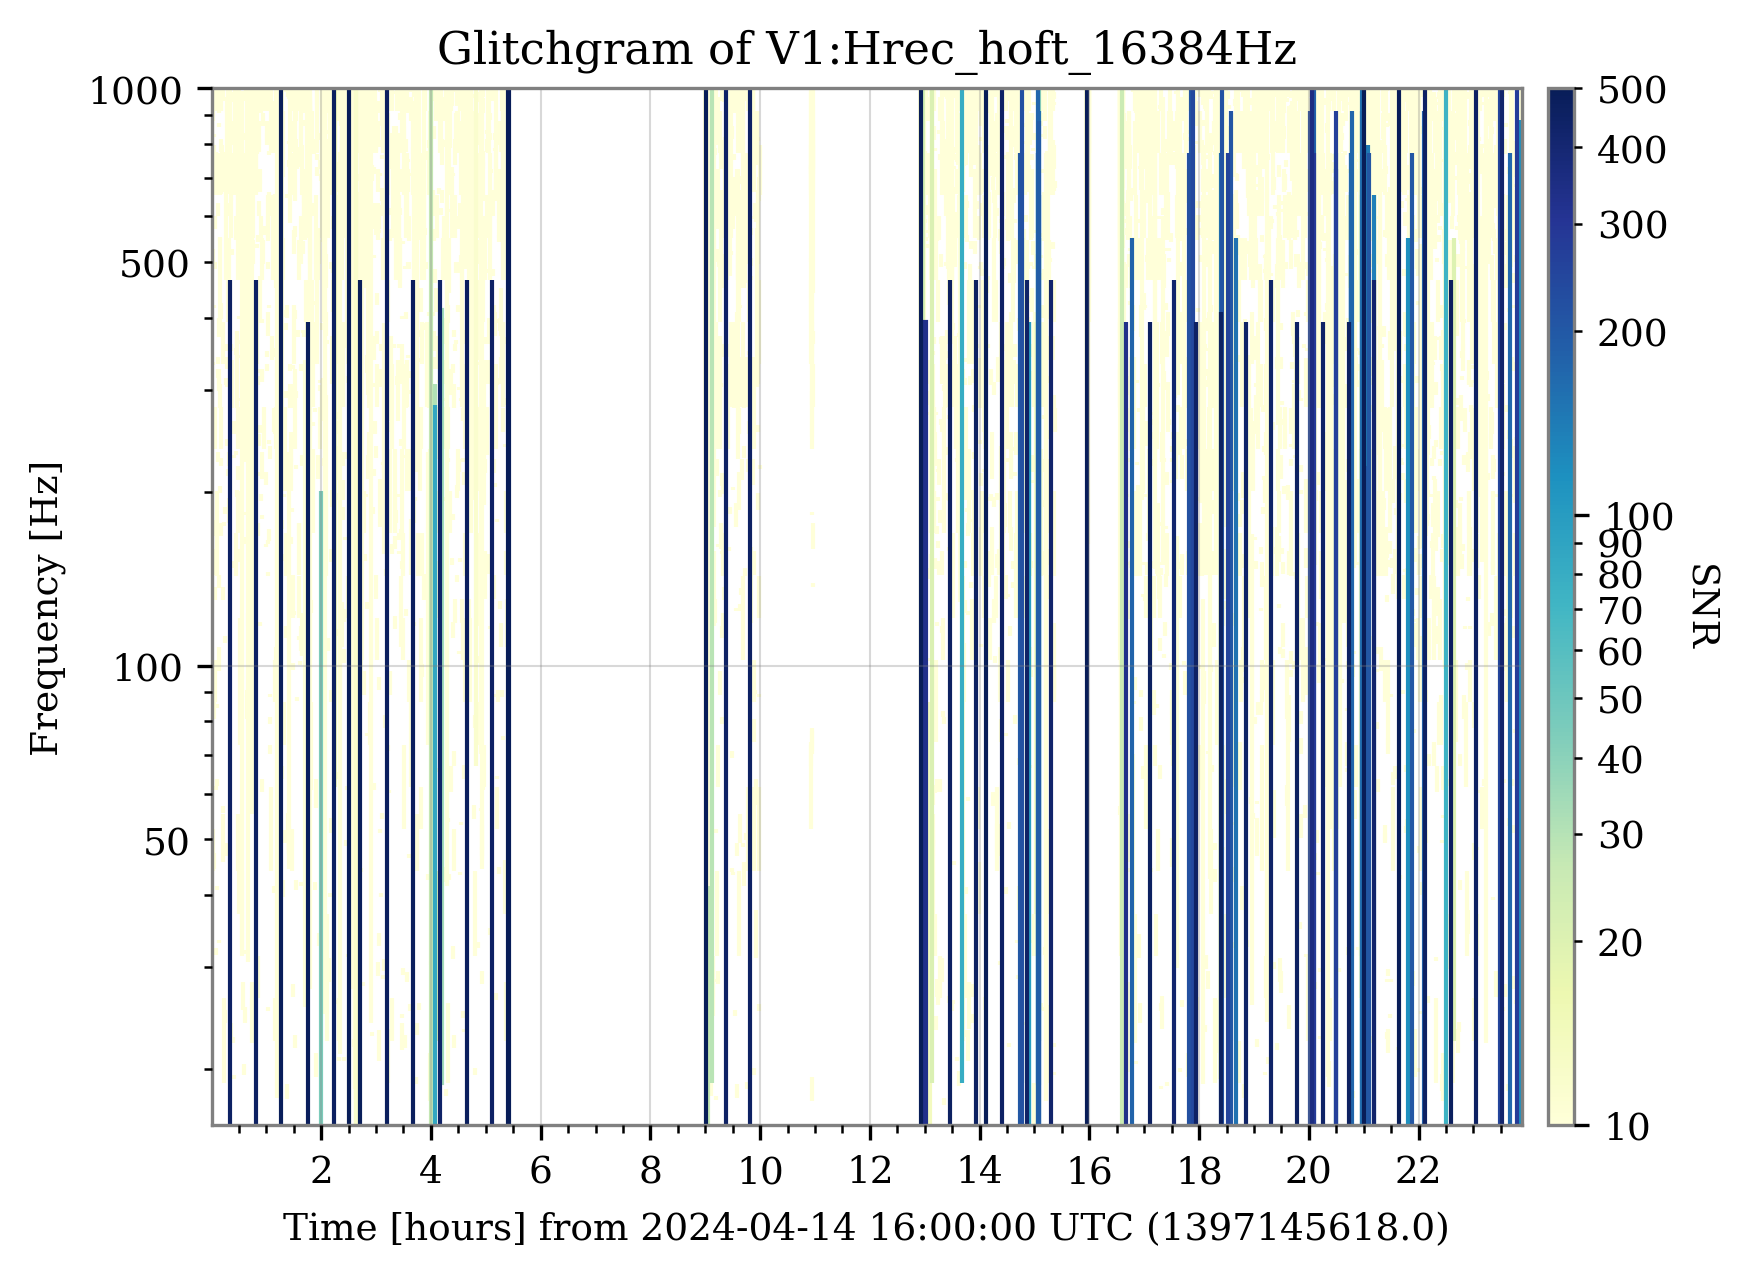
Figure 2: "rectanglegram" showing, in addition to the previous plot, the frequency extent of each glitch.
Figure 3: median normalized spectrogram to show that the noise level has remained on average the same, despite the presence of these new glitches.
Figure 4: spectrogram of one of these glitches. They are quite different from the infamous 25-minute ones, and present a repeated excess energy structure.
I will follow up with some correlation study results (hopefully).


Figure 1. As reported by others at the daily meeting, there are new loud glitches in h(t) since the lock of this morning at ~4 UTC
Figure 2. These glitches are visible in the BNS range as drops that last 1-2 minutes, both in Hrec and Hrec raw (so it is not a noise subtraction filter in Hrec having issues). They don't seem to be due to PR F0 glitches nor to B1 photodiode saturations.
It would be good to know from detchar how much of a problem these glitches are for data analysis. And if any correlation with other sensors can be found.


I'm investigating this issue, without much success for the moment. From the point of view of data analysis, they are not a major problem, as long as their duration is short, their number/rate remains low enough, and they are just glitches, not increased baseline noise. I add just a couple of plots to motivate the previous statements.
Figure 1: glitchgram showing the omicron triggers of the last 24 hours. The bottom plot shows their rate, which remains under control and below the 1-per-minute level (the one from O3).
Figure 2: "rectanglegram" showing, in addition to the previous plot, the frequency extent of each glitch.
Figure 3: median normalized spectrogram to show that the noise level has remained on average the same, despite the presence of these new glitches.
Figure 4: spectrogram of one of these glitches. They are quite different from the infamous 25-minute ones, and present a repeated excess energy structure.
I will follow up with some correlation study results (hopefully).
Would be good to check if saturation flags are able to veto these glitches
Yes saturation flags see them -- and lead to the state vector CAT1 being activated. See for instance https://vim-online.virgo-gw.eu/resources/2024-04-07/resources/20240407_sum_statevector2d.png (bit #10) and the attached plot.
I'll prioritize resurrecting O3-like scripts that scan the state vector CAT1 bit and the saturation flags when we are in Science mode.

Summary
- DIFFp line amplitude need to be reduced by at least a factor 1.5 to avoid glitches due to saturation
- Would be good to check if saturation flags are able to veto these glitches
- A sin^2 transition instead of linear could reduce the amplitude of glitches, maybe by a large factor.
- Updating the blending filters of the B1 photodiode could reduce the amplitude of the glitches by a factor few.
There have been periods of loud glitches that were reducing the range over the weekend. These were reported by the operator.
Figure 1. Many of them are due to B1 photodiode audio channel saturation. The B1 fluctuations are dominated by the DIFFp lines (4.8Hz and 5.2Hz) and by the SDB1/OMC TX line (4.3Hz)
Figure 2. A week ago the B1 peak to peak fluctuations were about a factor 2 smaller, but now the fluctuations are all the time close to saturation.
Figure 3. There are glitches also without saturation, so there might be an additional problem than just B1 photodiode saturation.
Figure 4 Compares the Blended PD signal and the DC channel spectrum. When the audio channel saturates the DARM (B1) signal uses the DC channel only, which is much more noisy, hence a glitch is unavoidable. Hower the spectrum of the glitches looks very different.
Figure 5 shows a zoom on transition when the switch from blended to DC channel happens. It needs to be fast, but also has sharp kinks. Using a sin^2 shaped relay instead of linear could reduce the glitch amplitude due to the transient.
FIgure 6 the blending filter is not very good, it deviates by more than 10% in the 2-3Hz region. This could makes the transition between DC and blend channels larger, even though it is actually very small (0.1% as shown on figure 5).


Would be good to check if saturation flags are able to veto these glitches
Yes saturation flags see them -- and lead to the state vector CAT1 being activated. See for instance https://vim-online.virgo-gw.eu/resources/2024-04-07/resources/20240407_sum_statevector2d.png (bit #10) and the attached plot.
I'll prioritize resurrecting O3-like scripts that scan the state vector CAT1 bit and the saturation flags when we are in Science mode.
We have analysed all the raw channels with units of position, speed and acceleration, transforming them to reproduce the frequencies of the arches. The results confirm the V1:SBE_EIB_GEO_* family as the channels that reproduce best the frequency of the arches in LSC_SRCL. Speed and acceleration channels are not good predictors of these arches.
In the attachments, three text files with the most correlated position channels (truncated to Pearson correlation values larger than 0.1), speed and acceleration channels (truncated to 0.04).
As already happened a few weeks ago, #63420, associated with the bad weather conditions of this morning and the large microseismic noise, there was an increased rate of scattered light glitches, best witnessed by LSC_SRCL, and reproduced by the V1:SBE_EIB_GEO_H2_200Hz channel.
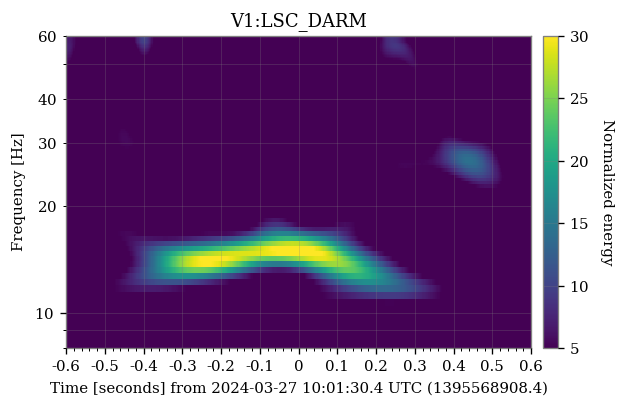
Figure 1: spectrogram of a scattered light glitch in LSC_DARM.
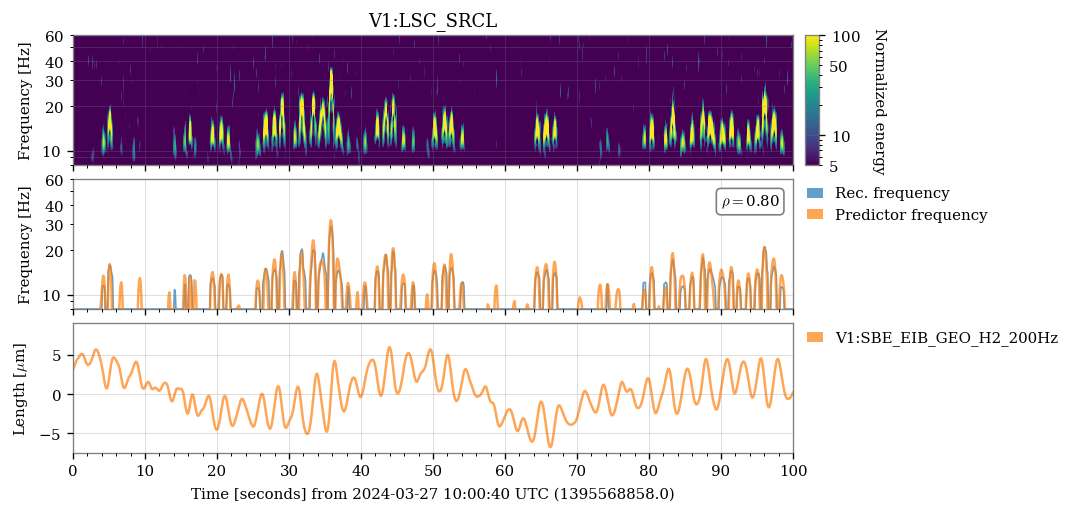
Figure 2: Top: spectrogram of several scattered light glitches in LSC_SRCL. Middle: extracted arch frequency and predicted frequency of the scatterer surface according to the equation , with
the laser frequency,
the speed of the scatterer, equals to the time derivative of SBE_EIB_GEO_H2_200Hz channel, and
the number of times stray light gets reflected back and forth between the test mass and the scatterer before it joins the main beam arXiv:2007.14876 . Notice that the y-axis is the same for both the reconstructed frequency of the arches and the predicted frequency. In the box, the value of the Pearson correlation coefficient between the two quantities, 80%. Bottom: time series of SBE_EIB_GEO_H2_200Hz.
We are currently running an extended analysis to find other correlated sensors, using the list of position, speed, and acceleration channels documented in this git issue.


We have analysed all the raw channels with units of position, speed and acceleration, transforming them to reproduce the frequencies of the arches. The results confirm the V1:SBE_EIB_GEO_* family as the channels that reproduce best the frequency of the arches in LSC_SRCL. Speed and acceleration channels are not good predictors of these arches.
In the attachments, three text files with the most correlated position channels (truncated to Pearson correlation values larger than 0.1), speed and acceleration channels (truncated to 0.04).
Unless the ticks fool me, at 20 Hz the ASD is "a little more than" , and at 40 Hz something between
and
. This means a power-law exponent between
and "a little less than" .
At these frequencies, the glitch ASD could be affected by the noise background. We can move upward and repeat the estimate around the frequencies of the maximum intensity identified by omicron triggers, which is around 40 Hz. For example, from Didier's plot, the ASD is about at 30 Hz and
at 70 Hz. This leads to a power-law exponent of -2.72.
This is somewhat midway between a step function, as explained by Michal, and an impulsive force, like a Dirac delta, whose response would have produced a power law with exponent -2. And, just looking at the math, an exponent of -2.5 could be the response of a "hyperbolic-step-function" of the form
...whatever may produce it.

An explanation for the spectral shape of the glitch is that it is a step function (which has a 1/F shape) applied to the mirror (which has a 1/F^2 response due to the pendulum), which makes in total a 1/F^3 shape.
Looking at the spectrum or at the time-frequency shape of the 25' glitches may give some hint about their origin.
The attached plot shows the spectrum of h(t) when one of those glitches occured.
The h(t) ASD is 3e-21 at 20 Hz and 3e-22 at 40 Hz.
It means that, when the glitch occurs, h(t), below 100 Hz, behaves like 1/f^3.33
I guess that a kink on the NE or WE marionnetta actuators would produce a 1/f^4 glitch in h(t)
And a kink on the NE or WE mirrors actuators would produce a 1/f^2 glitch in h(t).
Just a remark: the mystery noise is 1/f^0.66 and 3.33+0.66 = 4. But this is just numerology!
Has anyone a good explanation for the glitch spectrum shape 1/f^3.33 ?

An explanation for the spectral shape of the glitch is that it is a step function (which has a 1/F shape) applied to the mirror (which has a 1/F^2 response due to the pendulum), which makes in total a 1/F^3 shape.
Unless the ticks fool me, at 20 Hz the ASD is "a little more than" , and at 40 Hz something between
and
. This means a power-law exponent between
and "a little less than" .
At these frequencies, the glitch ASD could be affected by the noise background. We can move upward and repeat the estimate around the frequencies of the maximum intensity identified by omicron triggers, which is around 40 Hz. For example, from Didier's plot, the ASD is about at 30 Hz and
at 70 Hz. This leads to a power-law exponent of -2.72.
This is somewhat midway between a step function, as explained by Michal, and an impulsive force, like a Dirac delta, whose response would have produced a power law with exponent -2. And, just looking at the math, an exponent of -2.5 could be the response of a "hyperbolic-step-function" of the form
...whatever may produce it.