Summary of the shifts 7-8-9/11/17
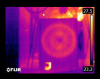
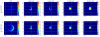
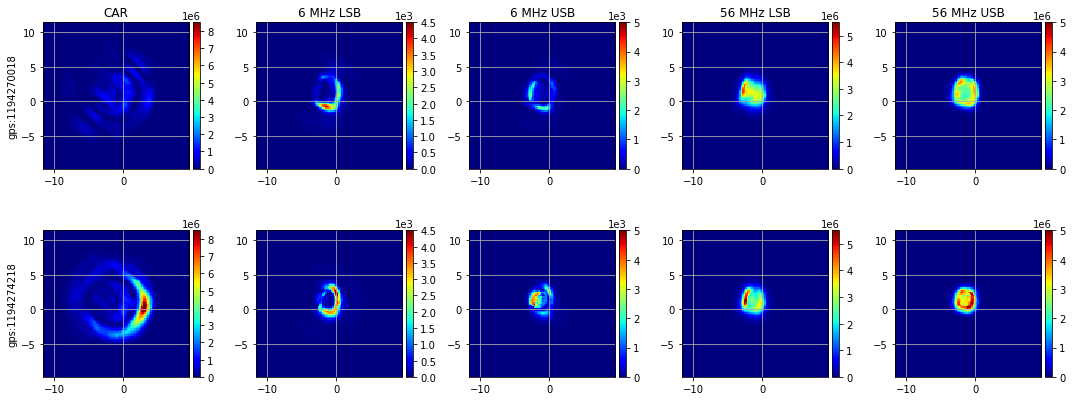
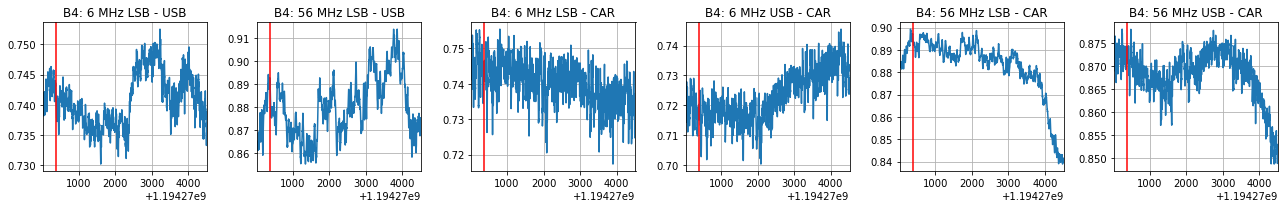
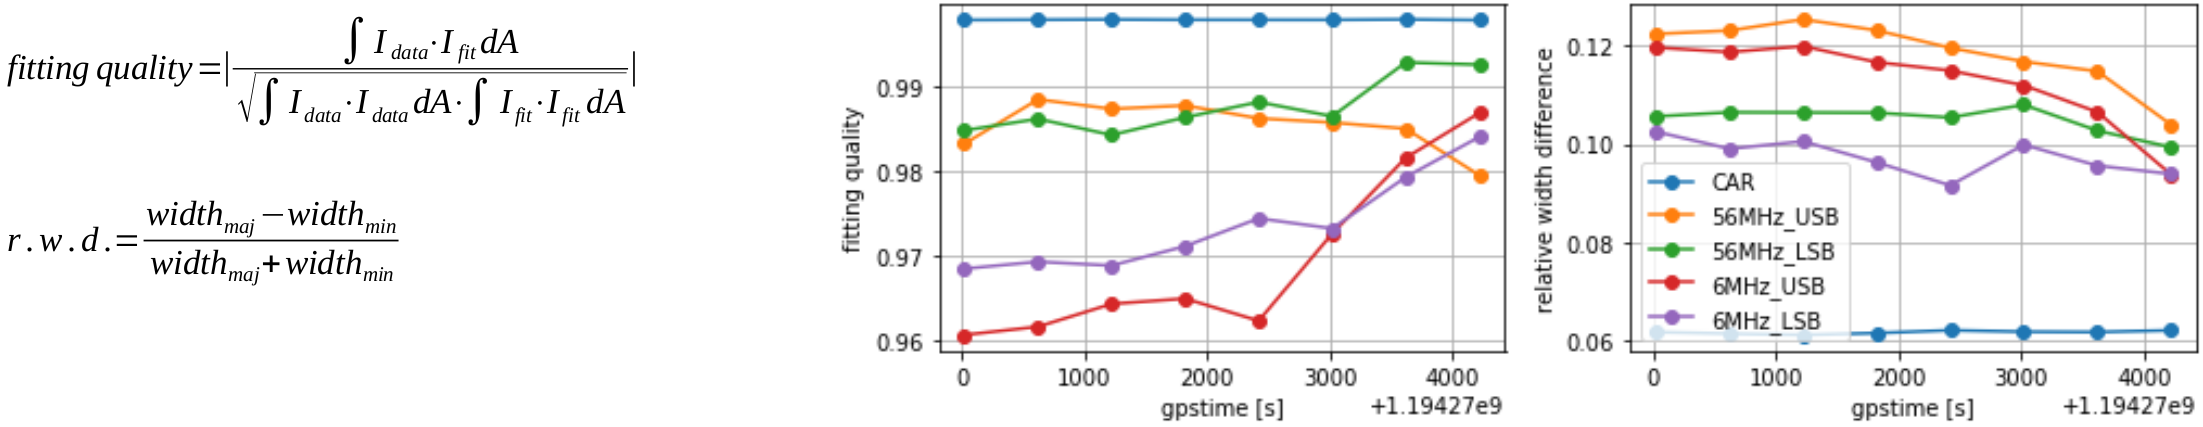
During these shift we worked on the CO2 benches for the fine tuning of the intensity distribution on the DAS beams (in the figure 1 the NI DAS in the CP position is shown).
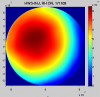
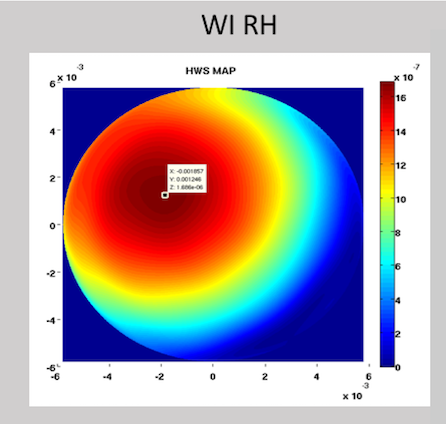
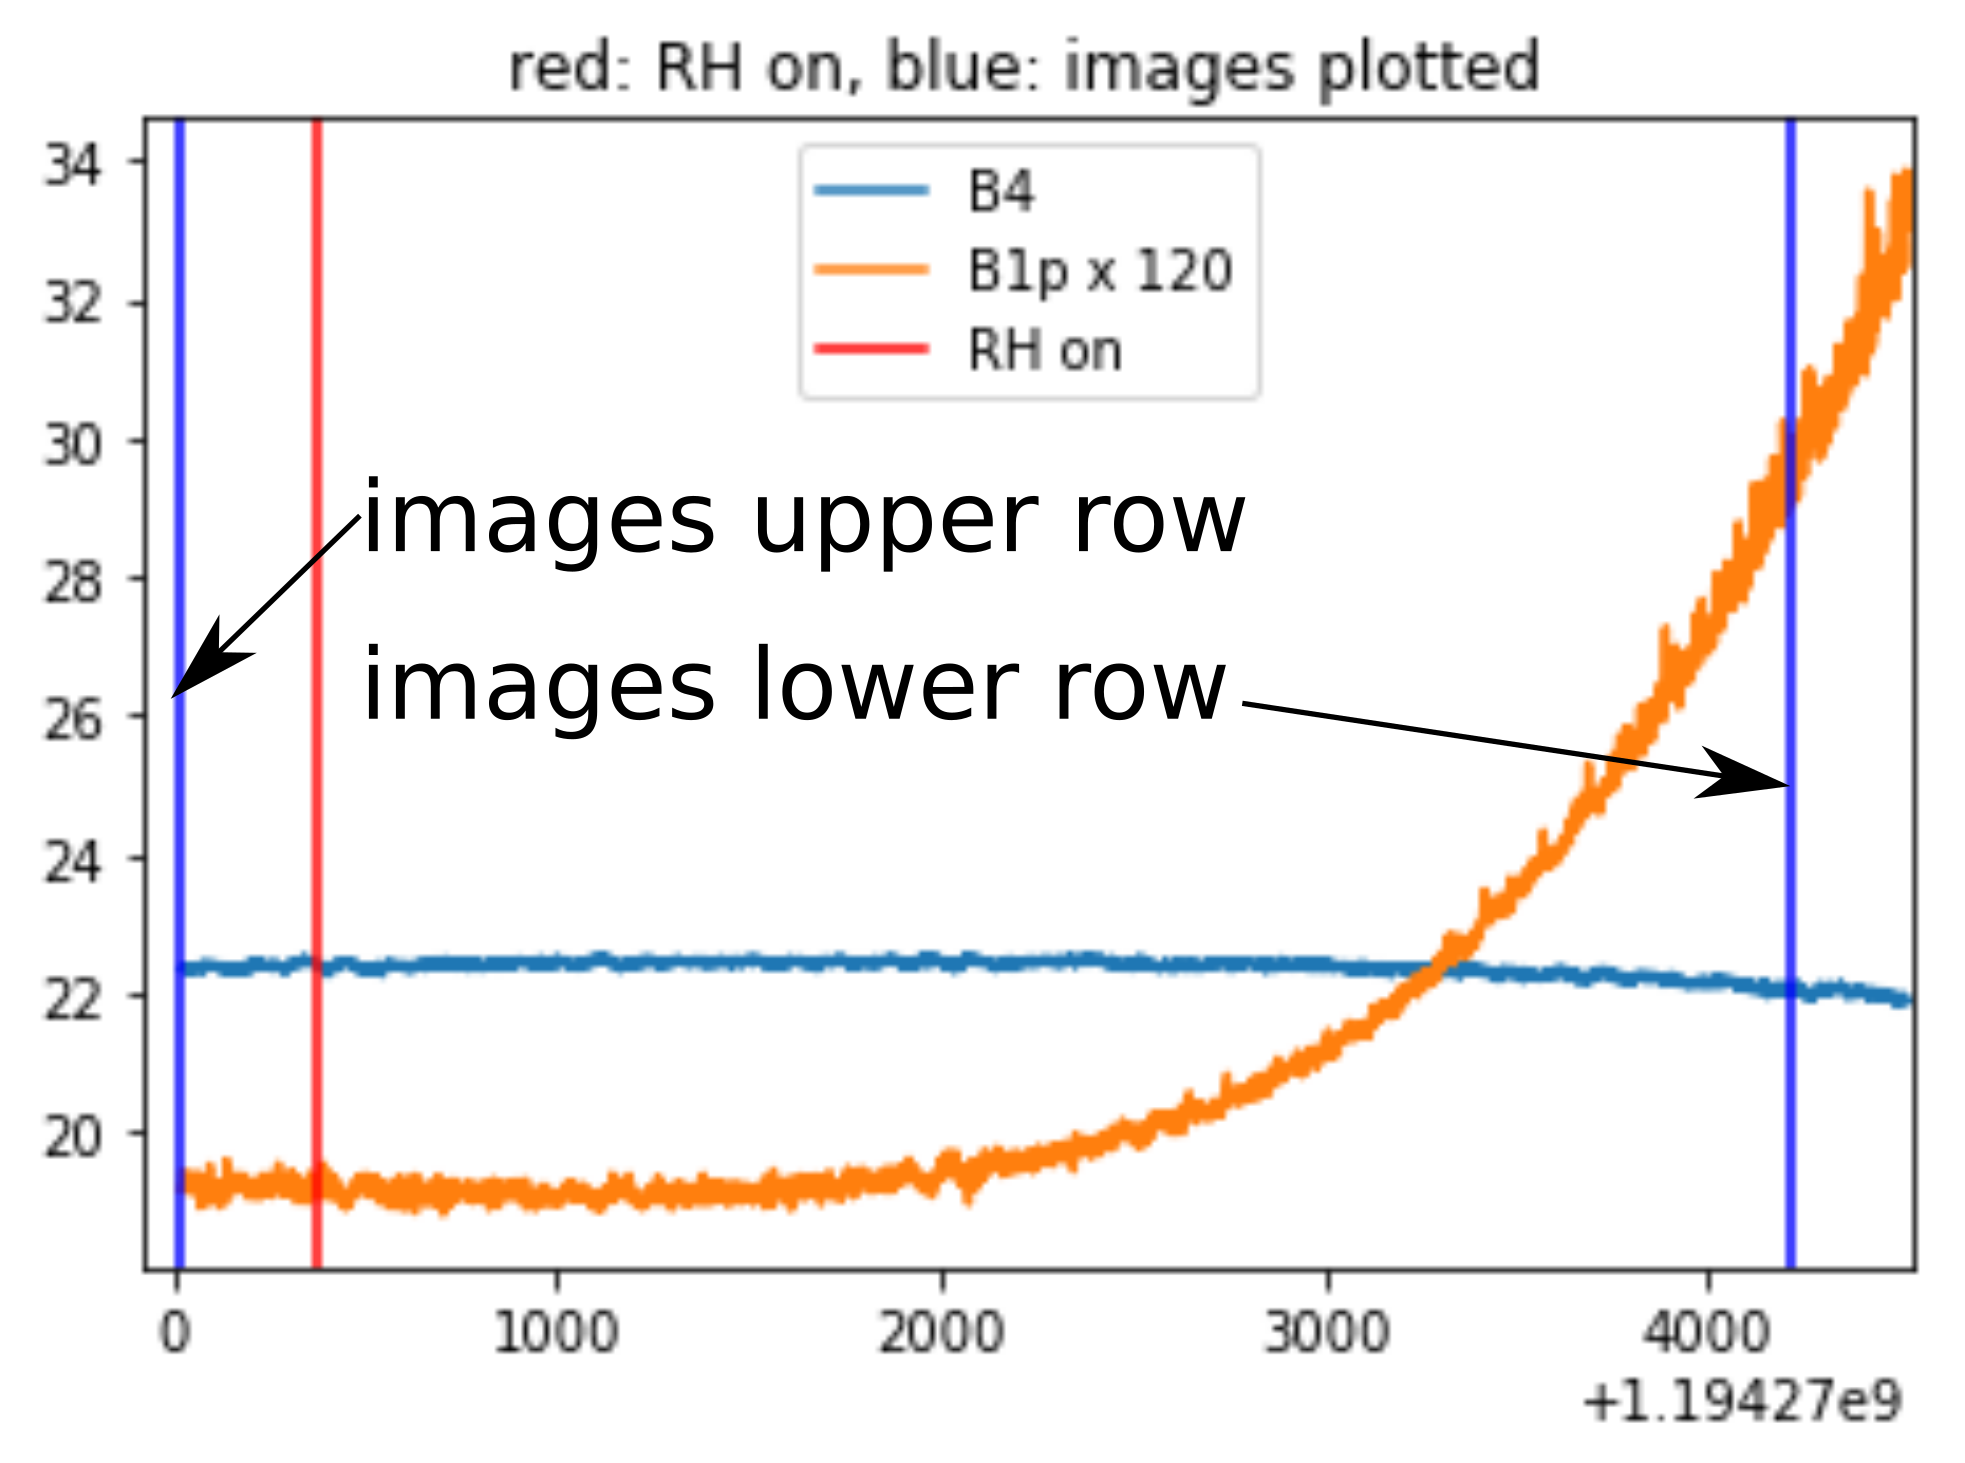
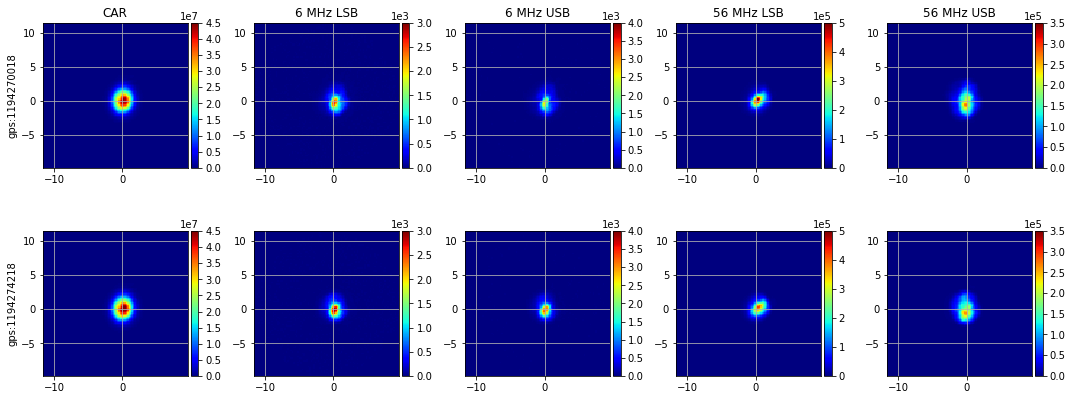
Today we have turned on the WI RH to check the position of the TM center on the HWS maps:
RH ON-> 13.46 UTC
RH OFF->15.30 UTC
P_{dissipited)=2 W (1 W for each ring)
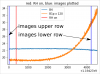
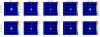
The position has not changed as you can see in figures 2 and 3.
During these shift we worked on the CO2 benches for the fine tubino of the intensità distribution on the DAS beams (see figure 1).
Today we have turned on the WI RH to check the position of the TM center on the HWS maps:
RH ON-> 13.46 UTC
RH OFF->15.30 UTC
P_{dissipited)=2 W (1 W for each ring)
THe position has not changed as you can see in figures 2 and 3.


