Yesterday I had noticed that beside SDB2 scattered light many glitches are seen in coincidence with B4 DC and the MICH error signal. To confirm that I have retrieve omicron triggers for Hrec_hoft and LSC_MICH between 4:00 UTC and 5:00 UTC this morning (July 26), that have an SNR>10 and a peak frequency below 50Hz. And looked for coincidence between them within a 100ms window.
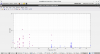
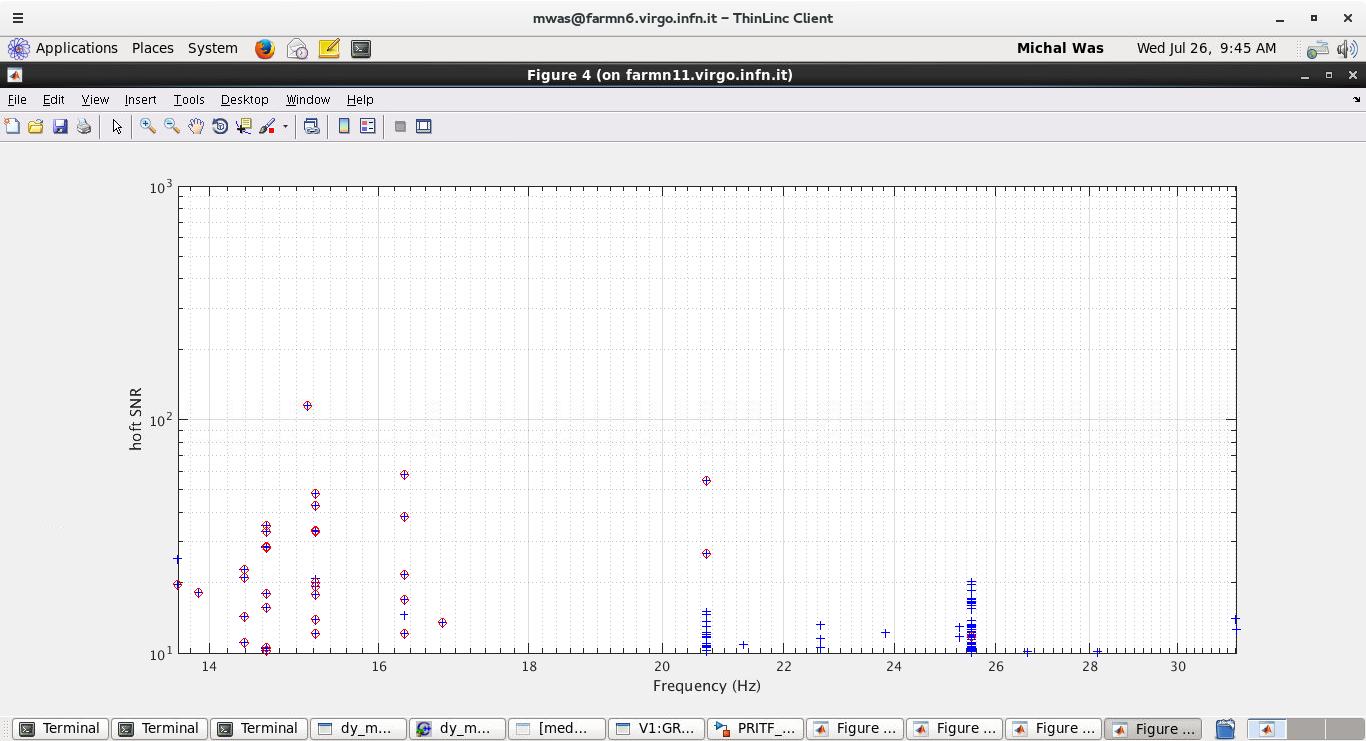
Figure 1, shows the hoft SNR as a function of frequency. Blue pluses are all the hoft glitches selected, and circled in red are the ones which are coincident with MICH glitches. The glitches peaking between 14Hz and 17Hz are clearly coincident.
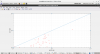
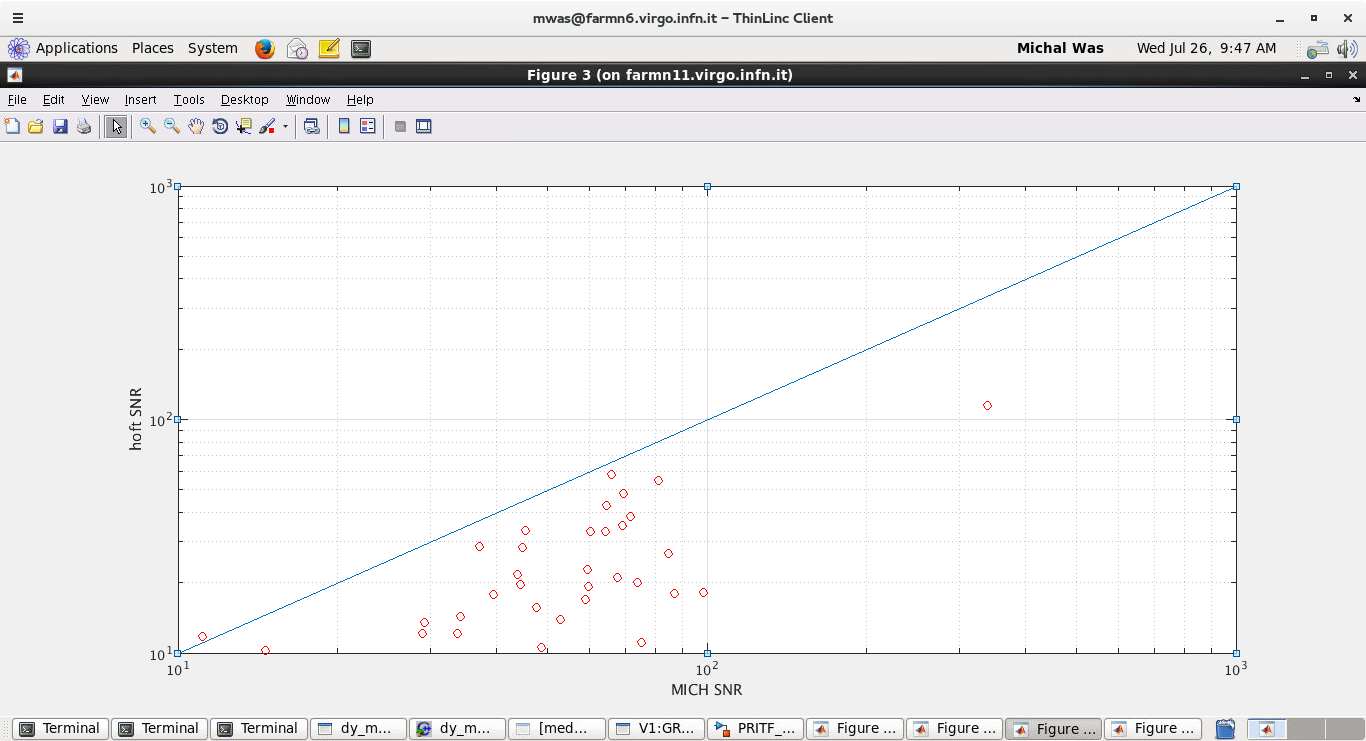
Figure 2, shows the hoft SNR vs the MICH SNR for the coincident glitches. And clearly the glitch has a larger SNR in MICH than in hoft (the blue line is a guide for the eye for equal SNR).
This is not surprising as below 25Hz the hoft noise is dominated by the MICH noise coupling to DARM. These MICH glitches might be gain peaking in the MICH loop that comes with fluctuations in optical gain or it could be something else.
A more systematic study would be needed to fully characterize this, but it would nice to create a veto or flag based on the MICH glitches below 50Hz. So that we can class this kind of glitches in a category even though data below 20Hz probably won't be used for any searches.