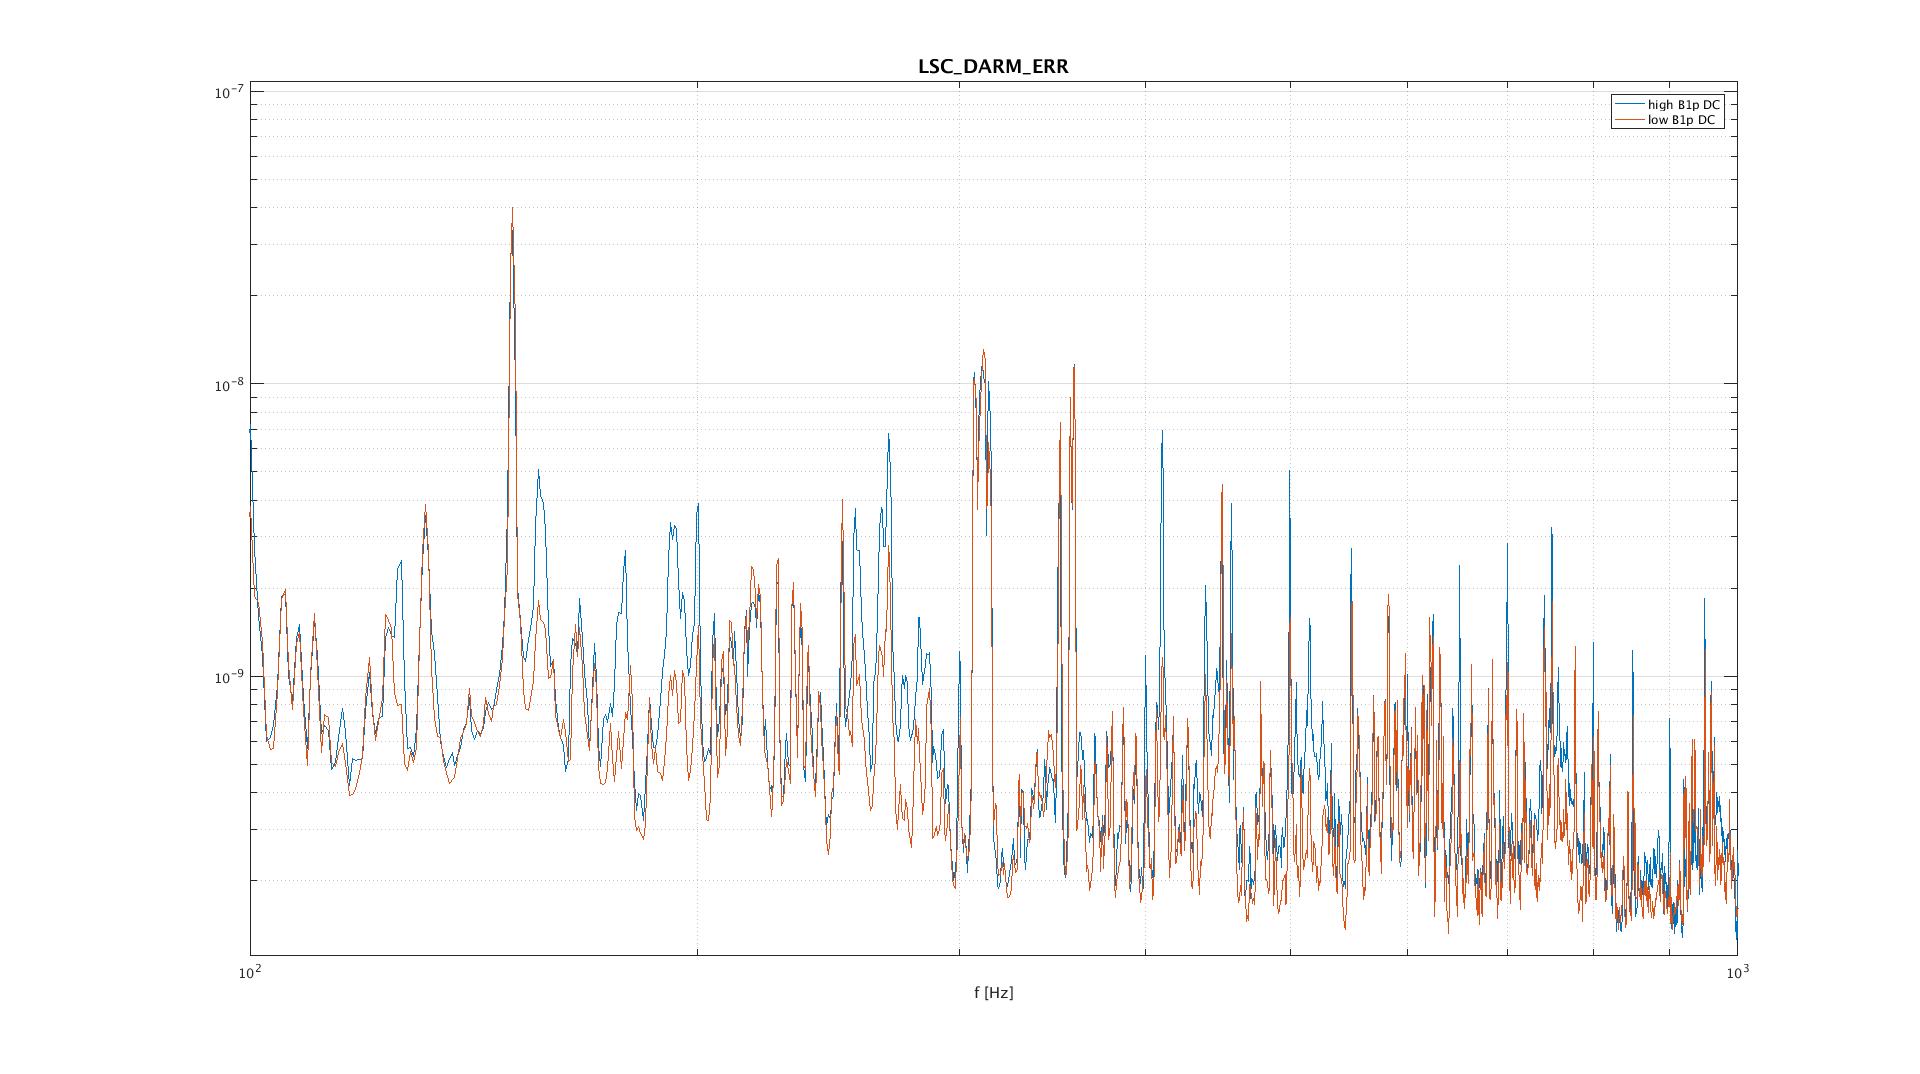
It can be useful to identify the structures in the sensitivity which amplitude depends on B1p alignment. It is not so hard, because there are periods lasting some tens of seconds with low level of B1p_DC (for example, 1179866636, lasting 40 s). Comparing the spectrum of DARM that condition to a normal condition (Fig. 1), many differences are visible.
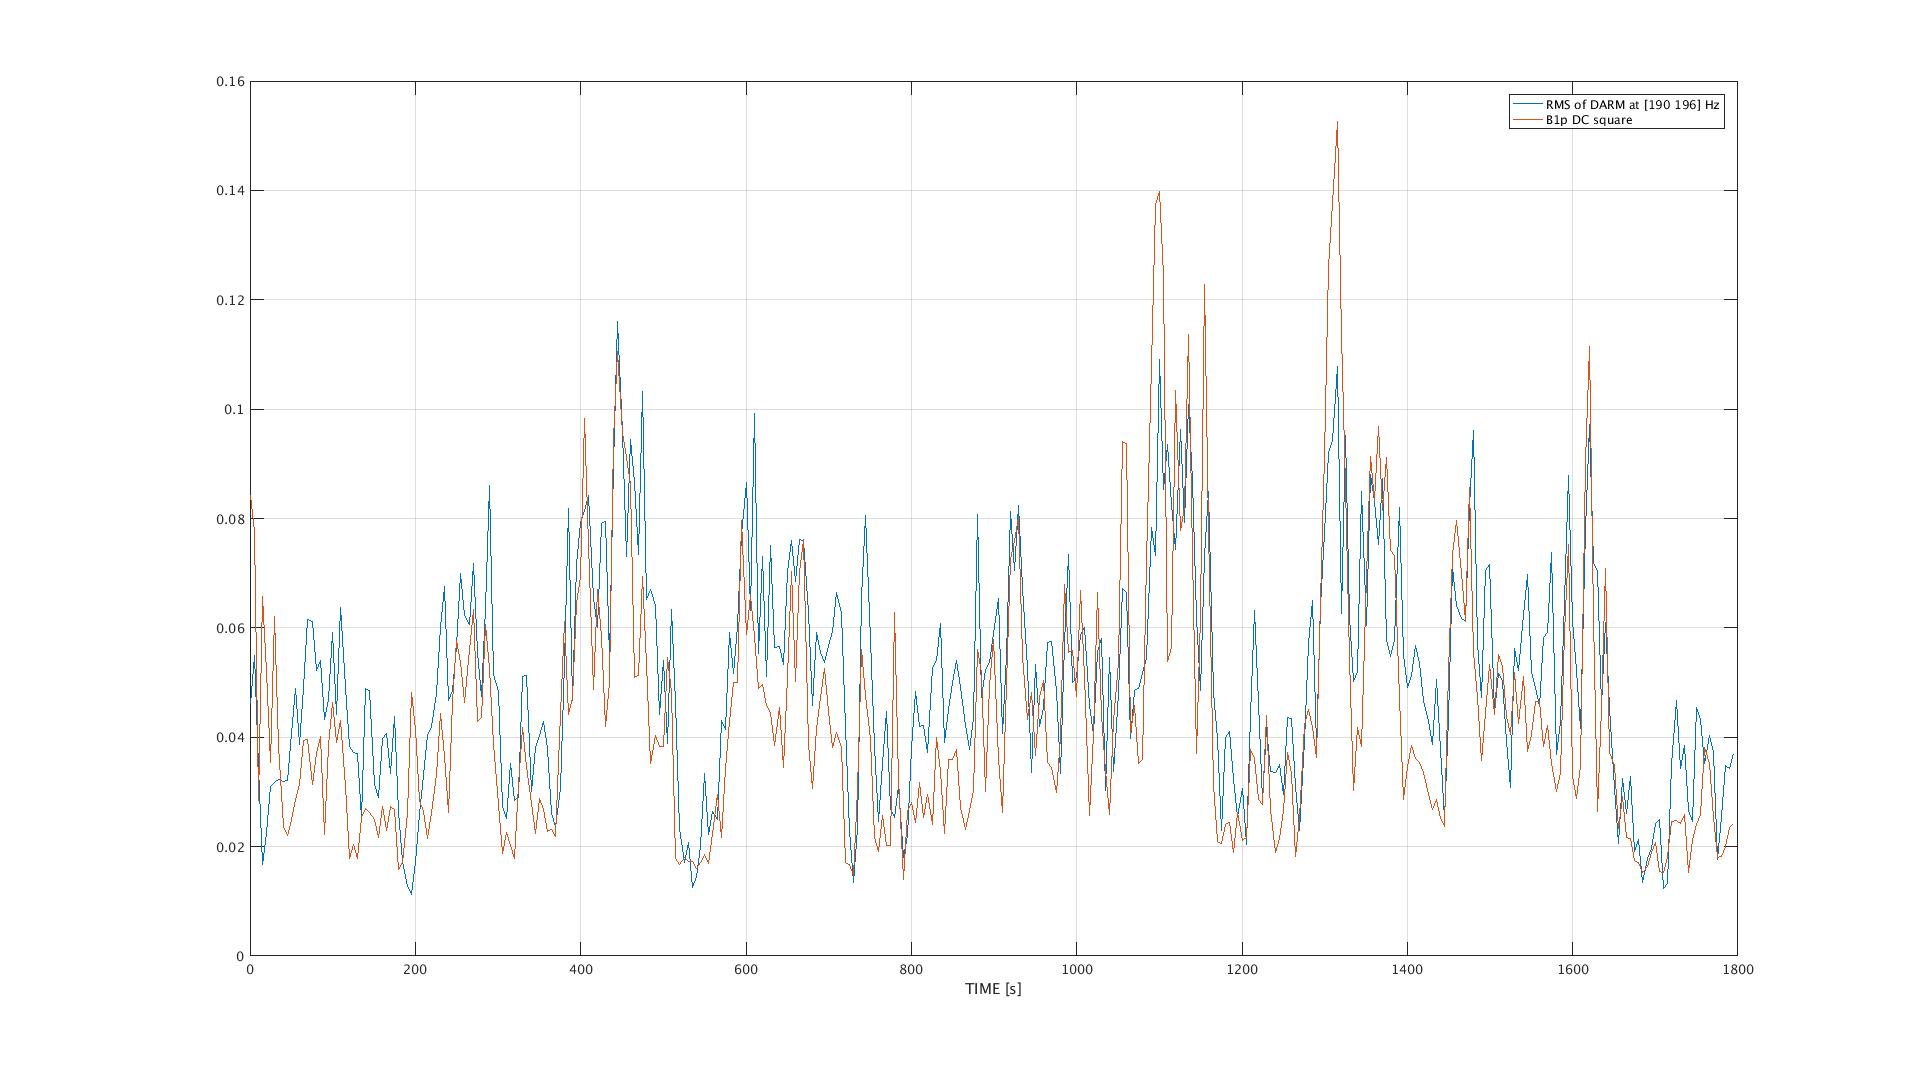
The rms of one of that structures (193 Hz) has been computed during 1800 seconds of lock (one point each 5 seconds). The result has been superposed to the time series of B1p_DC square (Fig. 2). The correlation is almost perfect.
