Summary:
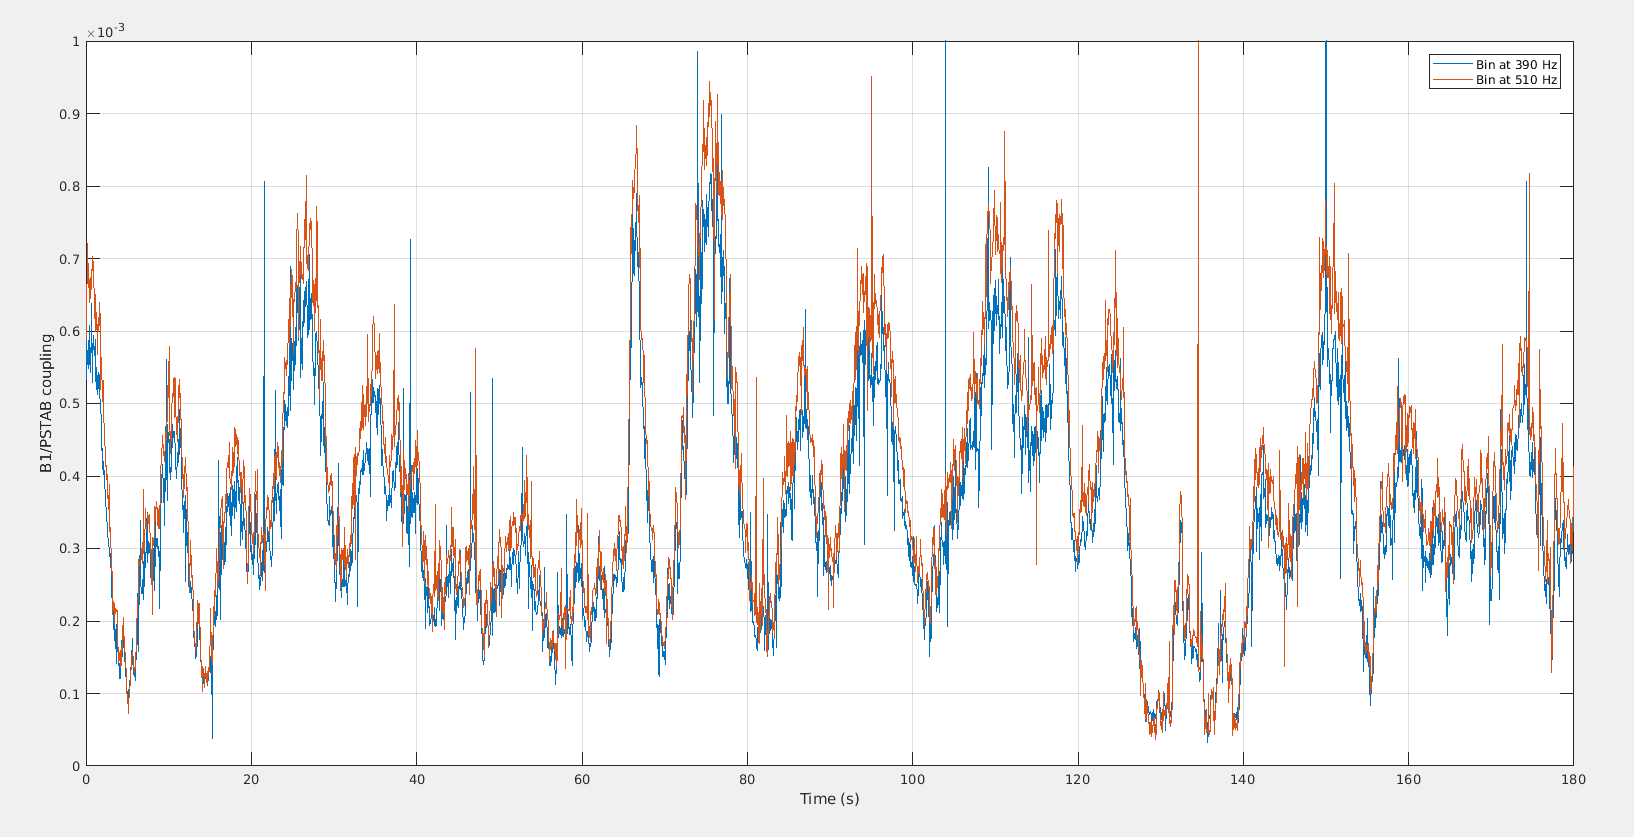
- Coupling of PSTAB to B1 fluctuates in time by a factor few, the data needs to be analyzed more to find how and why the coupling fluctuates
- On one side of SDB1 vertical the coupling increases by a factor 2, this correspond to an increase in B1s2 power, the likely explanation is that more of the 56MHz TEM10 mode passes through the OMCs with that offset, and increases the PSTAB coupling
- On the other side the order~10 HOM becomes brighter, but there is no big change in PSTAB coupling.
8:10:30 UTC PSTAB loop open - 3 min of reference data
increased B1 camera gain.
08:15 UTC 3min, B5_QD2_V_offset=10
08:20 UTC 3min, B5_QD2_V_offset=20
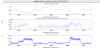
Figure 1 PSTAB coupling increases with larger SDB1 angular offset, but it doesn't seem to be very stable
08:24 UTC 3min, B5_QD2_V_offset=20, PSTAB loop closed
08:29 UTC 3min, B5_QD2_V_offset=0, PSTAB loop closed
08:33 UTC 3min, B5_QD2_V_offset=0, PSTAB loop open
08:38 UTC 3min, B5_QD2_V_offset=-10, PSTAB loop open, coupling at same level as for 0 offset
08:43 UTC 3min, B5_QD2_V_offset=-20, PSTAB loop open, coupling at same level as for 0 offset
08:48 UTC 8min, B5_QD2_V_offset=0, PSTAB loop open, should analyze this data to find how the PSTAB coupling fluctuate in time
08:58 UTC 2min, B5_QD2_V_offset=-20, PSTAB loop open
09:03 UTC 8min, B5_QD2_V_offset=20, PSTAB loop open, coupling is increased again, so for this side of the vertical offset there is a systematic increase in coupling
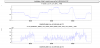
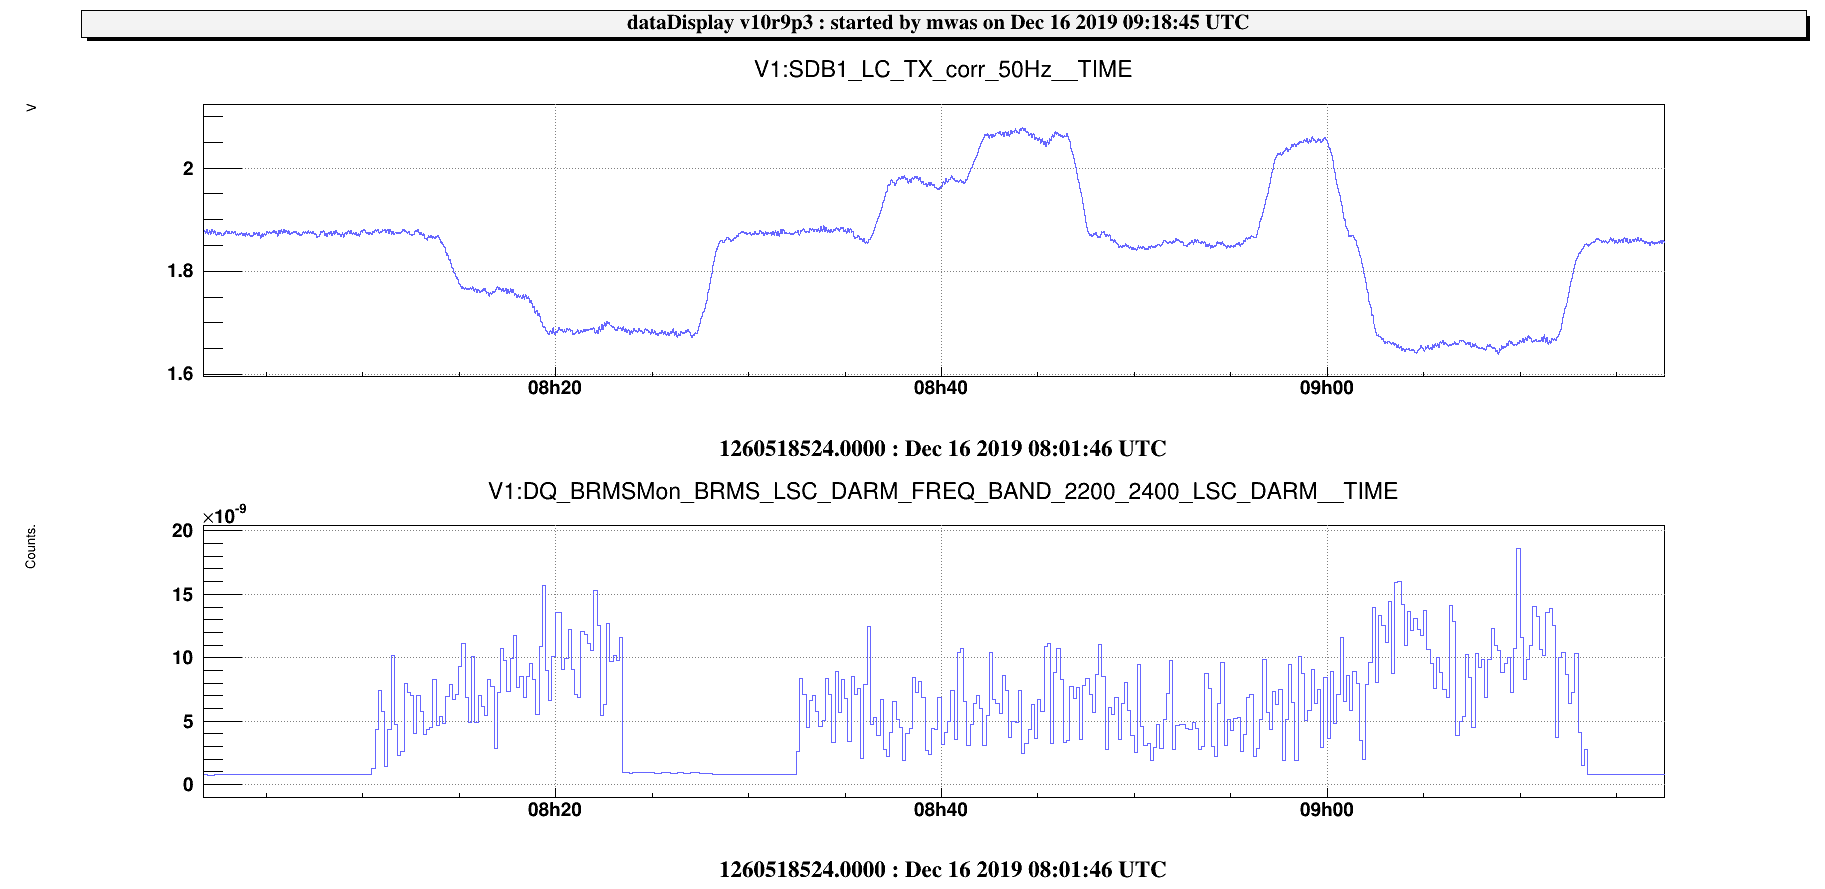
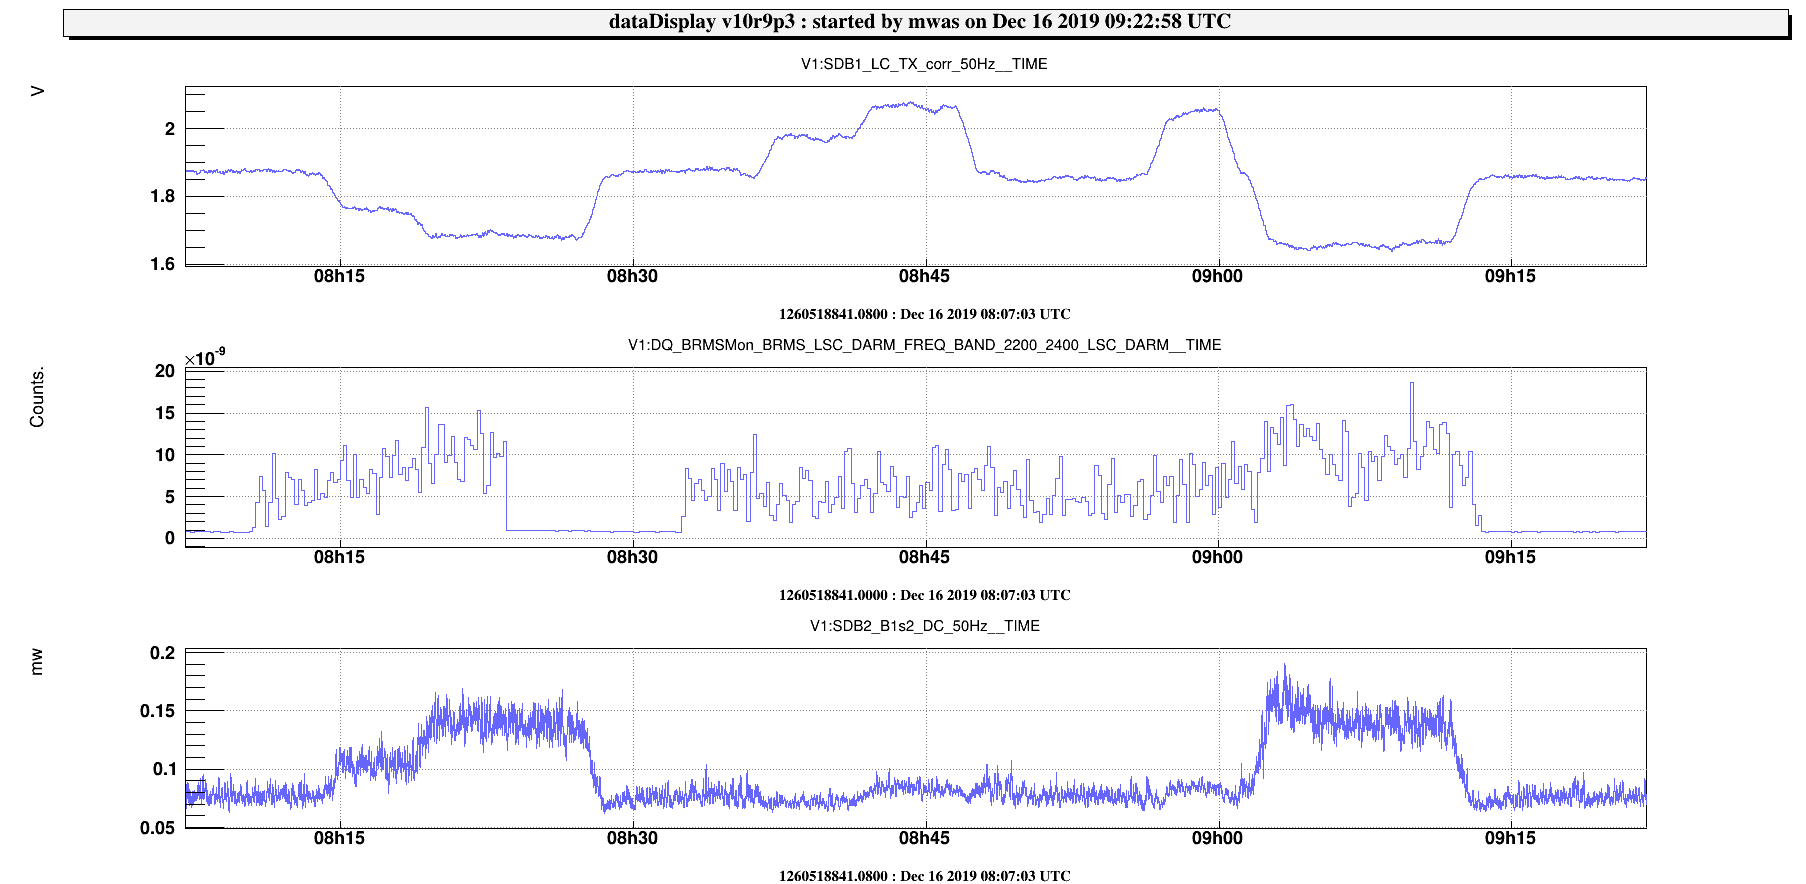
Figure 2 shows the time series of the SDB1 TX correction, which shows the different offset in the SDB1 alignment, and the trend of DARM BRMS at 2.2-2.4kHz, which show the coupling of the PSTAB as a function of time. The coupling fluctuates in time by a factor few. When the TX correction is smaller than in normal conditions (positive offset on B5_QD2_V) then the coupling is larger, but in the opposite direction there is no difference.
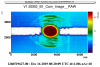
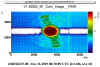
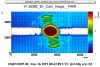
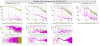
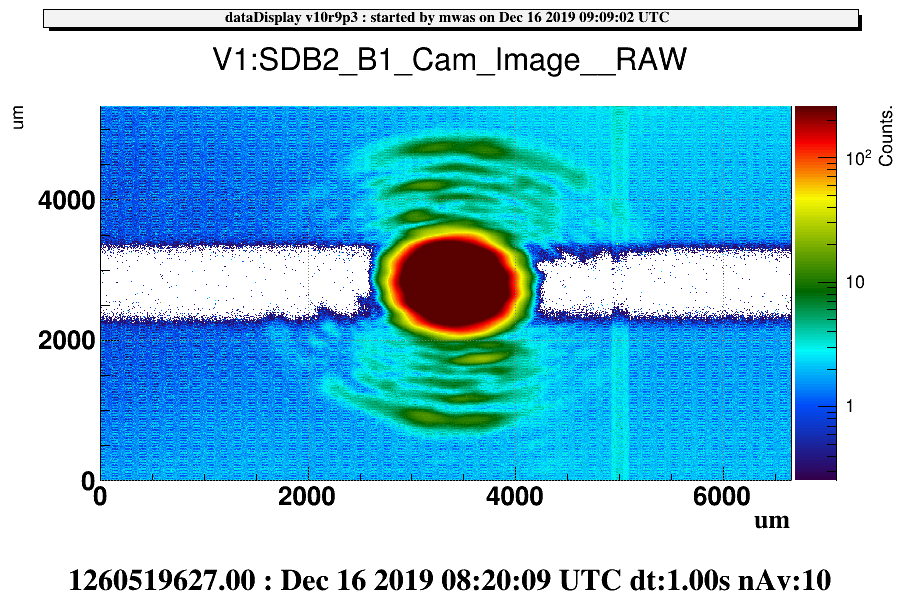
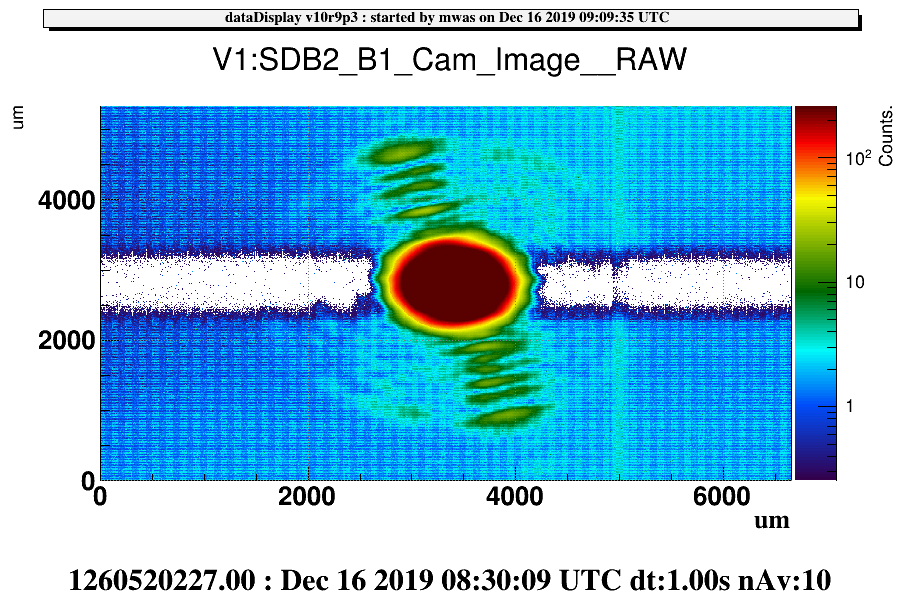
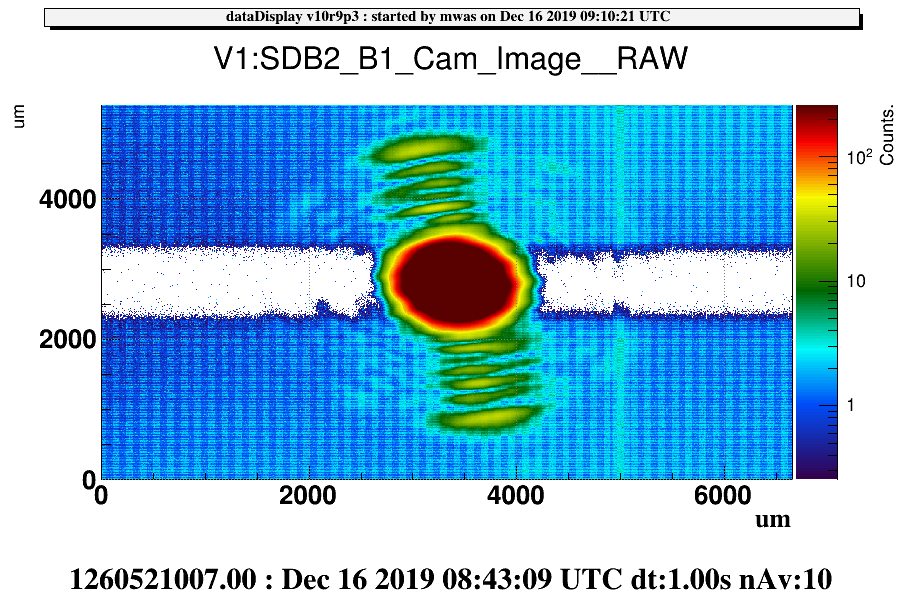
Figure 3 shows the B1 camera image for offset=20 (large coupling, Figure 4 for the case with no offset, and figure 5 for the case with offset=-20 (same coupling as no offset). What is surprising is that for the case with offset=-20, the HOM mode becomes much brighter, but that has no influence on the coupling.
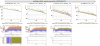
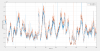
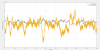
Figure 6, looking at the trend of B1s2, the side where the coupling become higher, corresponds to the side where B1s2 becomes large.
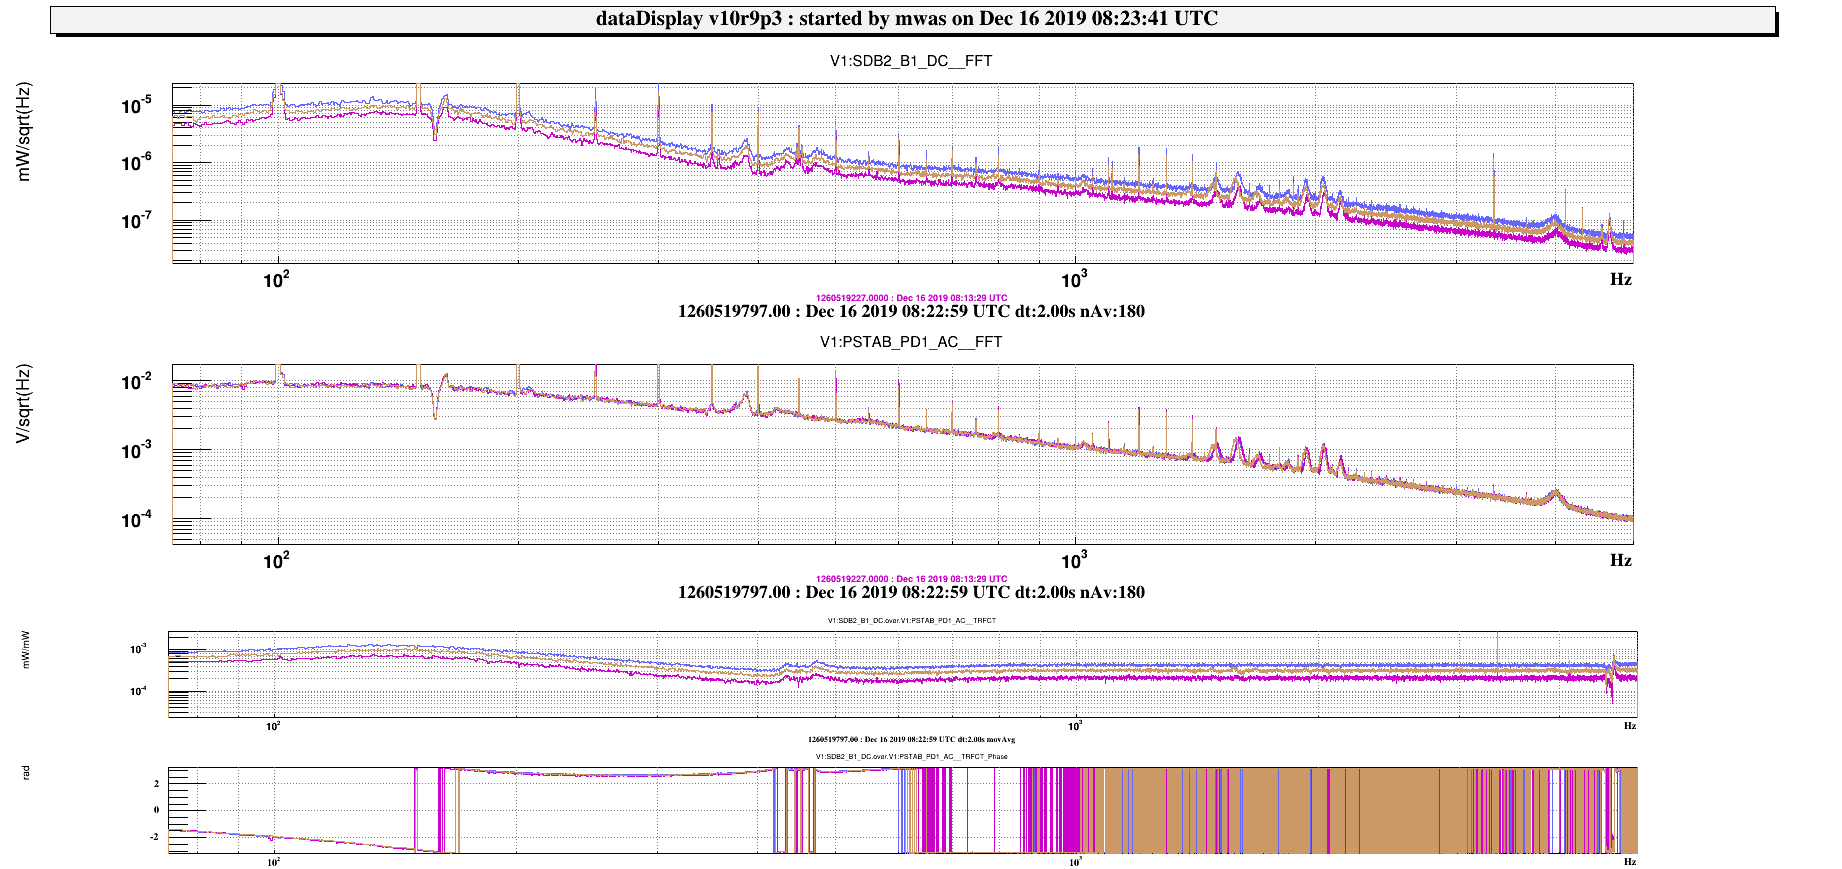
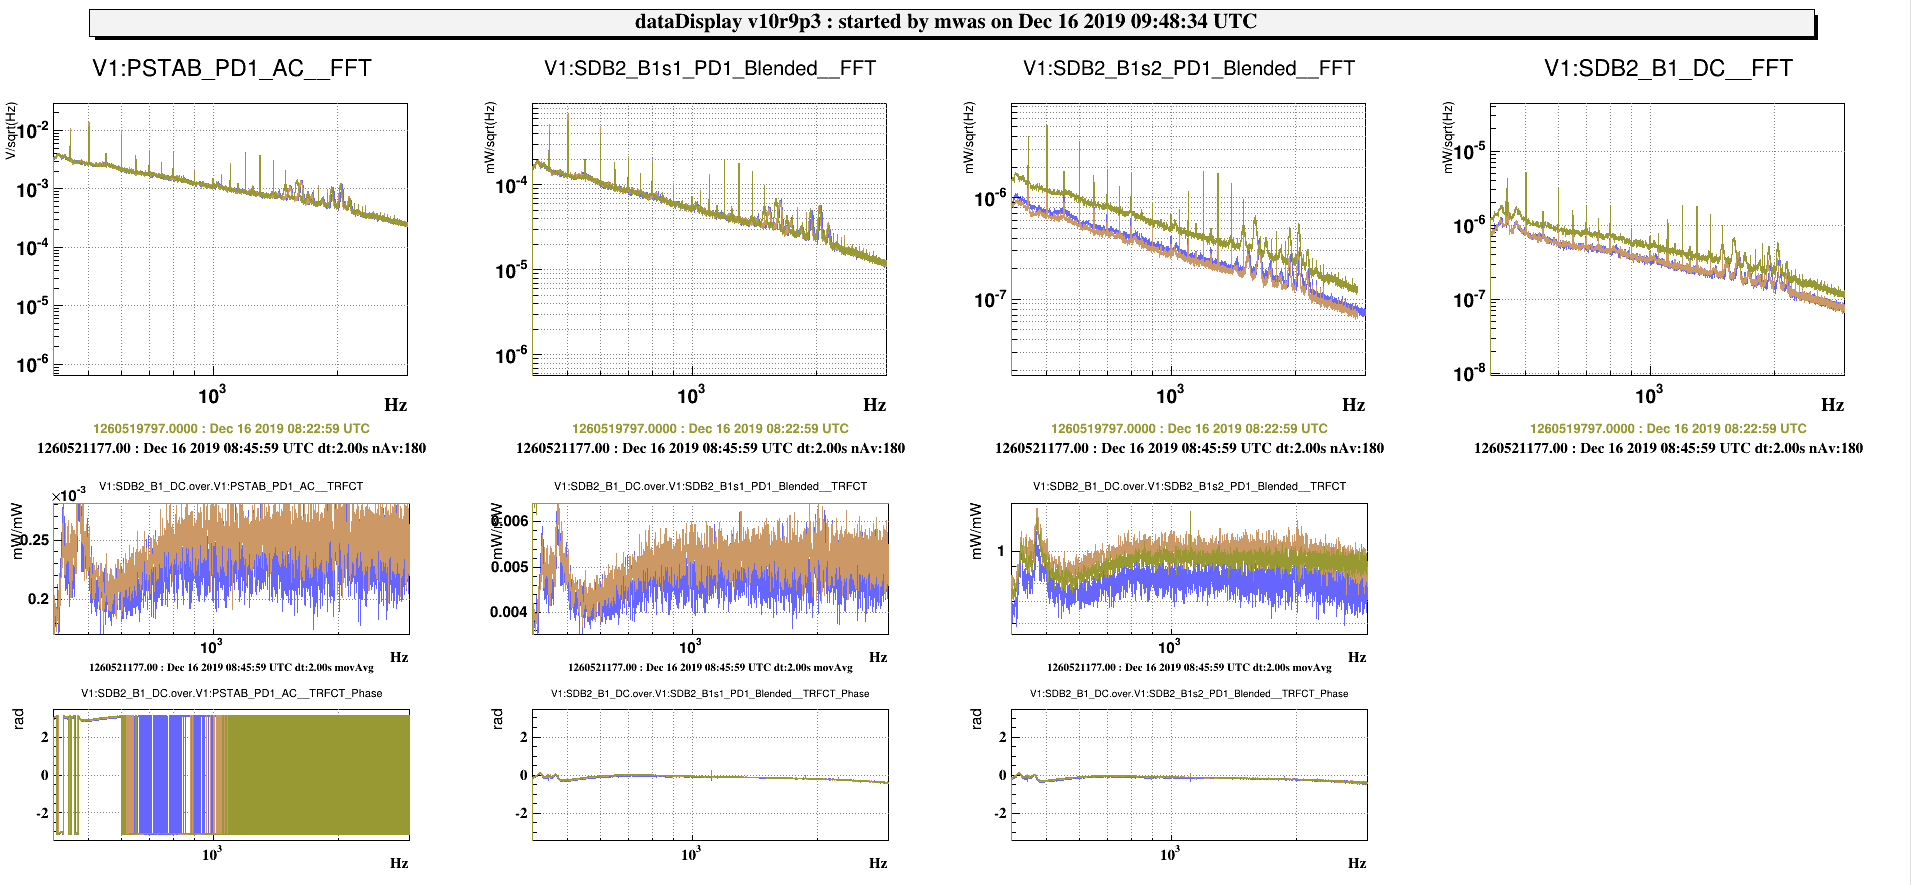
Figure 7 shows the spectra and transfer function to B1 of the PSTAB photodiode, B1s1 and B1s2. In purple is a time when the PSTAB loop is closed, and no offset on SDB1. Brown is with PSTAB loop open and no offset, green with the offset=+20 and blue with offset=-20. When the PSTAB loop is open, not only the RIN of the carrier increases, but also the RIN of the sidebands. For the offset=+20, there is more light on B1s2, hence more fluctuations, but the transfer function doesn't change. This means that for an offset=+20 more junk light (56MHz TEM10?) reaches B1, and the increased coupling of the PSTAB correspond to the increase of that junk light passing through the OMCs.
For the offset of -20, the coupling is slightly smaller. The transfer function from B1s2 is 20% smaller, while for B1s1 and PSTAB it is only 10% smaller. This could be an indication that the 56MHz TEM10 is becoming less dominant, and that the order~10 HOM which become brighter, becomes a more dominant for coupling the PSTAB.
