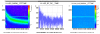
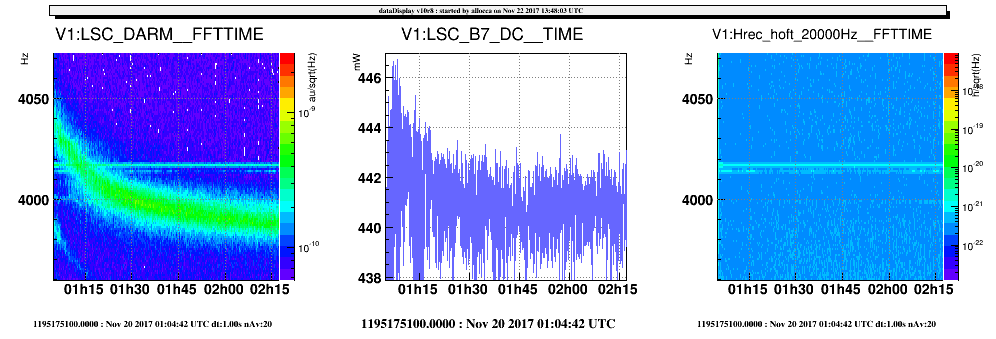
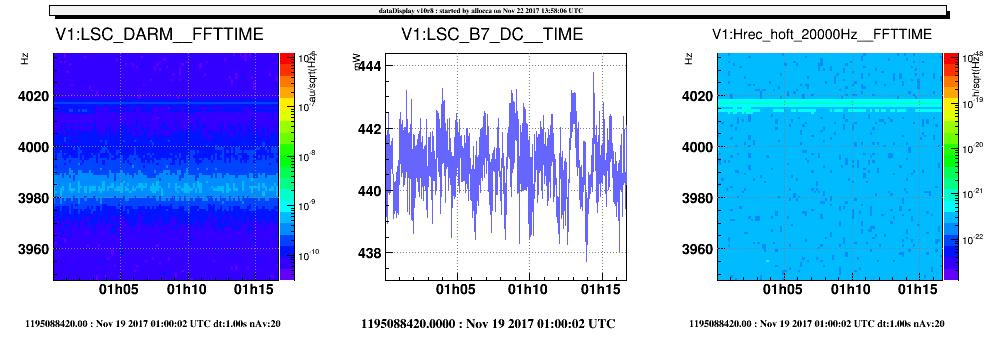
In the DARM spectrum there is a line at about 4 kHz. In particular, one can notice that from the dark fringe lock on, the frequency of this line starts at a higher value and decreases with an exponential decay until becomes stable, with a trend very similar to the arm cavity powers. (see figure 1)
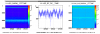
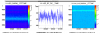
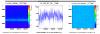
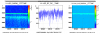
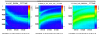
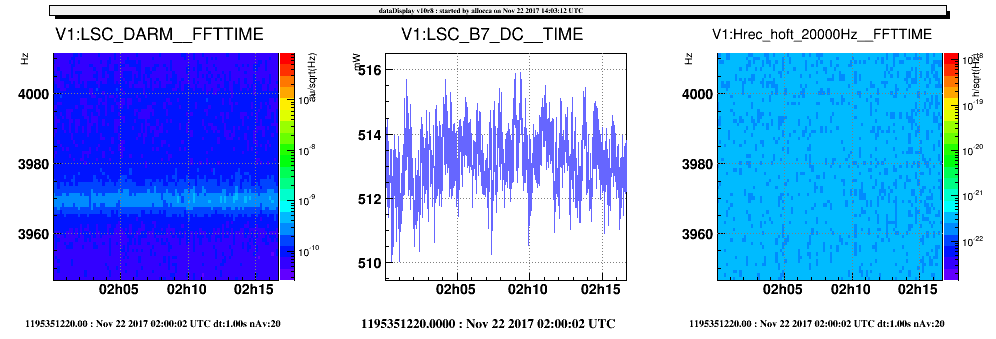
Moreover, after the input laser power increase of these last days, the frequency of this line went slightly down, as shown in the sequence of figures 2 (input = 16.8W), 3 (input = 20W), 4 (input = 26.7W + DAS on CPs). Notice that the frequency in this last configuration stays the same also when the DAS is off.
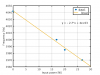
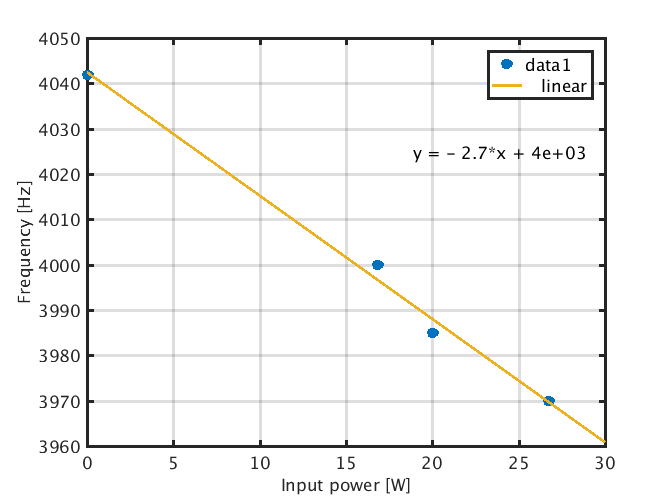
The trend of the frequency as a function of the input laser power is reported in figure 5. Notice that the first point has been estimated from the highest frequency at the beginning of the DF lock (the top value of the exponential trend shown in figure 1).
What is remarkable is that this line does not appear in hrec, which probably means that it is subtracted. Maybe identifying the origin of this line could help in understanding the nature of the power decay fenomenon seen on all the PDs at the beginning of each dark fringe transition.
Finally, notice that this line was also visible during the highest sensitivity periods (figure 6).