Reports 1-1 of 1 Clear search Modify search
AdV-COM (AdV commissioning (1st part) )
ruggi, tacca, schaaf, bersanetti - 15:54 Friday 08 September 2017 (39416) Print this report
alignment set point investigation

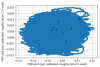
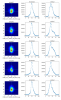
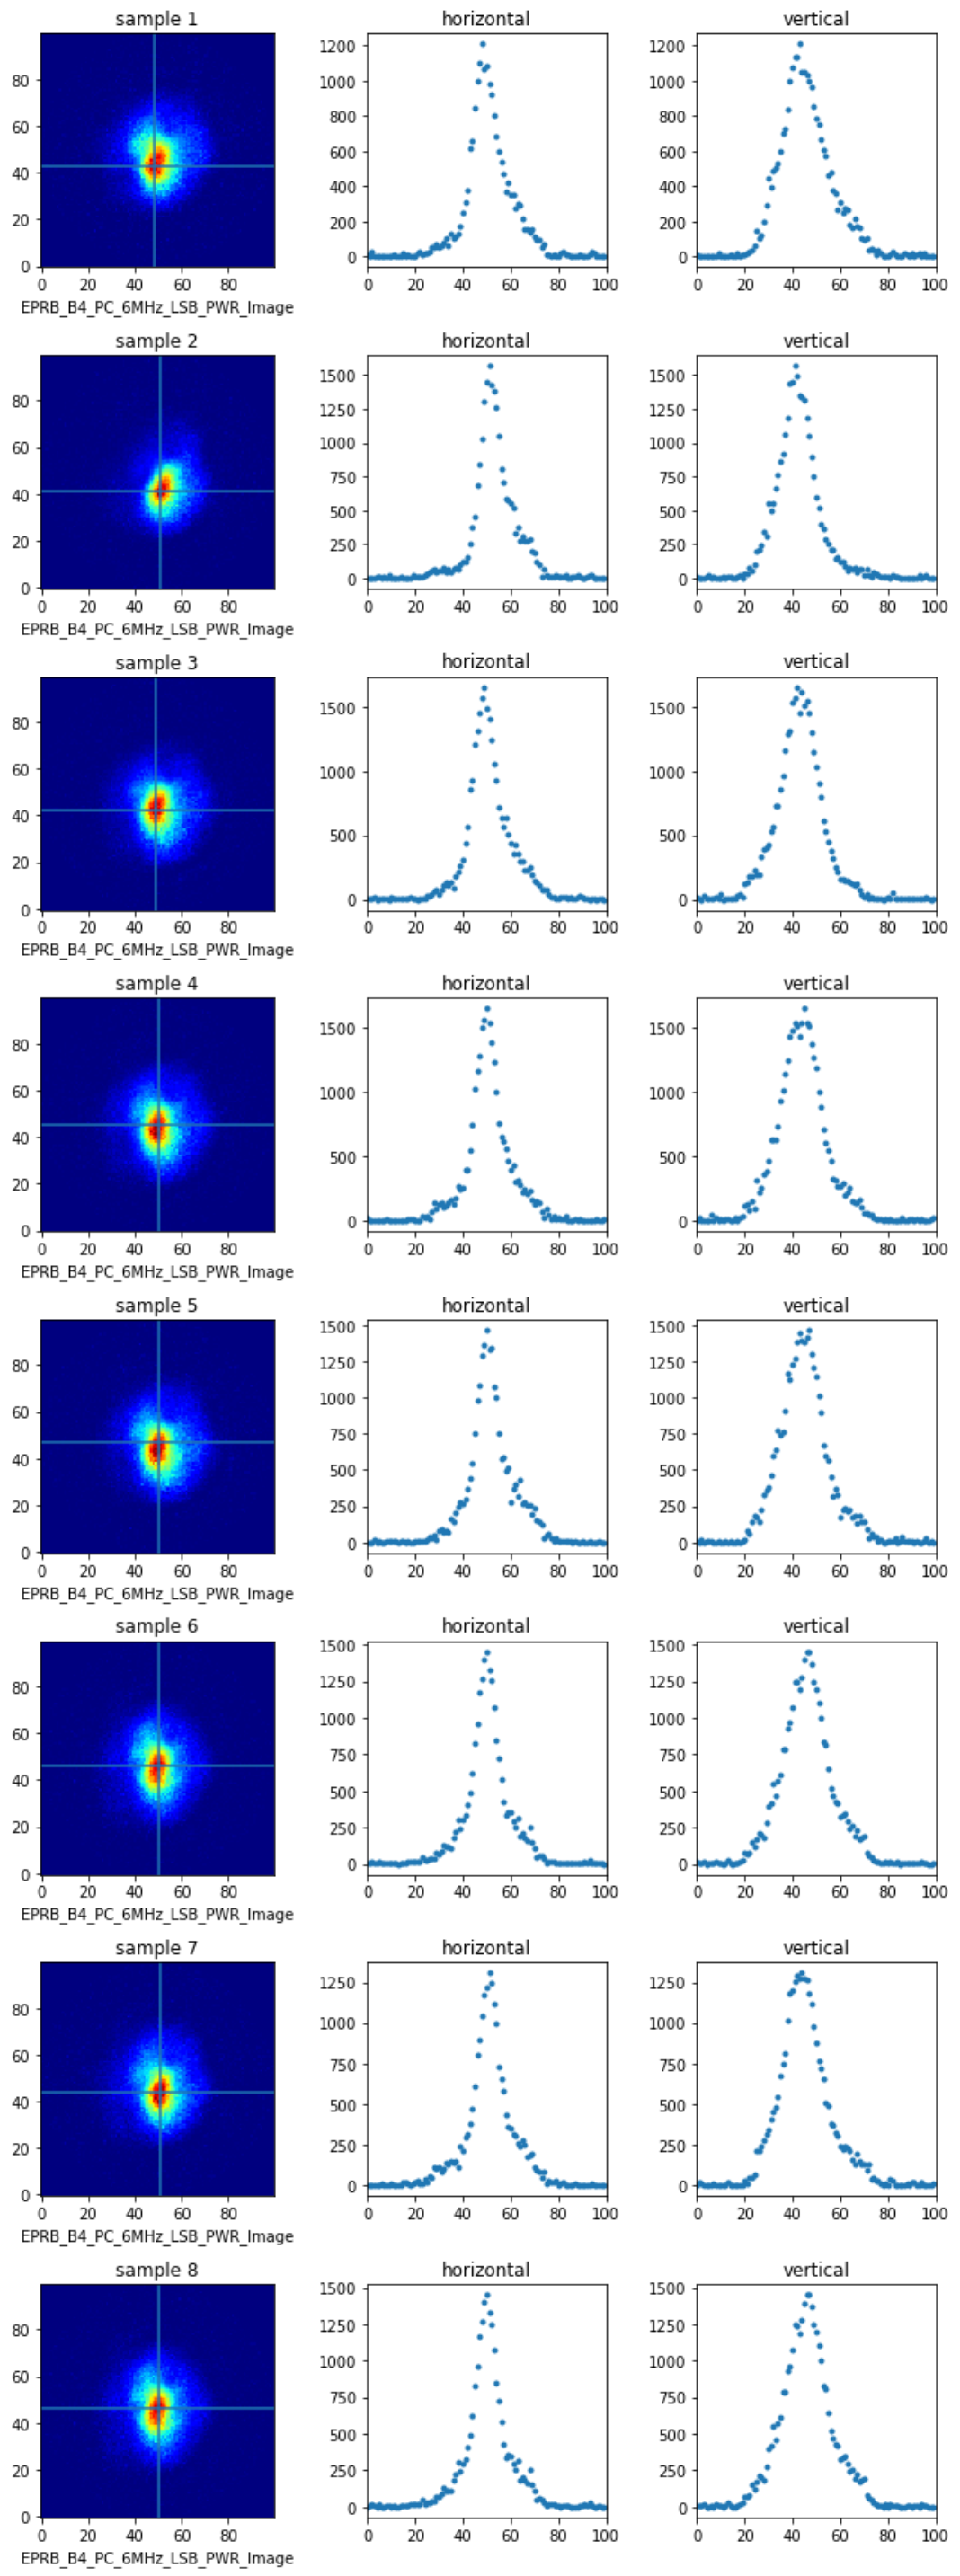
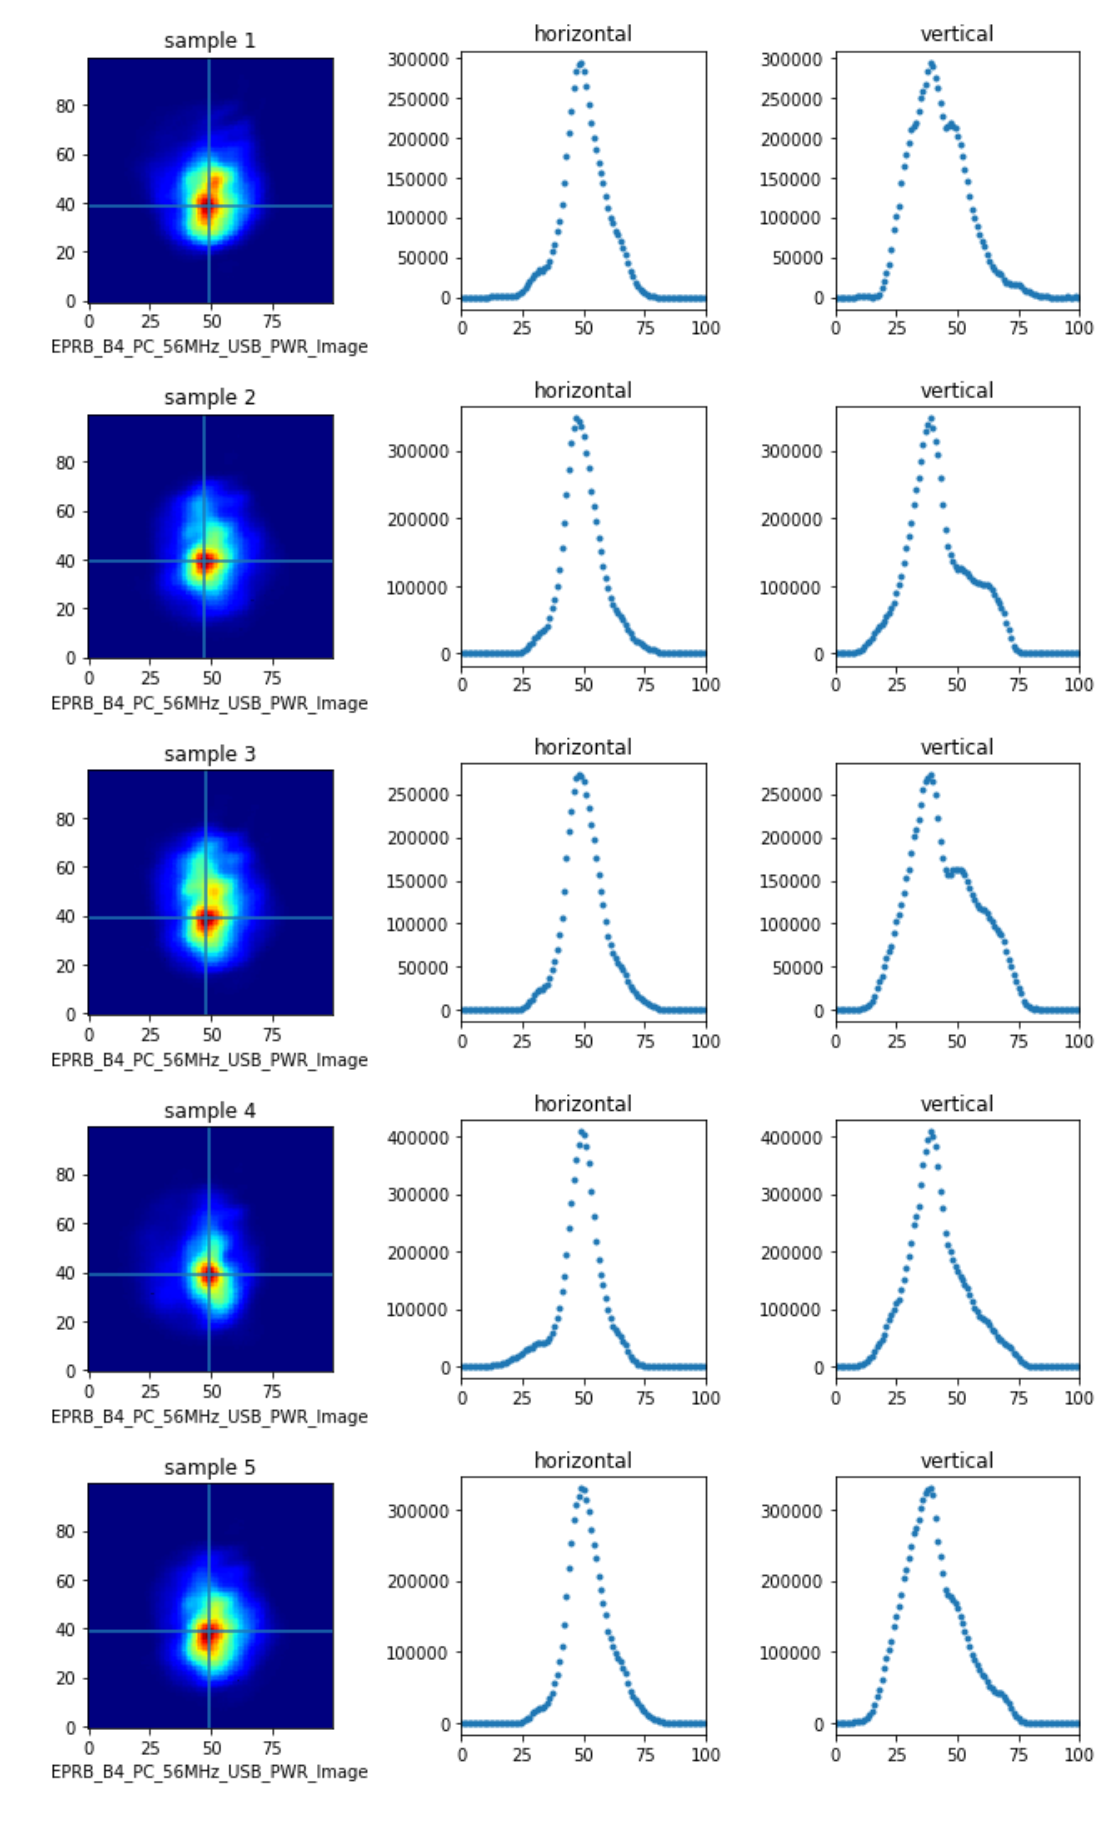
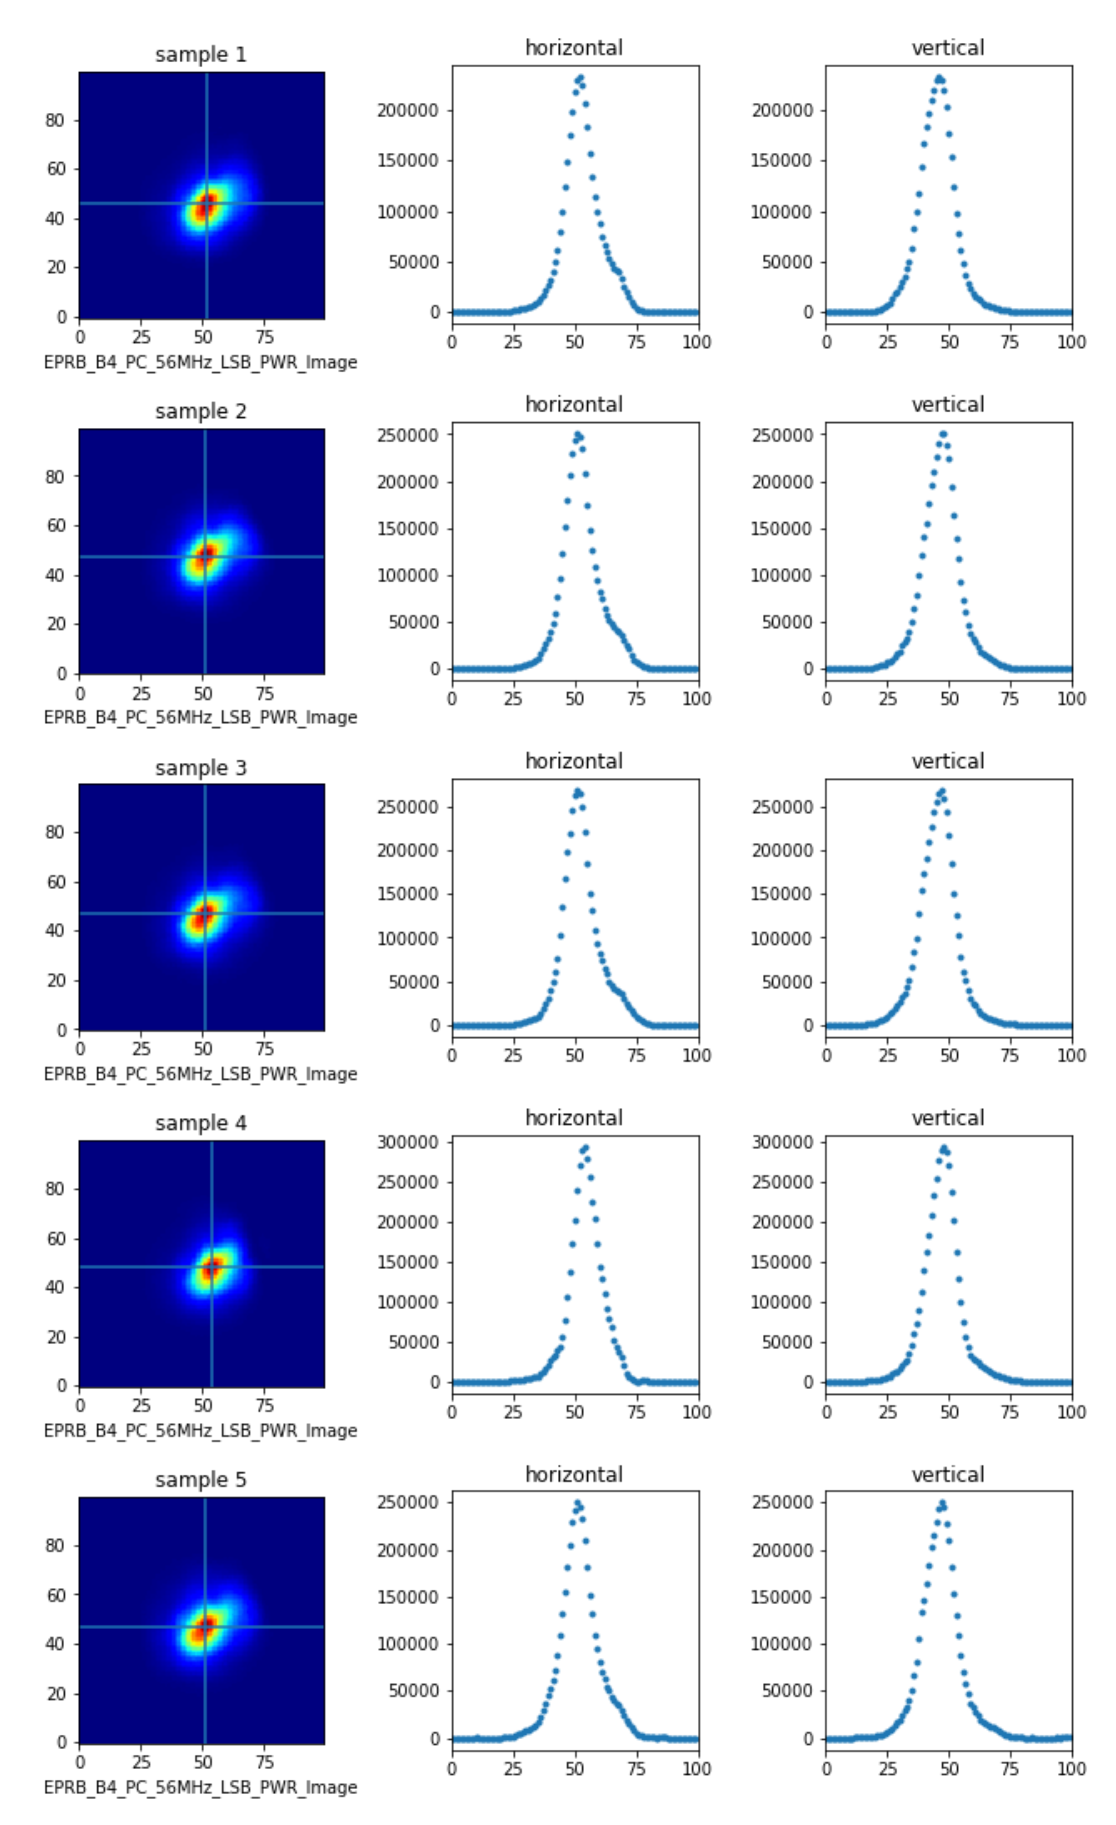
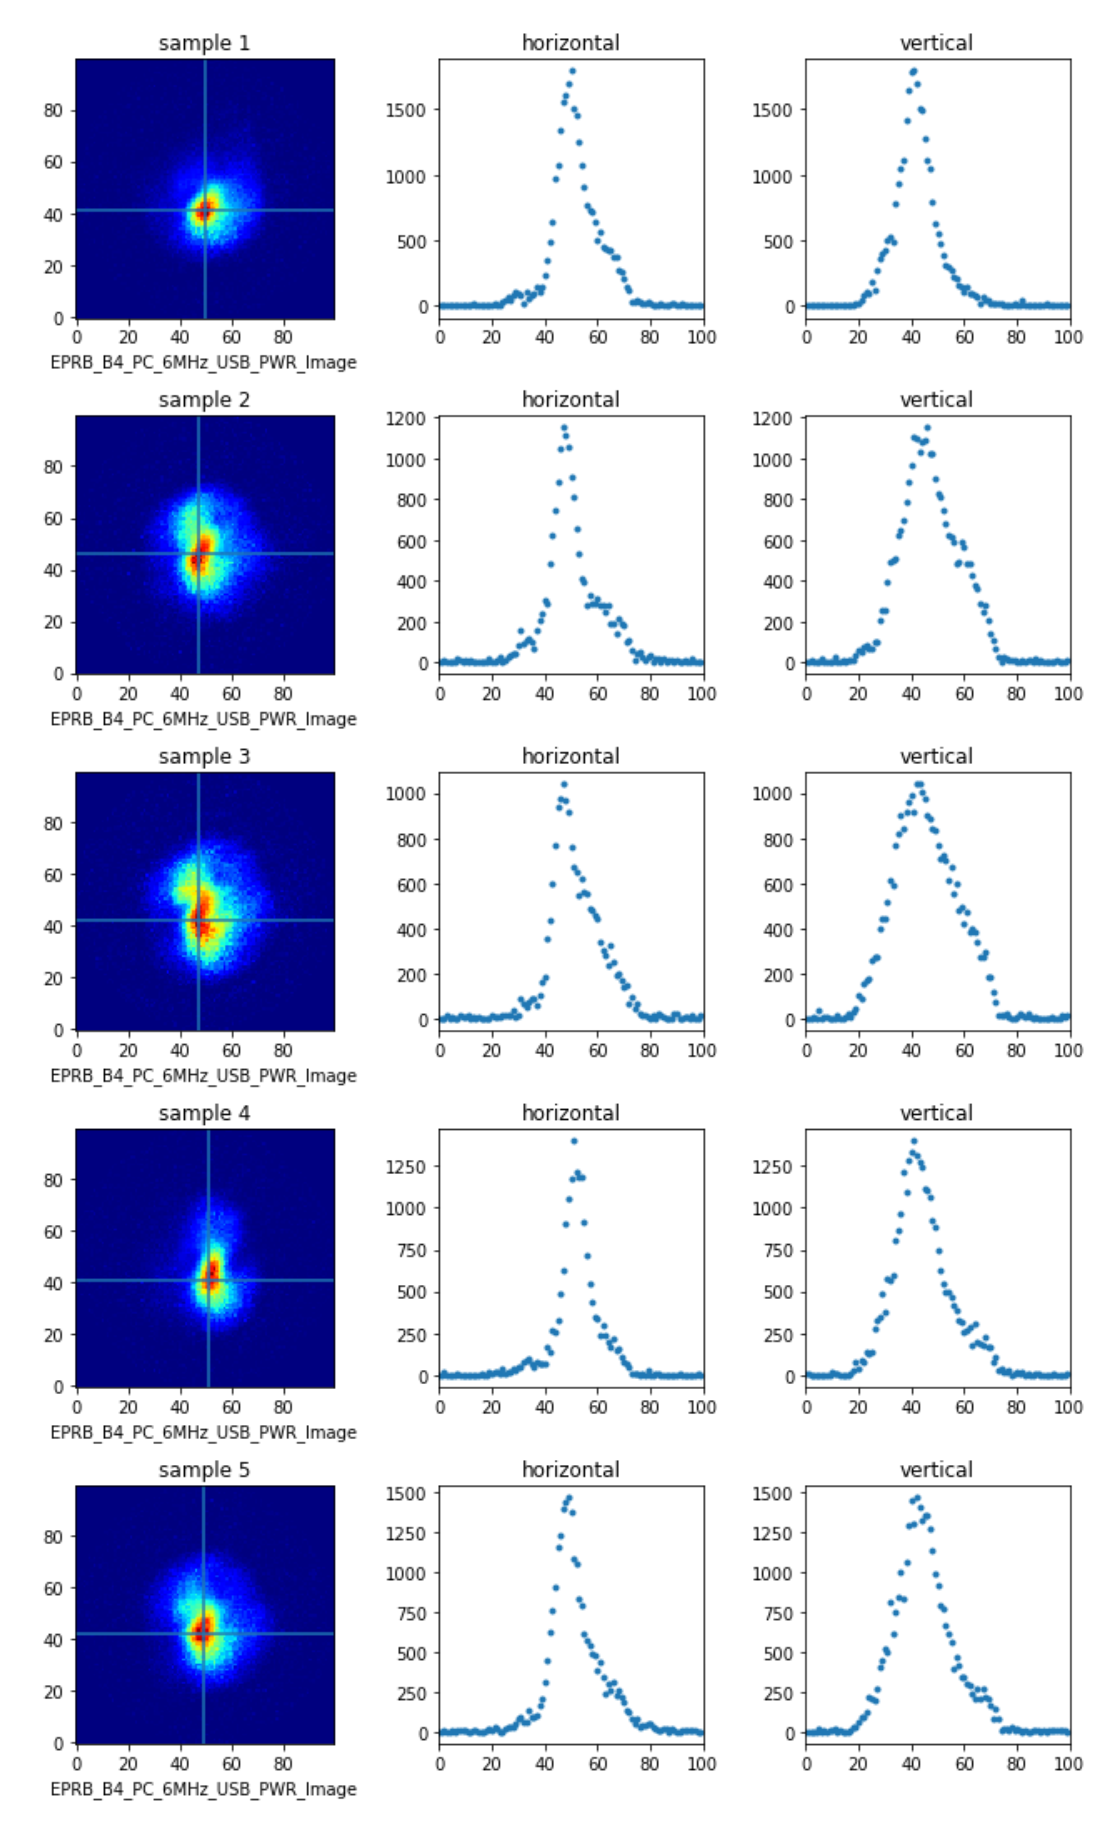
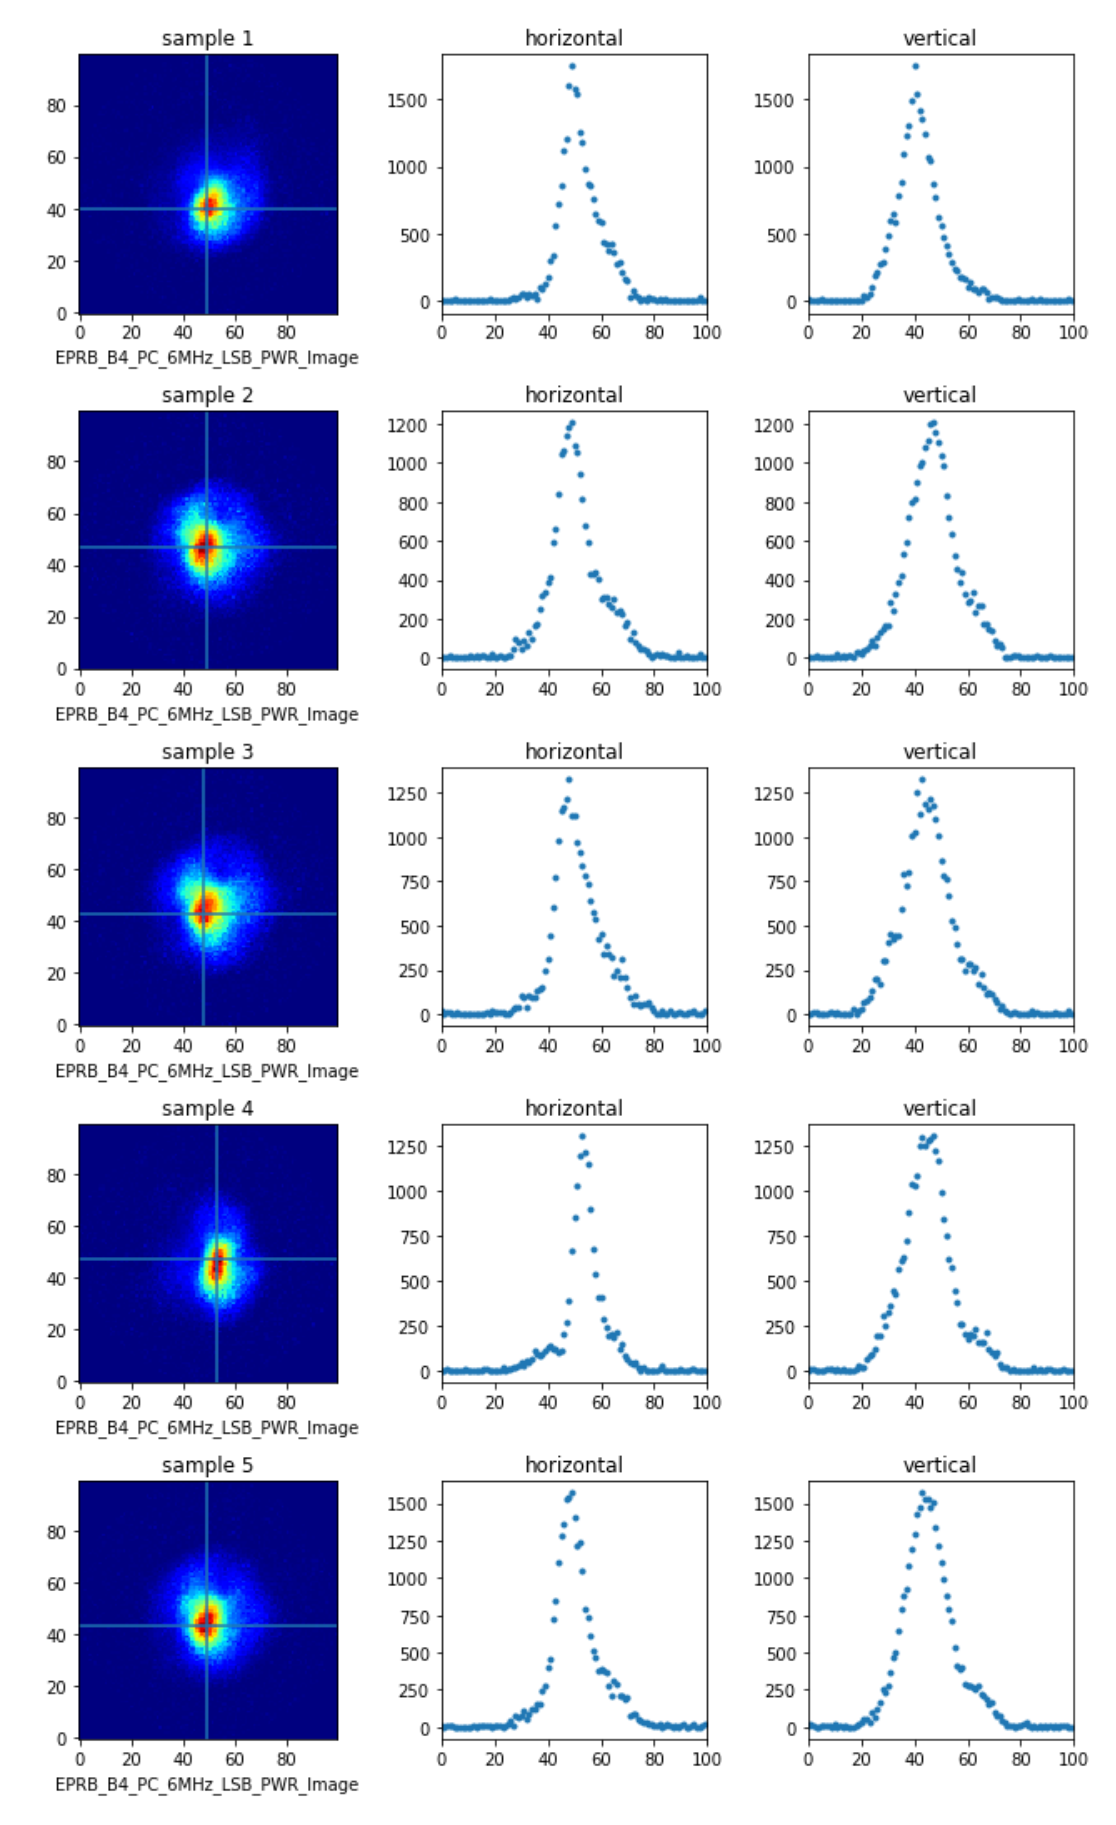
Yesterday, at the beginning of the afternoon activity, there was some difficulty to acquire the lock because B4 beam was not centered anymore on the photodiode. The centering was recovered tilting in TY the POP (PR_F7_TY) and putting B4 power in the middle of the plateau. Then the lock was acquired, but the sensitivity was bad. We found that the position of B4 on the camera was not yet the standard one; doing the final adjustment of the POP the sensitivity improved a bit (Fig. 1).

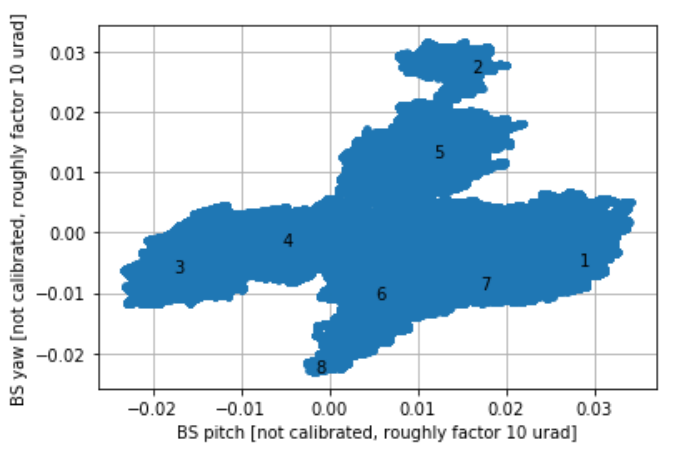
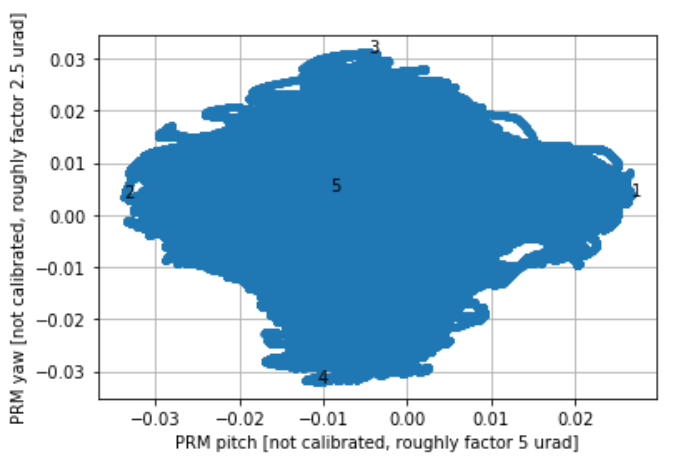
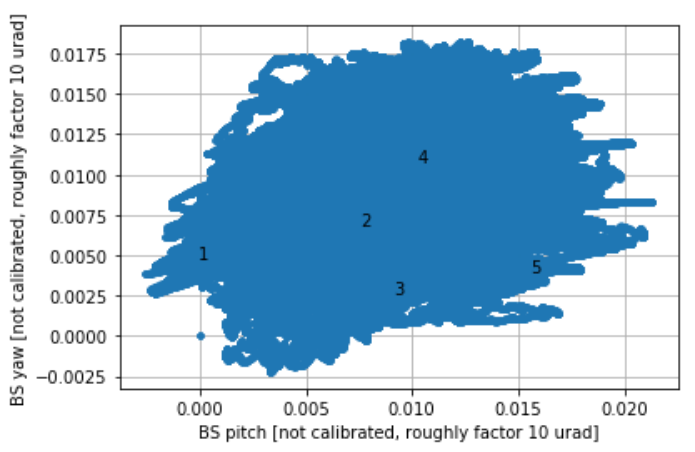
Later in the afternoon we explored some different working point for recycling cavity alignment. We found soon that a small adjustment of BS set point had a visible effect on the noise, namely the structures associated to SDB1. We found also that the idea of driving PR cavity towards a higher sideband power cannot be used to optimise BS alignment, because both for TX and TY the noise increases soon moving in that direction. Finally we found a new set point for TY which seemed to improve a bit the range (Fig. 1), but this has to be confirmed, and a good procedure to define the optimal BS aligment has still to be found. The last point to be underlined is that after a change of BS alignment the DIFFp set poit has to be adjusted: probably we are using a signal not really diagonal with respect to diff arm alignment.

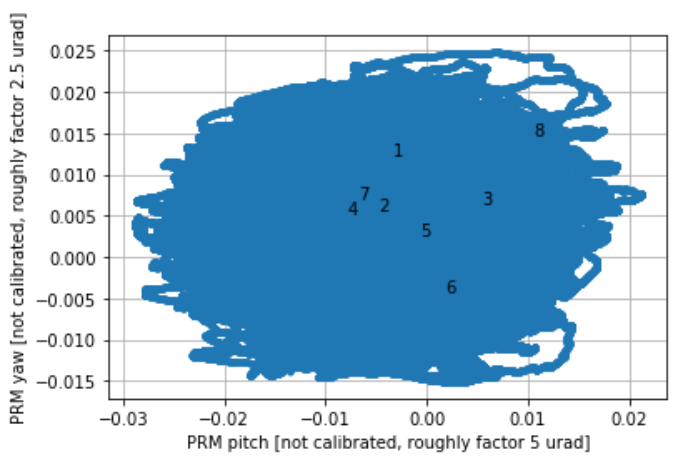
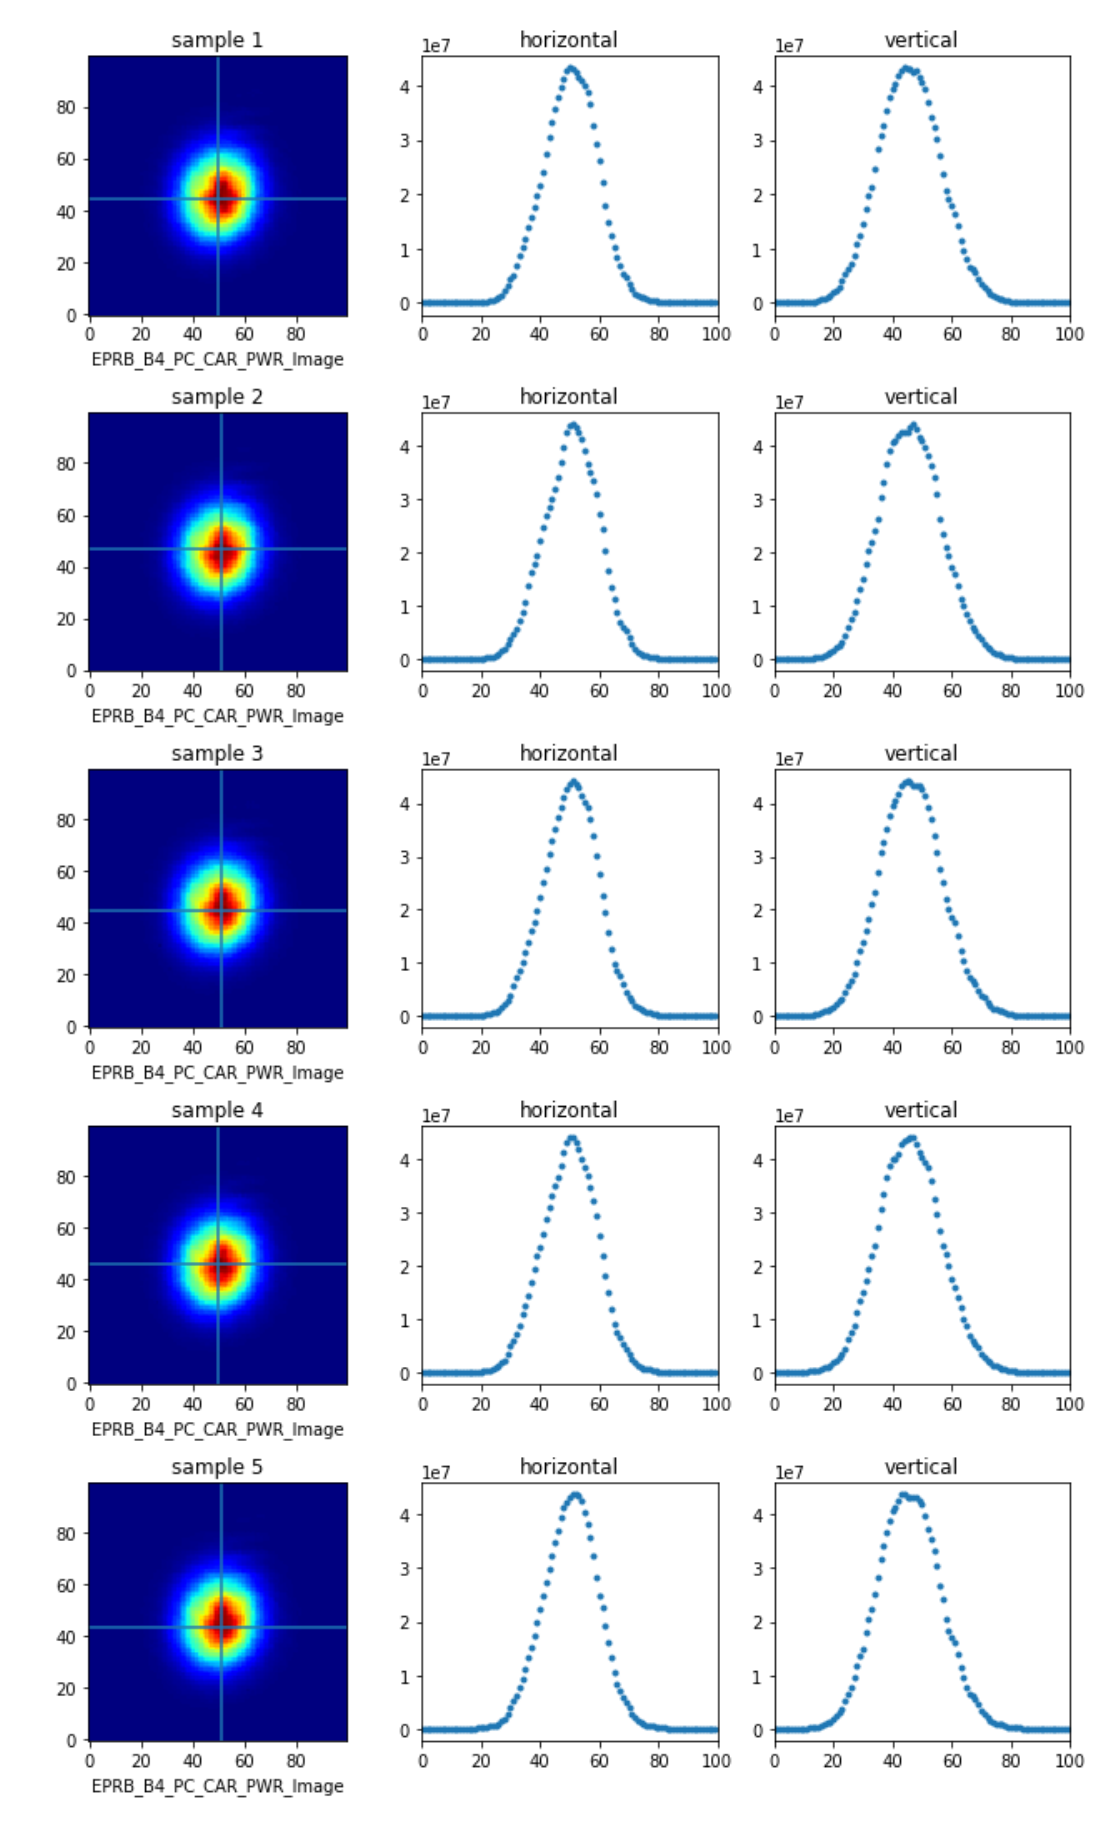
We checked also PR set point. For that, it seems that the good alignment can be defined as usual, i.e. the one which miximise the sideband power and minimise its sensitivity to PR angular fluctuations.

The exploration confirms that in general we cannot relay on the zero of the AC signals obtained from the quadrant, in order to define a good working point for the most critical angular d.o.f.. The way to found the correct offsets to add is not yet well defined, even if there is a kind of euristic procedure which can be applied from time to time.

Images attached to this report
Comments to this report:
schaaf, tacca, ruggi - 14:56 Wednesday 13 September 2017 (39452) Print this report
The misalignment of BS respectively PRM alters the intensity images of the 56 MHz USB on the B4 phase camera. There might be something in the 6 MHz USB but as the 6 MHz is less stable we need to dig deeper before drawing conclusions. In the lower sidebands and the carrier no clear effects are noted in this first fast analysis. Attached are the following images:

FOR MISALIGNING THE BS

Figure 1 shows pitch and yaw of the BS. This is the signals that were altered on purpose. There are labels in the plot, numbered from 1 to 8. For these 8 samples the intensity images of carrier and sidebands including cross-sections are plotted in the following images. The amount of tilt is only known very roughly.

Figure 2 shows the corresponding values for the PRM (not moved on purpose), again there are the 8 numbers for the same gpstimes as for the earlier plot. The amount of tilt is only known very roughly.

Figure 3 shows the intensity image taken with the phase camera on B4 for the 8 time samples (see label upper right corner for each row) including a horizontal and a vertical cross section through the pixel with maximum intensity.

Similarly for the sidebands:

Figure 4 is the 56 MHz USB, figure 5 is the 56 MHz LSB, figure 6 is the 6 MHz USB and figure 7 is the 6 MHz LSB.

FOR MISALIGNING THE PRM

Figure 8 shows pitch and yaw of the PRM. This is the signals that were altered on purpose. There are labels in the plot, numbered from 1 to 5. For these 5 samples the intensity images of carrier and sidebands including cross-sections are plotted in the following images. The amount of tilt is only known very roughly.

Figure 9 shows the corresponding values for the BS (not moved on purpose), again there are the 5 numbers for the same gpstimes as for the earlier plot. The amount of tilt is only known very roughly.

Figure 10 shows the intensity image taken with the phase camera on B4 for the 5 time samples (see label upper right corner for each row) including a horizontal and a vertical cross section through the pixel with maximum intensity.

Similarly for the sidebands:

Figure 11 is the 56 MHz USB, figure 12 is the 56 MHz LSB, figure 13 is the 6 MHz USB and figure 14 is the 6 MHz LSB.
Images attached to this comment
Search Help
×

Warning

×