Draft report
Upon arrival I found ITF in Science Mode (LN3_SQZ)...
ISC
The DMS reports a mistuning of B4_56MHz (LSC_SSFS_Err_DPHI) since few days. To be check. Plot attached
Upon arrival I found ITF in Science Mode (LN3_SQZ)...
ISC
The DMS reports a mistuning of B4_56MHz (LSC_SSFS_Err_DPHI) since few days. To be check. Plot attached
ITF found in Science mode.
Sstarting from 22:40 UTC a series of local earthquakes unlocked many times the ITF:
The ITF was back in Science mode at 1:42 UTC, still in Science at the end of the shift.
Guard tours (time in UTC)
from 21:50 to 22:20; from0:00 to 0:30; from 2:00 to 2:30; from 4:00 to 4:30
In this afternoon shift science mode stopped from 16:00UTC to 19:02UTC for daily calibration and commissioning (PRCL offset scan and ISC noise injections) and for troubleshooting from 14:45UTC to 14:48UTC to solve the problem with Hrec; the ITF unlocked during the commissioning and it relocked at the first attempt.
- guard tours(UTC):
17:40 --> 18:10
19:40 --> 20:10
ISC
- 18:24UTC: LSC injections (inject_lsc.py);
- 18:40UTC: ASC injections (inject_asc_test.py);
because of a lack of time injections on SSFS and PSTAB not done, it will be run tomorrow afternoon;
Other
from 14:07UTC to 14:45UTC we had a strange behavior of Hrec with the range going up and down randomly and the sensitivity too, it was because of a test done by Alain on a test version of Hrec that by mistake was writing in a wrong shared memory.
Offline Hrec test setup
While installing an offline Hrec test setup in the CascinaTest Cm domain, this afternoon I duplicated the Hrec configuration, updating the FD_IN parameters but forgotten to update the FDOUT ones .As consequence, when I started this offline server on the same host where the online Hrec server is running (olserver52), there were some troubles with the Hrec online data .I didn’t realize it was creating problems as I was working with offline data and in the CascinaTest Cm domain. When I realized this , I contacted the Control room and I fxed the issue .
This issue started at 2024-04-26-14h08m02-UTC and was fixed at 2024-04-26-14h40m34-UTC
Doing a PRCL offset scan to minimize the frequency to amplitude coupling at the input of the interferometer: https://git.ligo.org/virgo/commissioning/commissioning-tasks/-/issues/12
Starting after the calibration measurements between 16:00 and 16:15 UTC. The steps are done at a speed of ~1 unit of PRCL per 20 second.
16:22 UTC (5min) PRCL_SET = 1.0
16:28 UTC (5min) PRCL_SET = 2.0
16:35 UTC (5min) PRCL_SET = 4.0
16:42 UTC (5min) PRCL_SET = 6.0
16:51 UTC (5min) PRCL_SET = 0.0
17:00 UTC (5min) PRCL_SET = 6.5
17:07 UTC (5min) PRCL_SET = 6.2
17:16 UTC (5min) PRCL_SET = 12 - interupted by unlock just after 17:18:40 UTC
just after reaching LN3
18:10 UTC (5min) PRCL_SET = -6.0
18:17 UTC (5min) PRCL_SET = 0.0
Figure 1 summarizes the scan done up to the unlock, PRCL_SET ~ 6 correspond to zeroing the frequency to amplitude conversion by the interferometer as seen on B2. It also shows that adding the offset in PRCL reduces the 6MHz gain as seen on B4 12MHz by 2%.
Figure 2 compares the time with the frequency noise coupling to minimized (blue) to the normal situation (purple). The B2 noise is 10 times lower between 1Hz and 3Hz, and it is also lower above 1kHz where the frequency noise is dominant. In between B2 is dominated by the pole at ~500Hz noise, subtracting it using B5 or B4 could reveal more clearly the improvement in coupling of frequency noise to B2 at other frequencies. There is no wideband impact on the h(t) noise.
Figure 3, 4, 5 show that the frequency noise lines (227Hz, 1111Hz and 3345Hz) are a factor ~30 lower on B2, and about a factor 2 lower in h(t).
Figure 6 my impression is that the coupling of frequency noise to h(t) becomes lower because for SSFS_LF the I and Q quadratures become more overlapped, so the BS TY minimizes both at the same time, and for SSFS_LINE the I and Q quadratures (that are very correlated), become of equal magnitude but opposite sign.
I wonder what it means that the frequency to amplitude noise coupling is zeroed, while the sideband gain decreases. Does it mean that the sidebands are not well tuned to the length of PRCL, and we need to choose to have carrier well resonant or sidebands well resonant?
Figure 7 the coupling of frequency noise to B2 has been quite stable since the beginning of the run
Figure 8 shows the PRCL offset scan done just after the unlock. This scan went with the same magnitude but in the wrong direction for the frequency to B2 noise coupling, and this time it increased the B4 12MHz mag signal by ~1.3%. So it points towards the current working point being in between being good for sideband gain and being good for the frequency to amplitude coupling at the interferometer input. That would intuitively make sense if the sideband frequency doesn't match the PRCL length, and the RF error signal that is the between sideband and carrier finds a working point in between being good for the carrier and for the sideband.
Last Tuesday the balancing of BS MAR Z actuation has been corrected in order to remove a small residual coupling vs TY, observed in windy condition. New data with some wind has been acquired and compared to older data with the same wind (fig 1). The effect is visible in fig 2: a very similar Z correction produced a much smaller BS TY fluctuation. A benefit in terms of CMRF fluctuation is also visible (fig 2). After the adjustment of the balancing, no coherent coupling from Z CORR to TY CORR is measurable anymore (fig 3).
Offline Hrec test setup
While installing an offline Hrec test setup in the CascinaTest Cm domain, this afternoon I duplicated the Hrec configuration, updating the FD_IN parameters but forgotten to update the FDOUT ones .As consequence, when I started this offline server on the same host where the online Hrec server is running (olserver52), there were some troubles with the Hrec online data .I didn’t realize it was creating problems as I was working with offline data and in the CascinaTest Cm domain. When I realized this , I contacted the Control room and I fxed the issue .
This issue started at 2024-04-26-14h08m02-UTC and was fixed at 2024-04-26-14h40m34-UTC
ITF found in LOW_NOISE_3_SQZ and in Science Mode, it kept the lock for the whole shift.
given that the past injections performed on CARM SLOW loop through the automatic script in /virgoDev/Automation/scripts/LSC/inject_lsc.py were not sufficiently accurate (fig.1), today we increased of a factor 5 the noise amplitude. If this noise amplitude is not enough, we could increase it even further, there should be margin, see fig.2 and 3.
Looking at the ISC_Fb logfile, one can find these 2 messages:
According to these 2 messages, as the frame building is done at 5Hz, it seems that
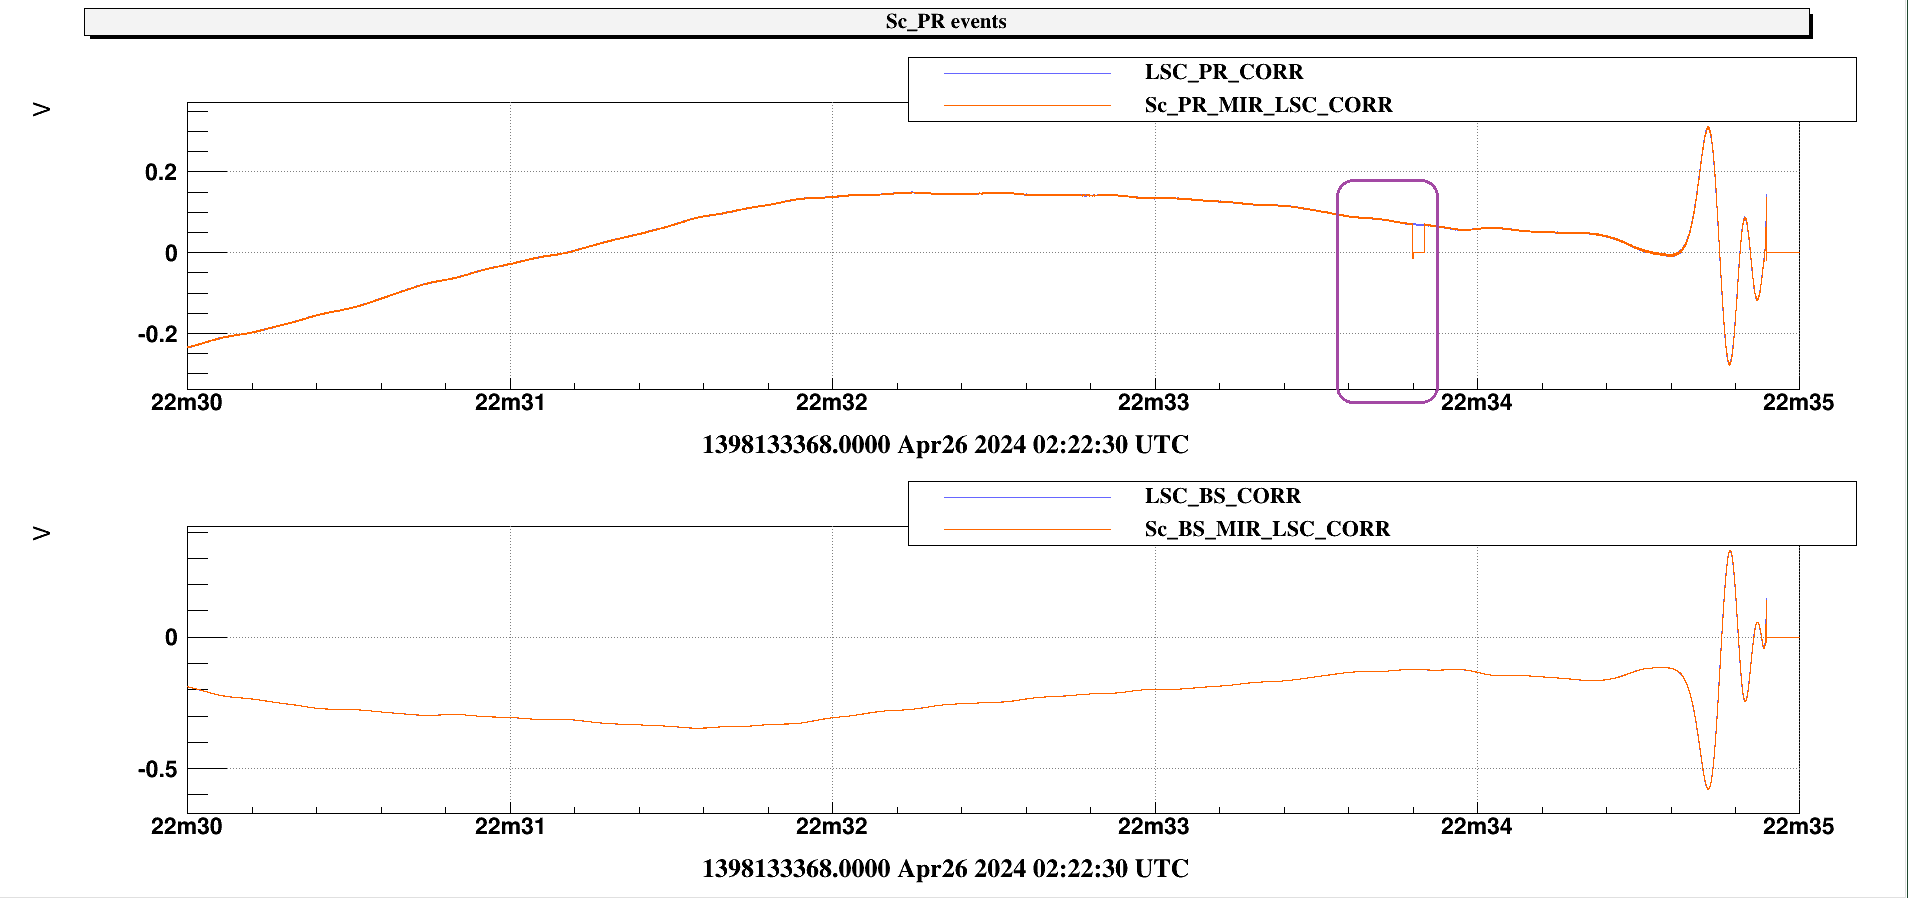
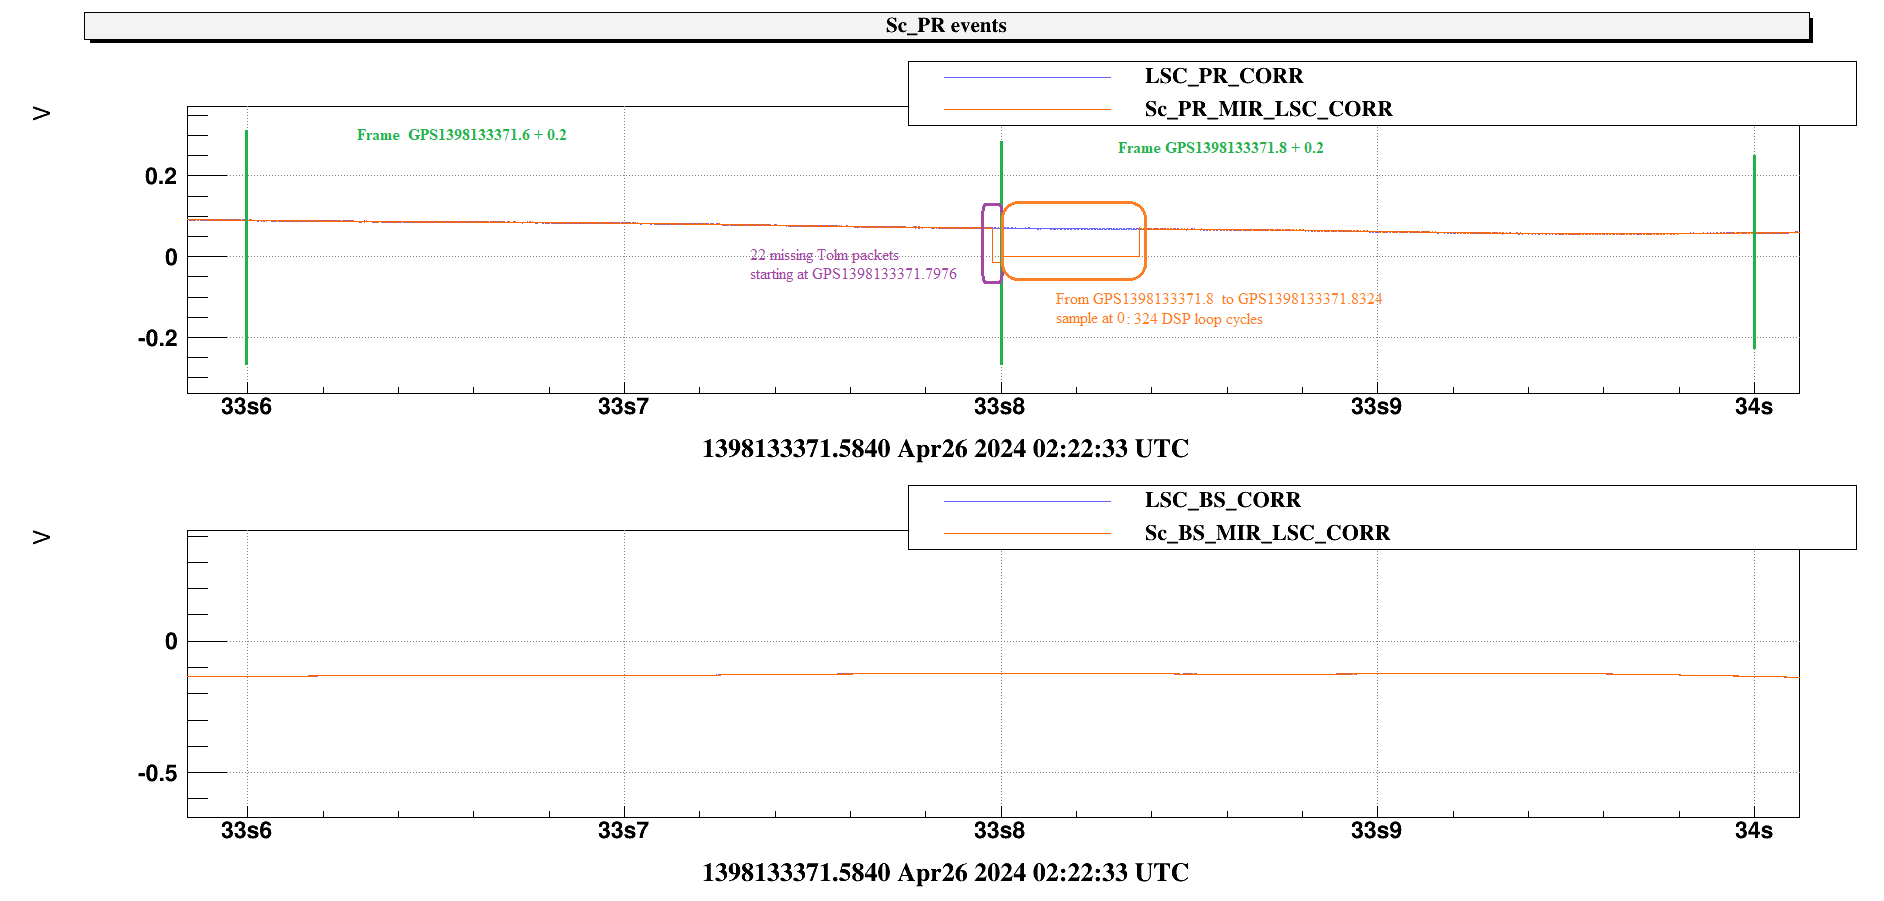
This plot at its zoom show the LSC_PR_Z_CORR and Sc_PR_MIZ_LSC_CORR for the 2024-04-26-02h22m33 event where
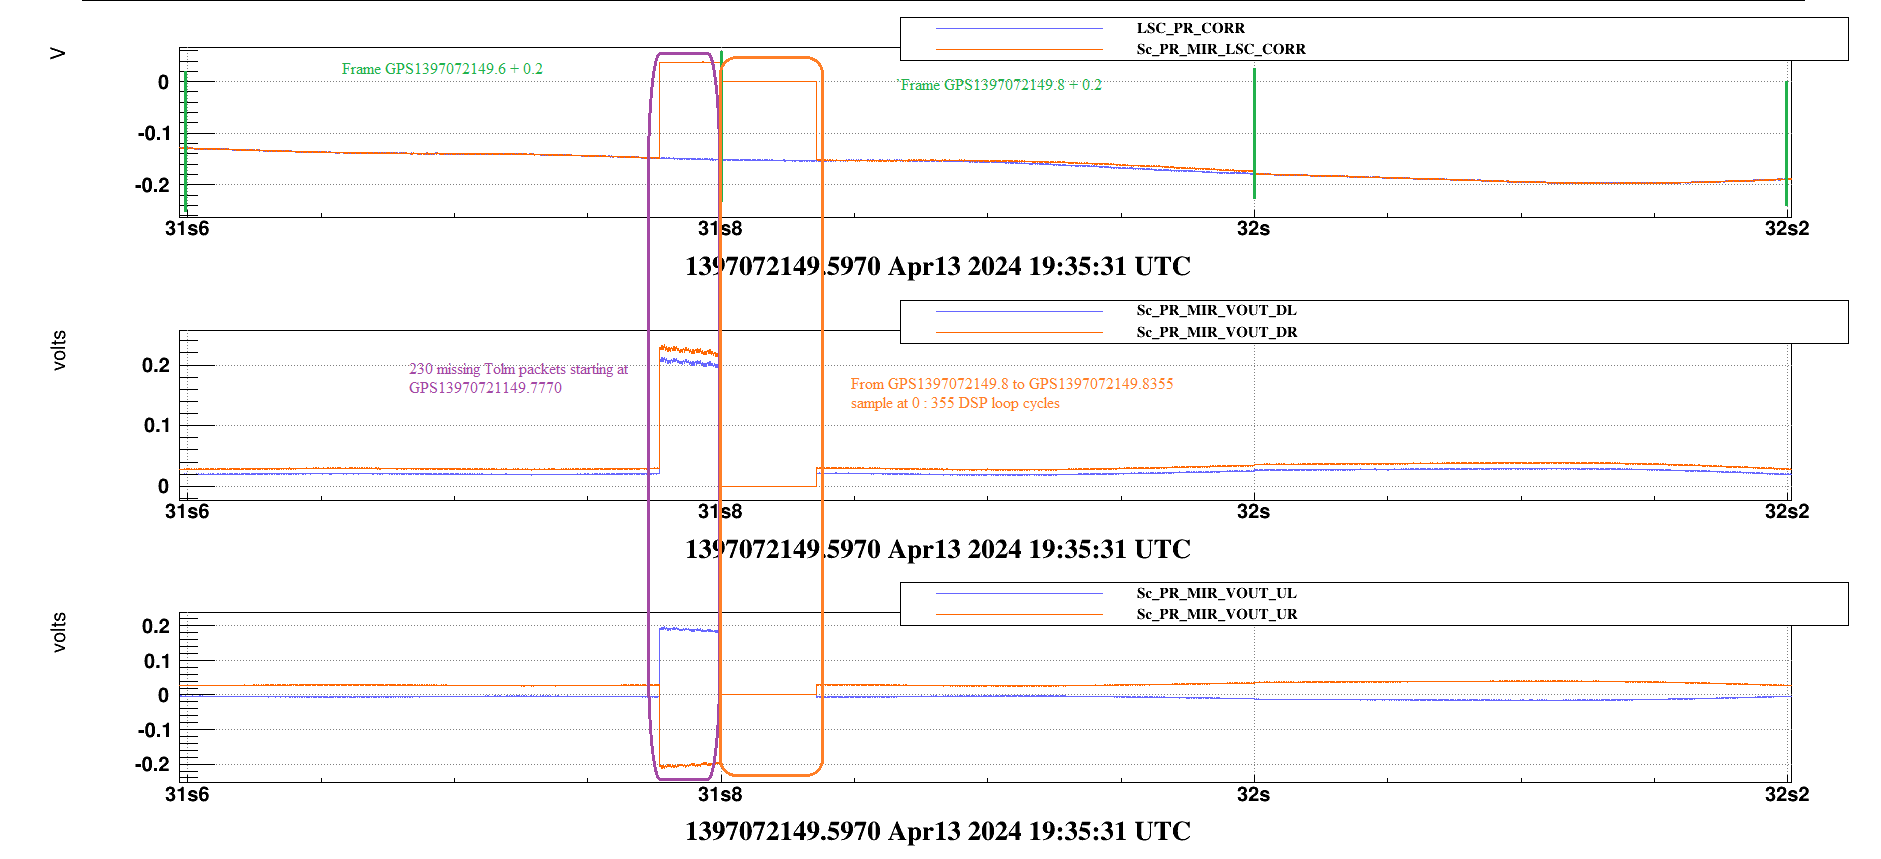
Related the 2024-04-13-19h35m32 Sc_PR event
ISC_Fb logfile report
This plot show the LSC_PR_Z_CORR, Sc_PR_MIZ_LSC_CORR and others Sc_PR channel for this event where
Errata corridge: the plot of the squeezing level and the BLRMS of the first CC scan (t_start = 16:52 UTC) was erroneously equal to the one of the second CC scan. I attach the correct plot.
ITF found in Science mode.
The ITF unlocked at 2:22 UTC and the unlock seems to be correlated to a problem of DAQ/PR; see attached plot and the log file of ISC_Fb:
2024-04-26-02h22m33-UTC>ERROR..-[TfbSource::StoreData] producer Sc_PR: overflow at GPS 1398133371.999912050 (received 2021 / expected 2000) (1323 times)
This kind of behaviour is something similar to what already reported in the entry: 63958.
At the next relock the lock of the CITF took more than 30 minutes (I also performed the manual prealignment twice); once the CITF was locked LN3_SQZ was achieved at the first attempt and Science mode was set 3:58 UTC.
Gurad tours (time in UTC)
From 21:30 to 22:00; from 23:30 to 0:00; from 1:30 to 2:00; from 3:15 to 3:34.
The ITF kept the lock all the shift, science mode stopped from 16:00UTC to 18:45UTC for calibration.
- guard tours(UTC):
13:01 --> 13:44
15:06 --> 15:34
17:50 --> 18:20
19:51 --> 10:22
Calibration
- 16:01UTC: Measurement of checkHrec, NE,WE,BS,PR,SR optical responses, and sensitivity (CALIBRATED_DF_SENSITIVITY);
- 17:48UTC: Measurement of actuators response for NE,WE actuators and NI,WI,BS marionettes (CALIBRATED_DF_PCAL);
DAQ
VPM stopped to work at 15:38UTC, process restarted.
A question is if the optical gain for differential signals created inside the CITF is different from the DARM optical gain as a function of SR alignment. The 56MHz optical gain which involves being recycled by SR is not affected by the SR misaligment, because the ~1.5urad SR misalignment is small compared to the ~12m length of the CITF, and the CITF is marginally stable. Is it the same for differential perturbations created by the BS?
Figure 1 shows a lock acqusition, with SR aligned at the beginning (pole at 400Hz) and then 10 minutes later misaligned (pole at 200Hz)
Figure 2 shows three times, 21:10 UTC with SR still aligned (purple), 21:20 UTC with SR misaligned (red), 21:30 UTC with SR aligned (blue)
Figure 3 zooms on the BS drum mode (1872Hz VIR-0476A-16 https://tds.virgo-gw.eu/?content=3&r=12696). It is decreasing over the 10 minutes of SR misalignment, but then in the following 10 minutes is decreases again by the same fraction in h(t). Hence this decrease is not a change in optical gain, but just the drum mode damping. Meanwhile on B1 the first step is clearly larger, as the optical gain at high frequency changes due to the SR misalignment. So it seems the optical gain evolves the same way as the DARM gain. And there is no strange effect that the SR recycling work differently for perturbations created in the CITF and perturbations created in the arms.
Shift in Progress
ITF found in LOW_NOISE_3_SQZ and in Science Mode, it kept the lock for the whole shift.
Guard tour (UTC):
7:02 - 7:29
9:01 - 9:27
11:01 - 11:28
DAQ
During the shift the VPM stopped working three times (9:19 UTC, 9:57 UTC, 10:52 UTC). In all cases, it was possible to restart the VPM following the procedure provided by Pacaud.
I attach the plots for the two CC phase scans performed during the shift of yesterday. I was not able to produce the BNS range plot for the second scan, which is anyway visible in Fig.4.
The second scan started at 18:11 UTC, with the same duration times of shot and CC scan as of the first one.
I found ITF in SCIENCE; It remained locked for the whole shift.
ITF found in Science mode, LN3.
At 15:30 UTC ITF in Calibration mode for the planned daily calibration.
At 15:43 UTC ITF in Commissioning for the SQZ_INJ vs CC phase scan activity; after this activity the ITF has been locked in LN3_SQZ.
At 19:23 UTC ITF in Science mode.
Software
FbmMainusers restared at 17:05 after a crash.
VirgoOnline vpm instance became unreachable at 14:52 UTC; restarted by Emmanuel.
HVAC
new transformer (220V-->24V DC) of the DET AHU installed today, see 64093
Guard tours (time in UTC)
from 17:50 to 18:20; from 20:20 to 20:50.
SHIFT GOAL:
The goal was to perform several CC scan at different SR angle. Nevertheless, due the not optimum condition of the MZ and OPA (waiting for the retuning) we decid to perform a couple of scan without changing the SR angle to check the SQZ alignment-
SHIFT activity:
We started at 16:00 UTC and to not interfere with the ITF and risk to unlock, we manually injected the SQZ.
System initial status: ITF LOW NOISE 3; SQZ_MAIN @SQZ_Locked_NO_FC
16:10:39 EQB1 fast shutter opened (process: SQZ_ctrl/shutter ‘open’)
After that the CC_loop was engaged and then the AA (process: SQZ_PLL_AA/ Matrix and Filter ‘AA dither enable’).
started a CC 4MHz phase scan @ 16:52.
time per point = 6 s
- initial phase = 20 degree
- final phase = 230 degree
- phase steps = 1 degree
- random phase = False
- Closed shutter sleep time = 120 s
- AA closed on dither = False
- cc loop gain = 75000.0
N.B: No glitch during the scan, it was just before and after (see plot)
In meantime Henning checked the MZ and changed lowered again the offset at 0.035 V due to the humidity misalignment that spoiled the contrast and induced the set point near the actuator saturation. After the Henning action we redid the scan.
We stopped at 19.25 after that some data have been collected at the CC phase value corresponding to the SQZ and ASQZ, or better to the minimum and maximum values in the BRMS range @210 MHz and in other ranges.
Further data and plot in the following comments.
I attach the plots for the two CC phase scans performed during the shift of yesterday. I was not able to produce the BNS range plot for the second scan, which is anyway visible in Fig.4.
The second scan started at 18:11 UTC, with the same duration times of shot and CC scan as of the first one.
Errata corridge: the plot of the squeezing level and the BLRMS of the first CC scan (t_start = 16:52 UTC) was erroneously equal to the one of the second CC scan. I attach the correct plot.
The ITF kept science mode all the shift.
Sub-system reportsDAQ
at around 8:33UTC the VPM stopped to work and became unreachable over the net, restarted thanks to Emmanuel (#64088).
it occured a second time . VPM server restared at 2024-04-24-10h25m59-UTC
This morning, the VirgoOnline vpm instance became unreachable. This is another occurence of a known issue: https://git.ligo.org/virgo/virgoapp/VirgoProcessMonitoring/-/issues/29 .
I have restarted the instance at 2024-04-24-08h54m25-UTC .
it occured a second time . VPM server restared at 2024-04-24-10h25m59-UTC
On the 17th of April at 18:40 UTF the phase of the new signal for the DIFFp tx/ty set point, which optimize the DARM response, has been tuned.
I've used all the LN3 data since that date to evaluate the effect of this out of loop signal vs the NI and WI temperature, to check if the optimal wp for etalon corresponds also to the optical wp in which the minimum of B1p DC corresponds to the best response of DARM (considering that the DIFFp wp is tuned to minimize B1p DC, servo on the set point). The largest correlation is for TX and NI.
in figures 1 and 2 it is visible the behavior of the out of loop signal wrt the NI and WI temperatures, and it is visible that the 0 value is more or less similar to the best working point for etalon (VIR-0359A-24).
Moreover figures 3 and 4 show the behavior of BNS range and OG wrt these signal and a small offset is present (i.e. the maximum does not correspond to the 0 value, to be understood).


