Reports 1-1 of 1 Clear search Modify search
AdV-COM (AdV commissioning (1st part) )
bersanetti, chiummo, trozzo, rocchi - 20:18 Thursday 19 April 2018 (41155) Print this report
ITF Recovery

Summary of the morning shift:

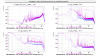
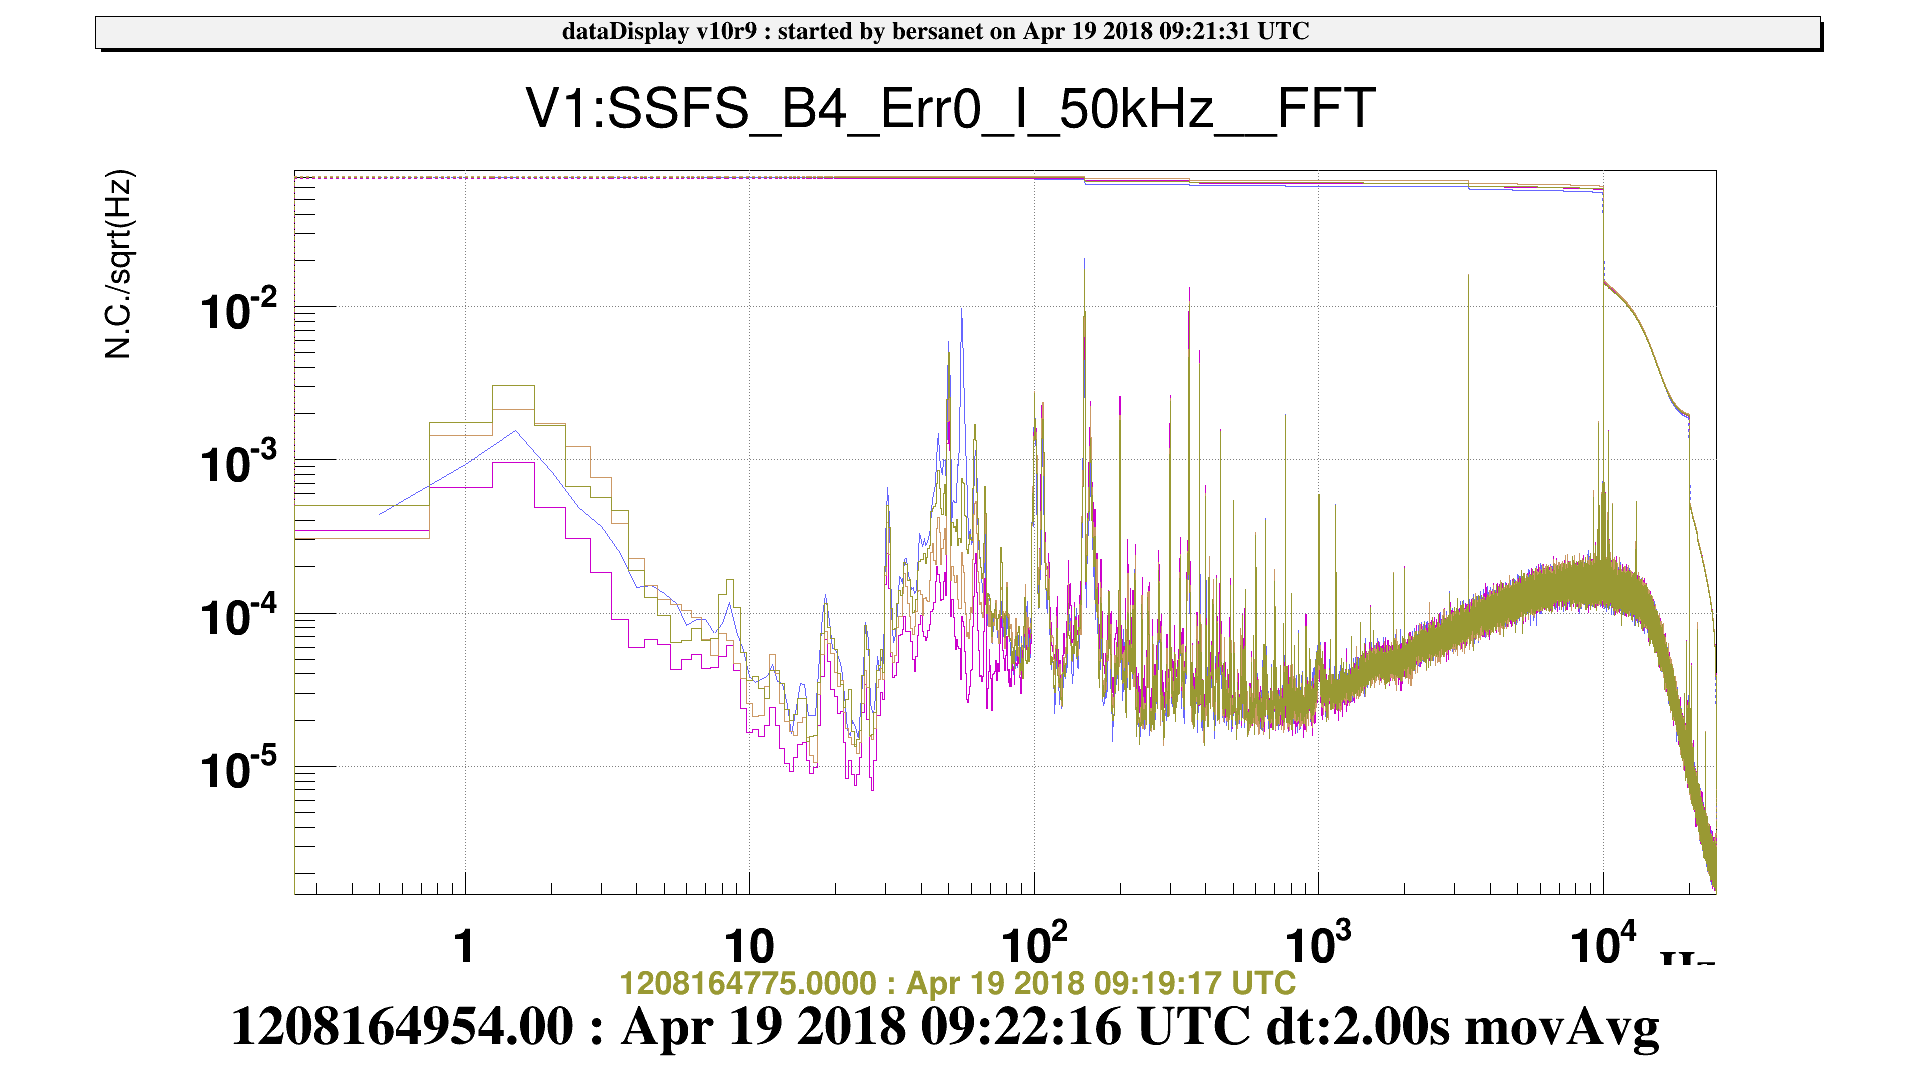
  • for the first half of the shift, we saw increased frequency noise as in the past days, so we had to try and overcome it by changing the SSFS crossing frequency and the SSFS gain during lock acquisition; when we managed to get to LOW_NOISE_1, things got better thanks to the SSFS, but the noise is still there; the shape of the loops did not change changing the crossing frequency, as opposed to the previous trials (Fig. 1, PRITF @ 0.7 Fringe);
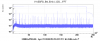
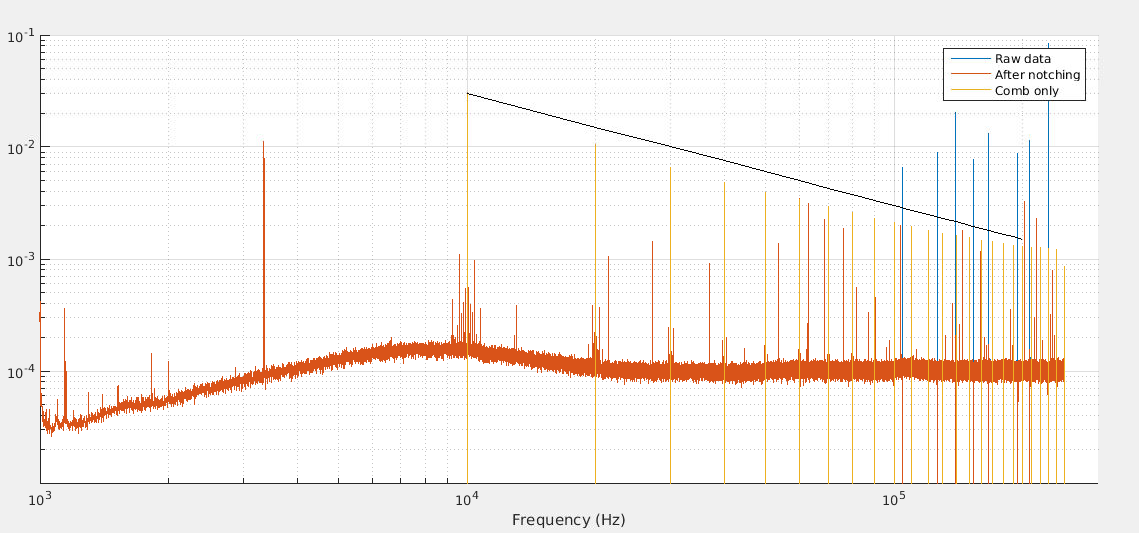
  • when using the base filter for SSFS a huge line, with structures and bump around it, shows up at 10 kHz; it immediately disappears once we switch to the boost filter; the issue was already there a few days ago;
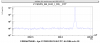
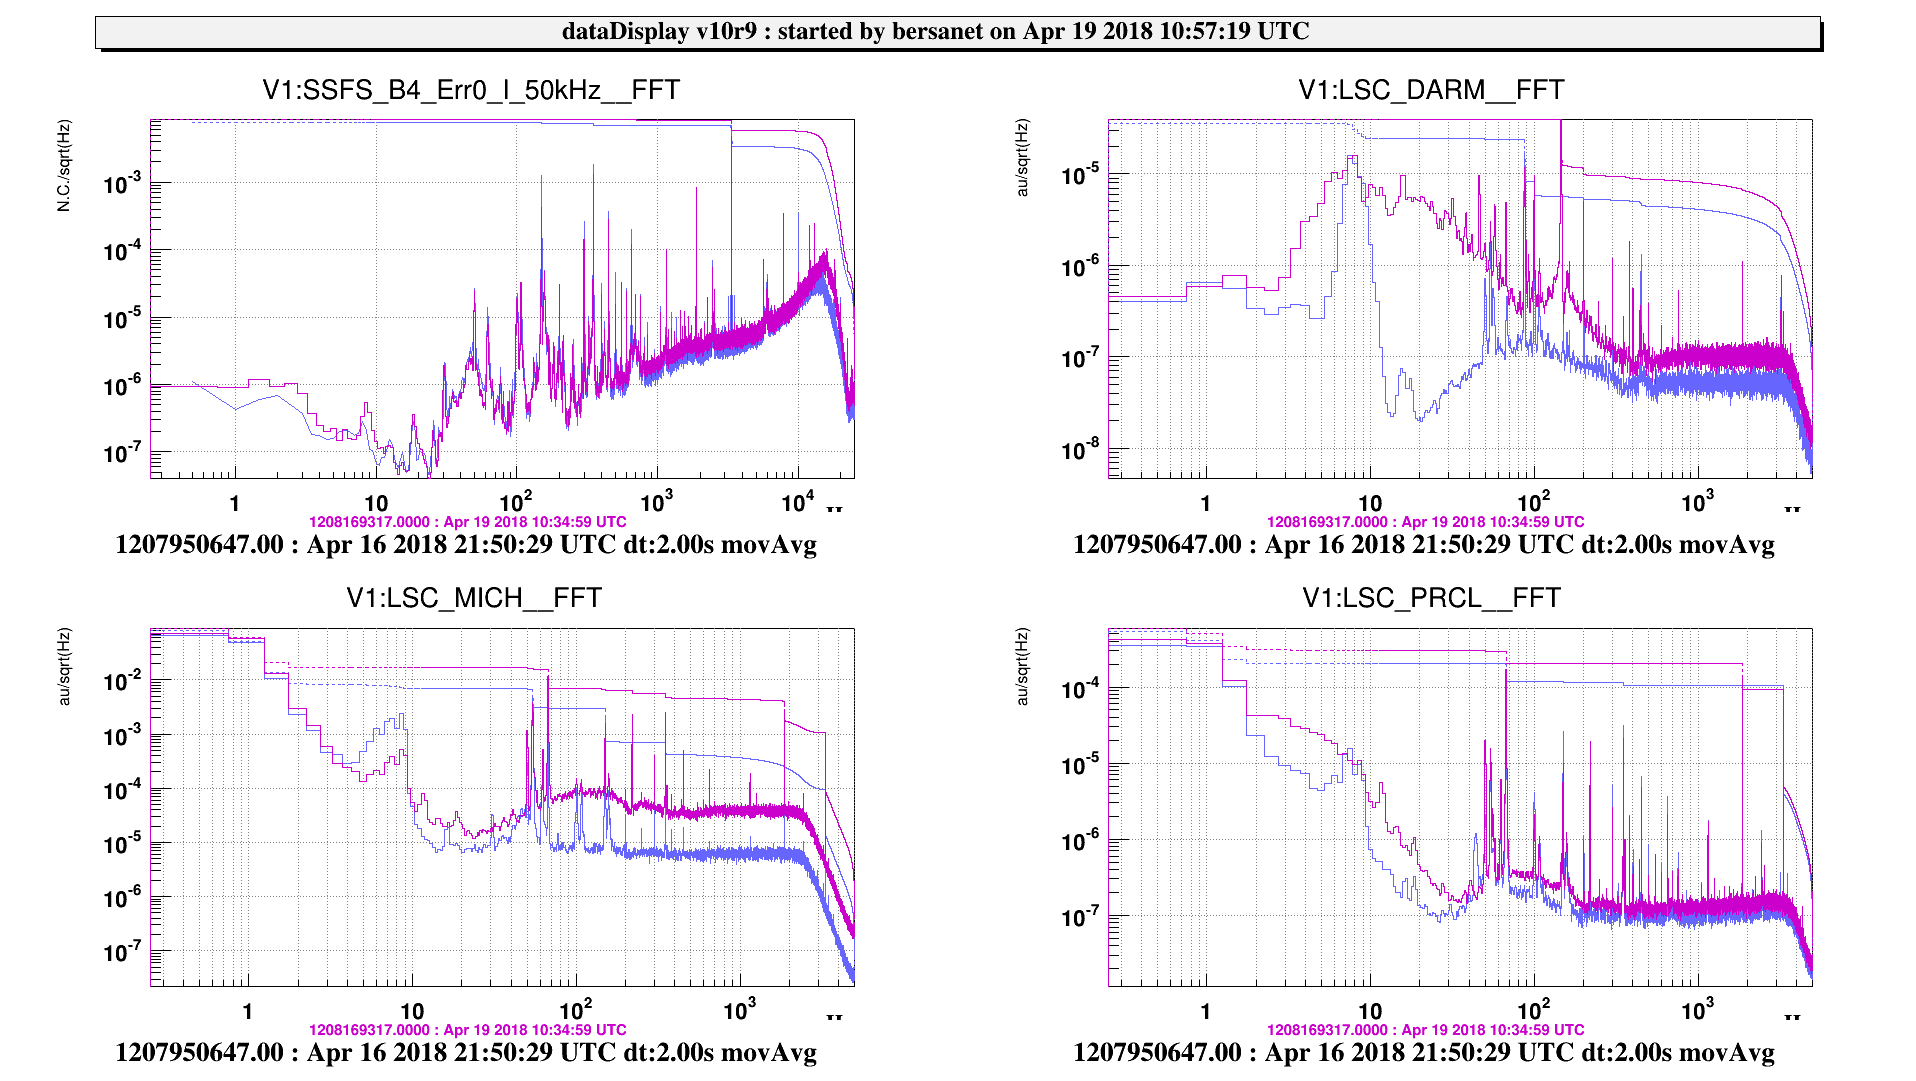
  • what is strange is the overall noise level increase, even in the range of the sensing noise floor and after the cut-off of the PD electronics/acquisition chain; see Figure 2, step LOW_NOISE_1, compared to a good lock of three days ago;
  • in the second half of the shift the noise level decreased and we got good locks as at similar times in the last days; the 150 Hz-ish line is occasionally present in DARM but not at all times, and it can show up or disappear in lock; DARM is most affected by it, with a little cross-talk to MICH/PRCL; it does not show up in the SSFS signals;
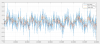
  • what killed most of the locks, which are quite stable and repeatable if not for the following, is a sudden oscillation/glitch at 24 Hz, clearly visible in DARM; it looks like a quick loop oscillation, but it happens also when MICH has a quite low UGF.

These three issues (24 Hz, "150" Hz and 10 kHz) are currently the focus of our investigations.

Images attached to this report
Comments to this report:
mwas - 20:57 Thursday 19 April 2018 (41156) Print this report
About the 10kHz line, it is actually a 10kHz comb, that can be seen in the fully sampled data in raw_full.ffl.
Figure 1, shows the comb, which is at exactly 10kHz (or less than 100mHz away from it), so it is likely to be some digital issue.
Figure 2, there is also a line at 229.22kHz which is a factor few high higher than the 10kHz and is dominating the RMS, so the 10kHz comb is not visible when looking at the data time series.

Too look more closely I have notched 8 of the high lines above 100kHz, and also reconstructed the signal using the amplitude and phase at all the multiples of 10kHz
Figure 3, shows the spectra of the two construction and the original data, the 10kHz comb follows roughly 1/f, which could be explained by a sawtooth signal
Figure 4, shows the time series, after notching the 10kHz wave is somewhat visible with a fast rise and slow decay, and in the pure comb signal the decay looks more like a sine-wave, the rise time is not exactly at the second, but 23us behind.
Images attached to this comment
swinkels - 23:04 Thursday 19 April 2018 (41160) Print this report
The nominal modulation frequency is 6270777 Hz, which when sampled at 500 kHz aliases to abs(f - fsamp * round(f / fsamp)) = 229223 Hz. We should study the fast samples of B4 before demodulation, to see which sideband is the real culprit.

One potential source for the 10 kHz comb might be the SSFS_Ctrl process, where some signals are up-sampled from 10 kHz to 500 kHz.
Search Help
×

Warning

×