Algorithm to calculate the frequency:
-take data of B1_PD2_Audio at 20 kHz, multiply with a complex sine at 7810 Hz and decimate to 20 Hz.
-collect 100 seconds of down-sampled data and take an FFT, zeropadded by a factor 4.
-calculate the averaged PSD using 5 half-overlapping windows.
-find the maximum for every peak in a predefined region, and estimate the exact peak location using quadratic interpolation. This works well for the large peaks, but not necessarily for the smaller ones.
These parameters might have to be tuned a bit. With some more averaging, we can hopefully measure the peak positions with milli-Hertz resolution. Given a calibration of 0.77 Hz per Kelvin for the drum-mode and 0.3 Kelvin per fringe, this should yield a resolution of slightly better than 1/100 of an etalon fringe.
-the height of the peak is calculated as the BRMS in the region of interest
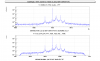
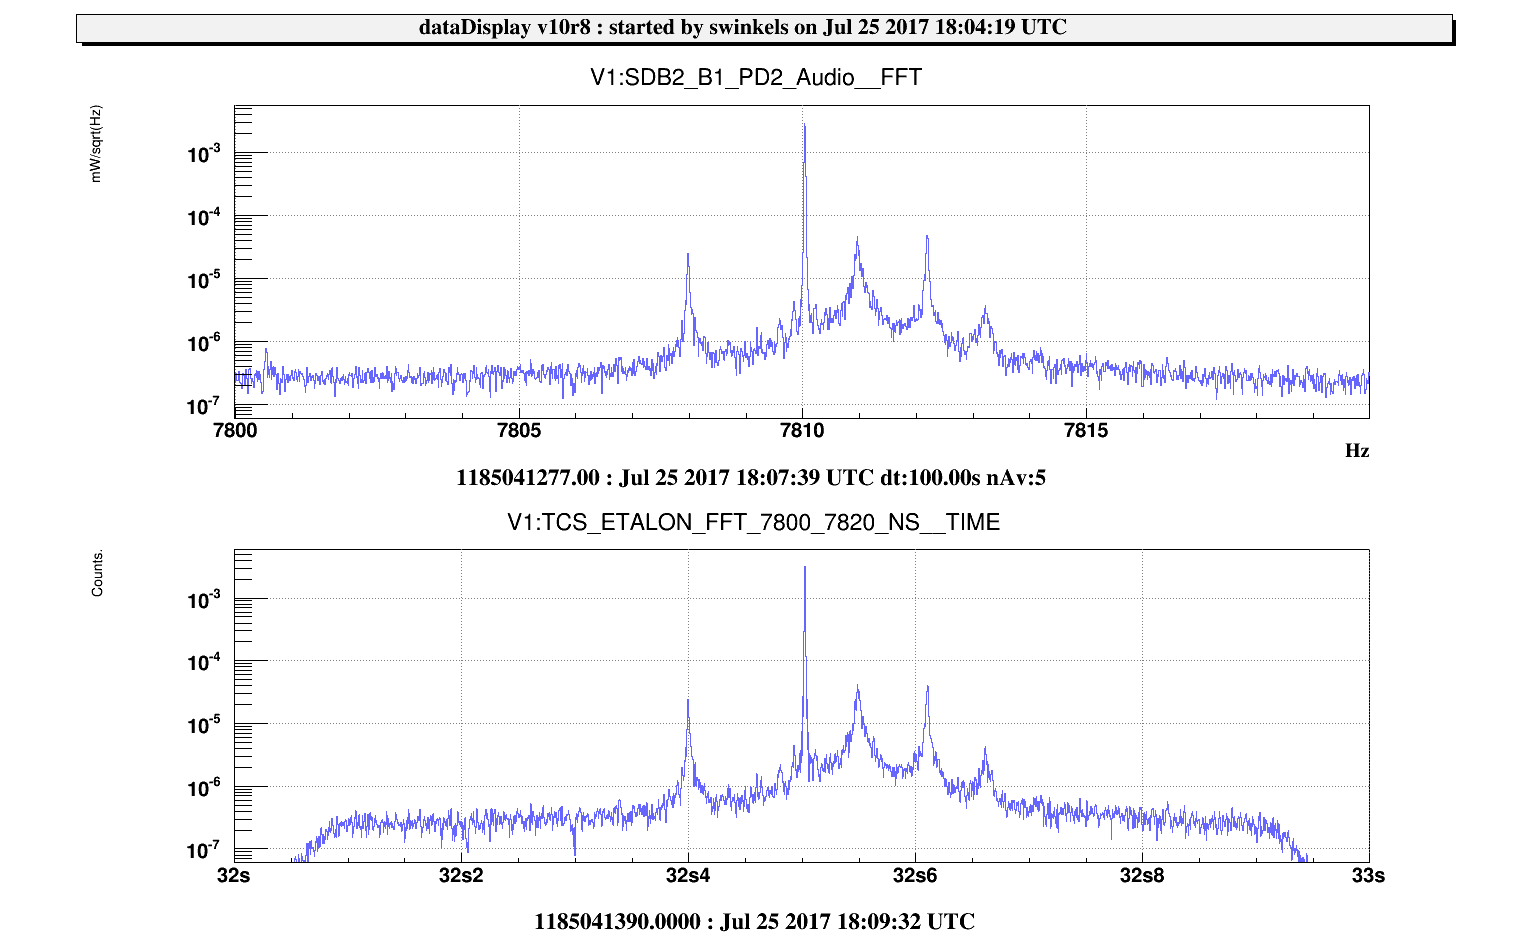
Fig 1 compares the spectrum calculated by the server (which is available as a debug channel that is not stored to disk) and the real spectrum of B1_PD1. These should be equal within the pass-band of the decimation filter. The peaks at 7808 and especially the one at 7810 Hz do get excited a bit during a lock acquisition, so they are likely mirror modes. The one at 7812 Hz has been identified as belonging to the WE. The two remaining peaks at 7811 and 7813 Hz seem to have a bit lower Q. These might indicated the unexpected splitting of the modes of a single mirror, which we have seen before. It would be good to switch on the ring heaters of the NE/NI/WI mirrors for a short period as soon as possible, so that we know who is who during the science run.
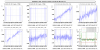
Fig 2 shows the frequency and amplitude of the peaks during a few locks of last night. Note that the frequency of the lines is stored as an offset to the demodulation frequency of 7810 Hz, to not lose any information by rounding to single-precision floats.
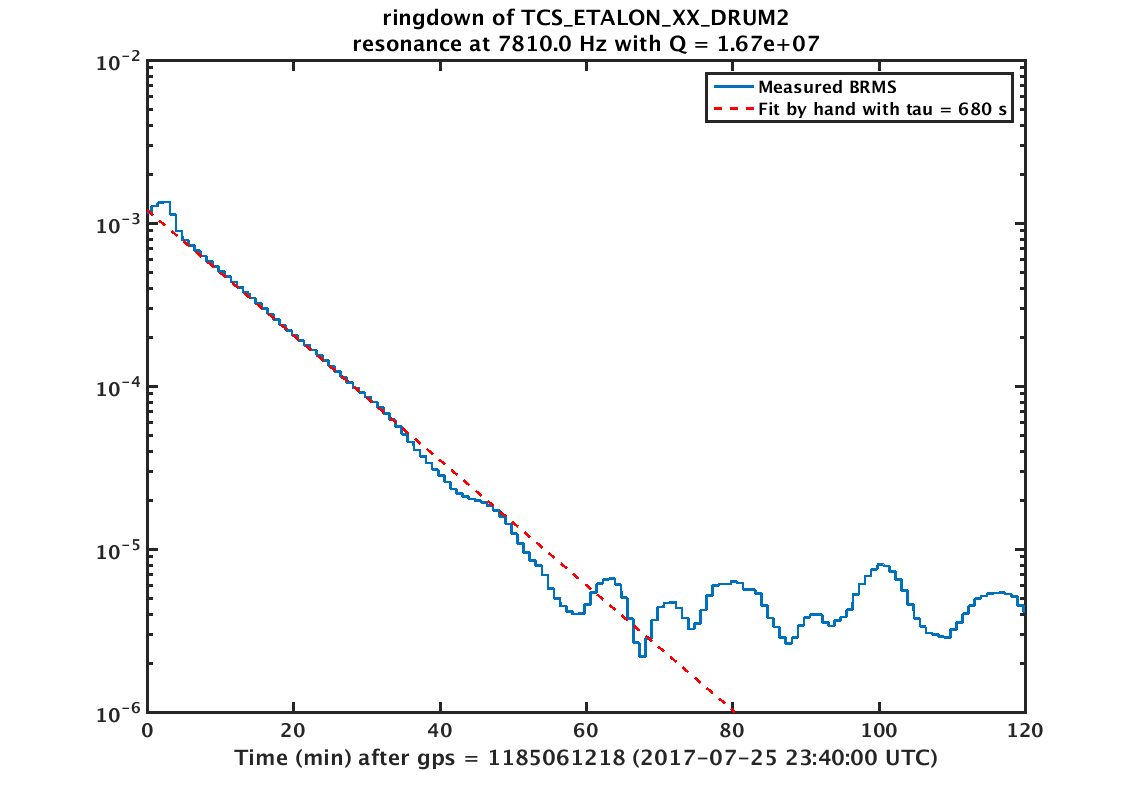
Fig 3 shows the ringdown of the strong line at 7810 Hz. Using Q = pi * tau * f, a Q of 1.7e7 is obtained.
