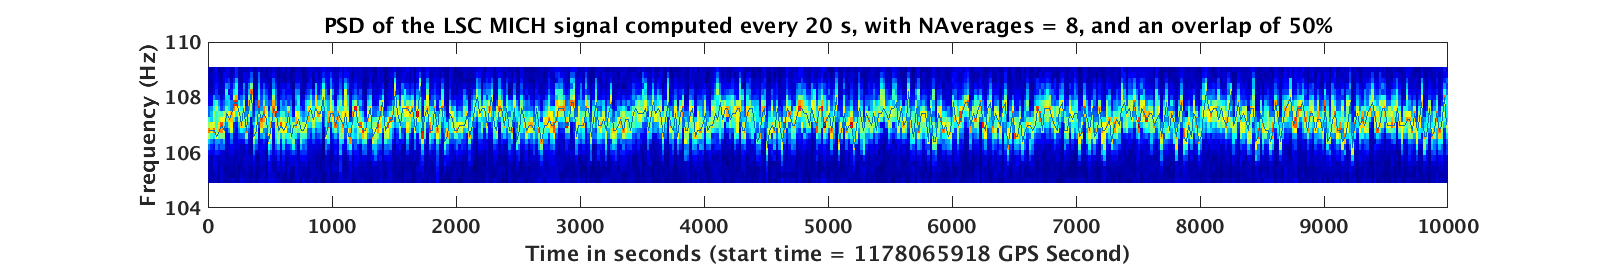
Figure psdtrend.png shows the PSD computed for a 10000 second stretch of data, during a good lock period, and the trend of the noise is picked.
Steps to compute the trend-
1) PSD is computed in 20 second windows with 8 averages and an overlap of 50 %
2) The peak frequency from the PSD is extracted in the frequency band 105-109 Hz for every 20 second window.
3) The resulting trend of the peak frequency that is extracted has a sampling frequency of 0.05 Hz.
4) The peak frequency of this trend is observed around 0.0017 Hz, or approximately has a cycle length of 600 s.
5) For getting this low frequency trend out, a low pass equi-ripple FIR filter with a corner frequency of 0.0035 Hz is applied to the trend.
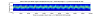
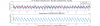
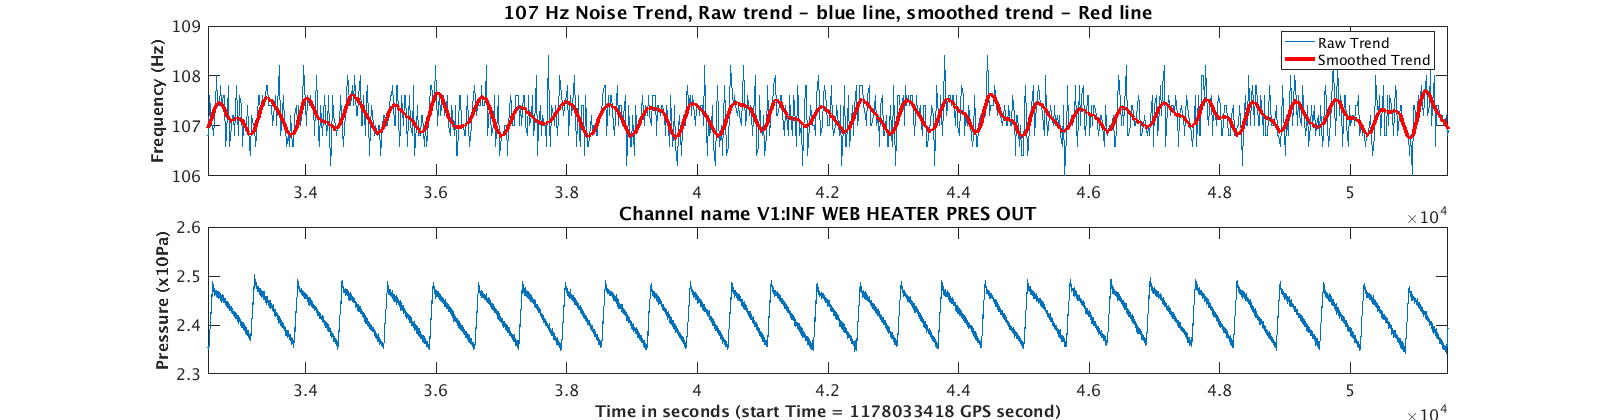
freqtrendandheaterpresout.png subplot(1) shows the smoothed trend in red and the raw signal with high frequency noise in blue.
The smoothed trend was henceforth subject to cross correlation analysis, for obtaining a dependence with several other channels.
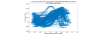
A total of 14000 channels were tested against the observed trend.
A good correlation was observed for a period of 19000 seconds with the pressure variation of the channel named as V1:INF_WEB_HEATER_PRES_OUT. Figure 3 attached shows a scatter plot of the two quantities, which is frequency vs the pressure. An approximate linear dependence was observed.
For further verification of whether the WEB_HEATER pressure changes was responsible for the noise, we propose to switch it off for an hour or so, and observe if the 107 Hz noise pattern changes.