Reports 1-1 of 1 Clear search Modify search
Detector Characterisation (Spectral lines)
direnzo, tringali - 15:12 Wednesday 17 April 2024 (64000) Print this report
Sideband structure around the 50 Hz mains line

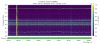
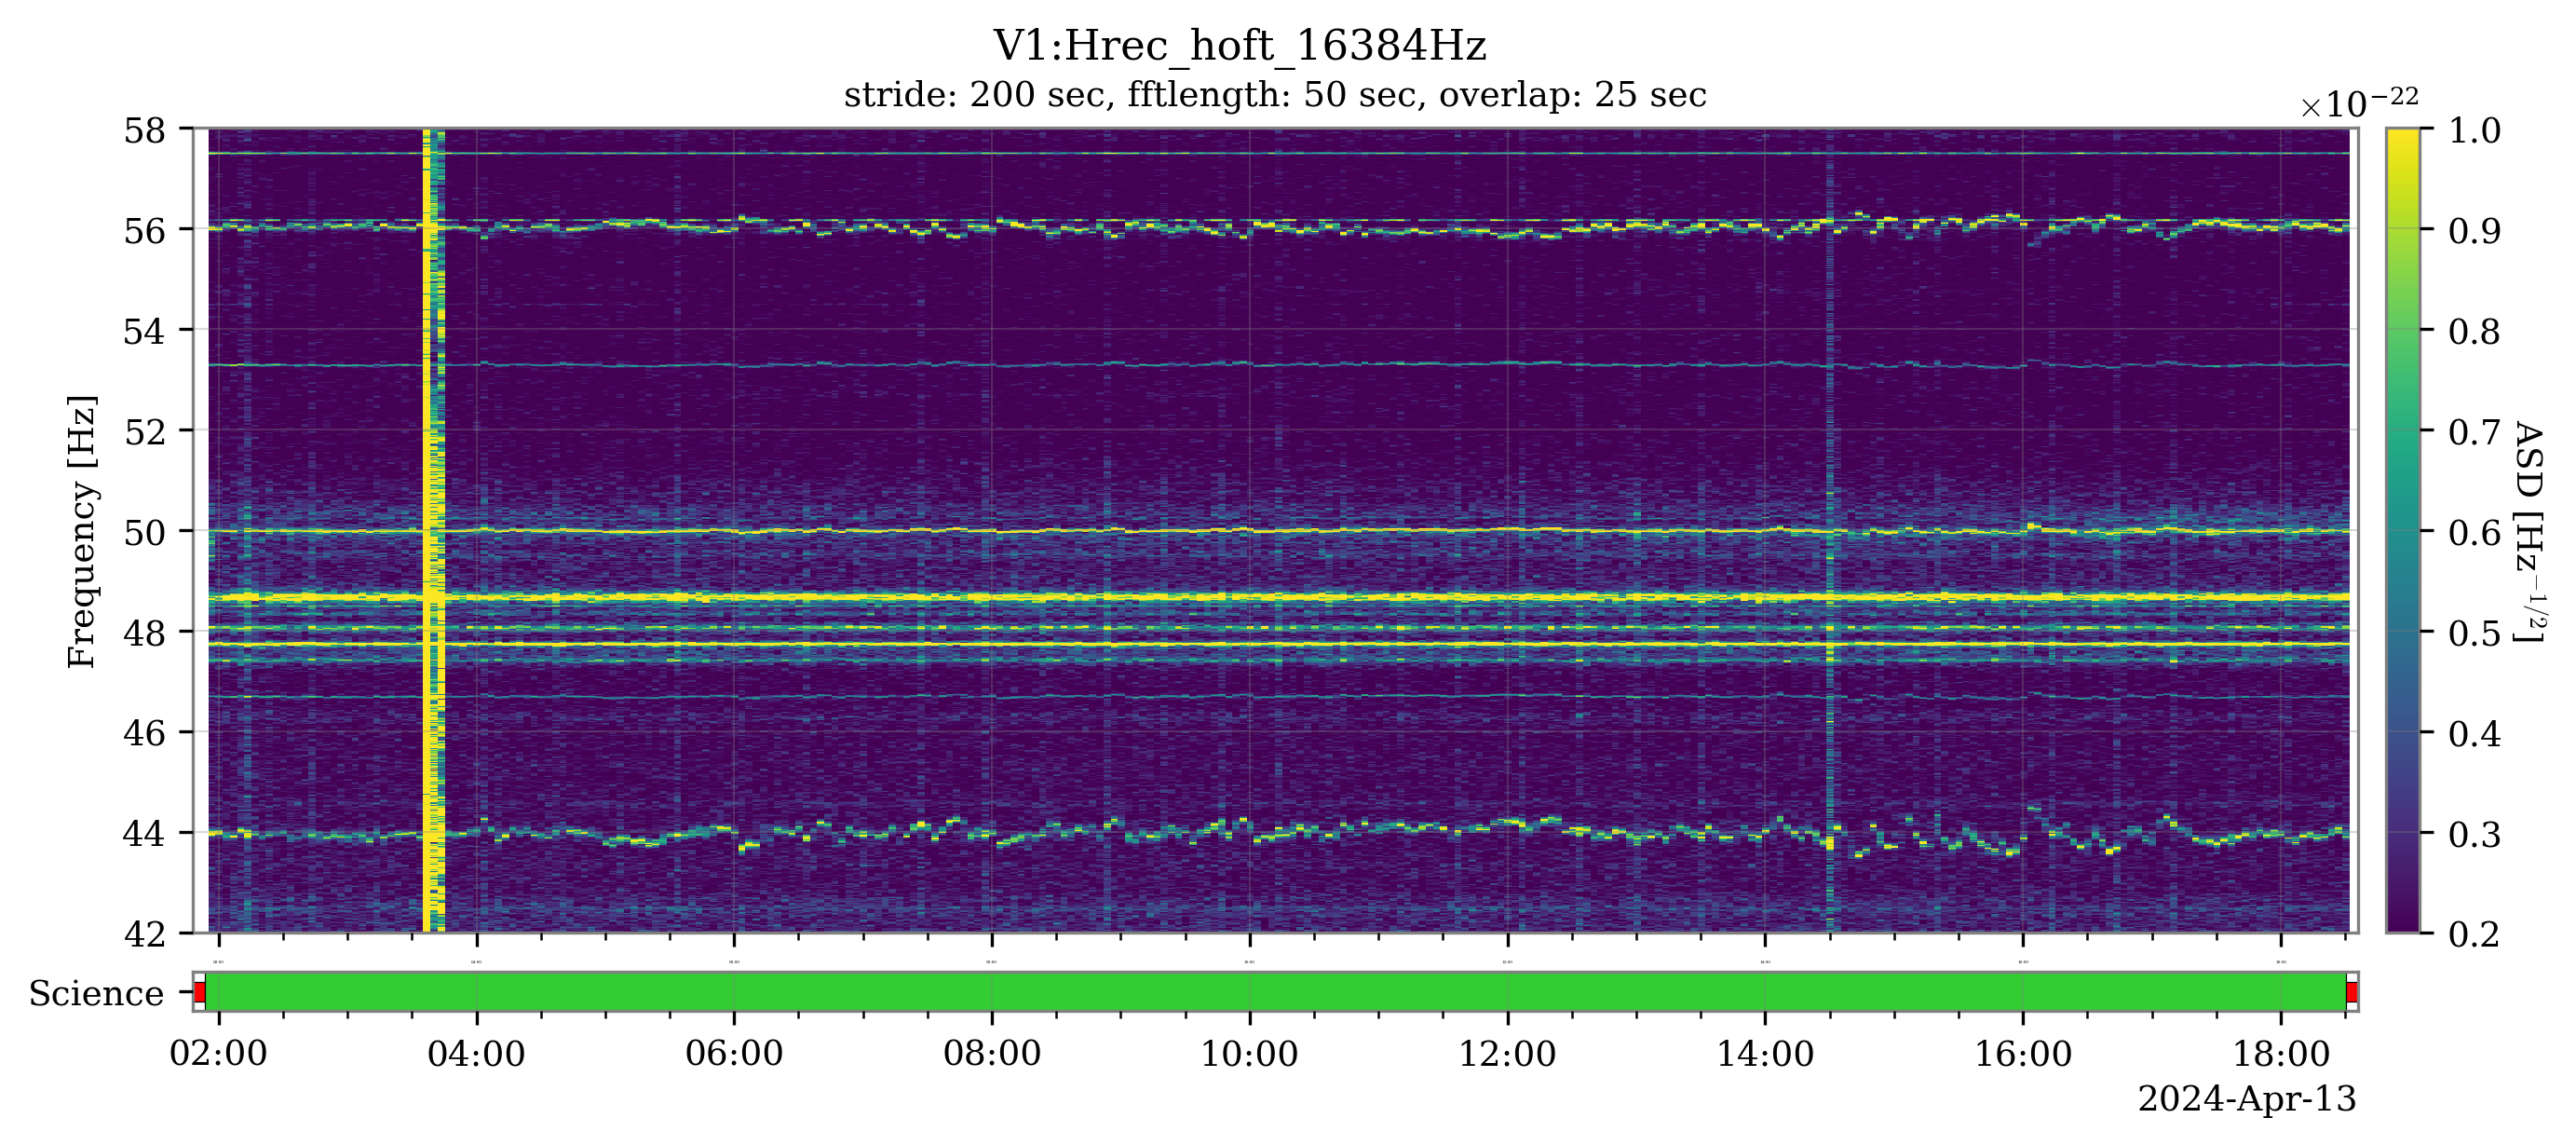
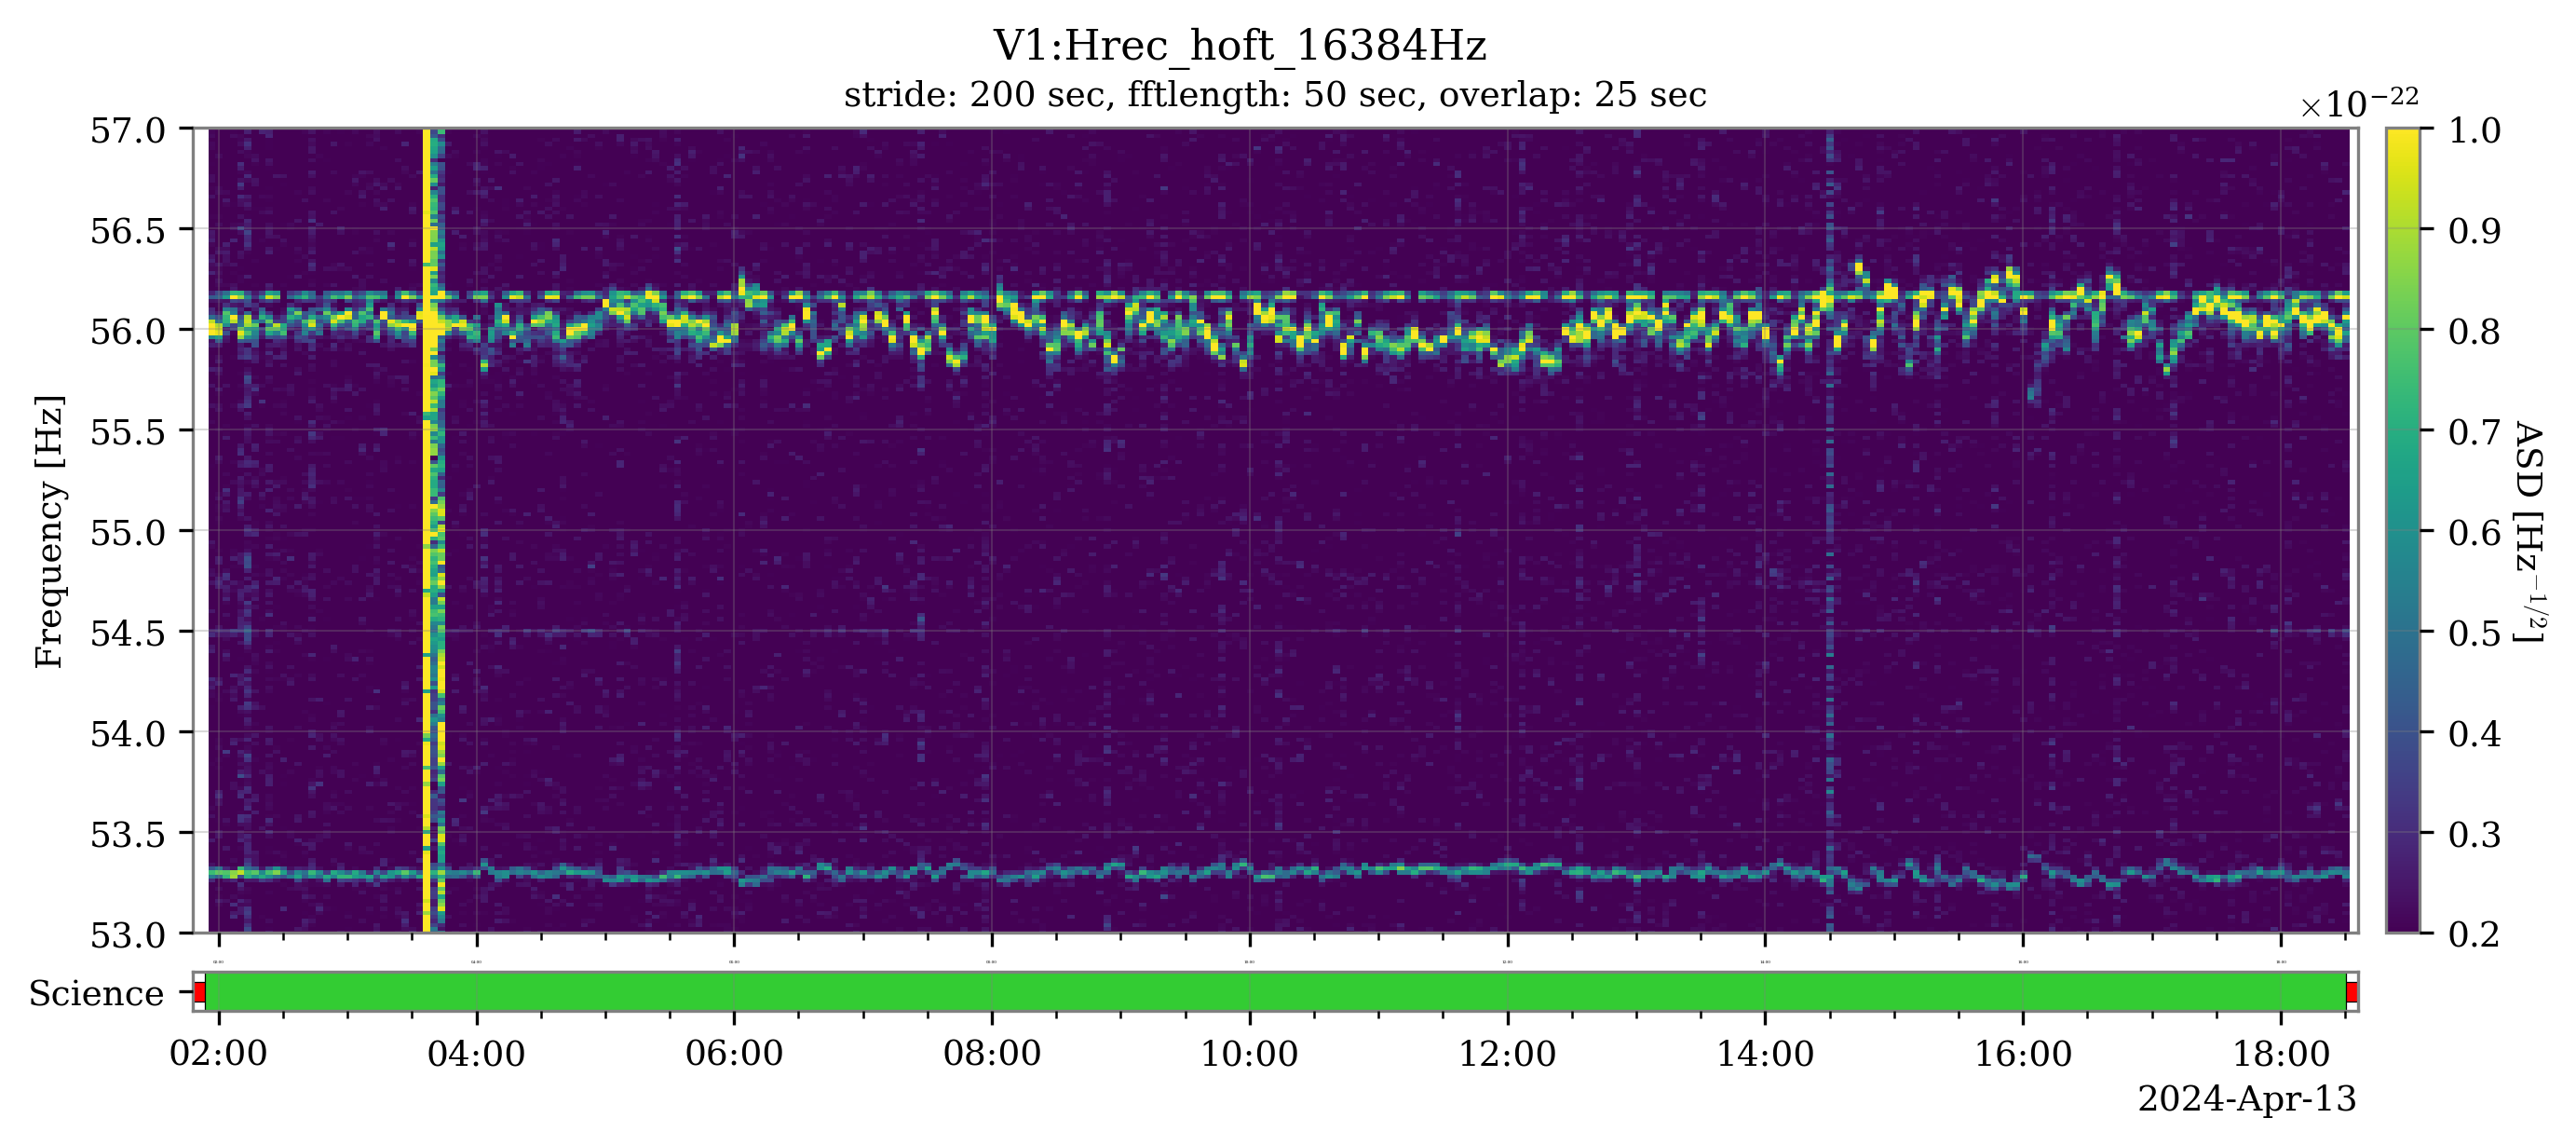
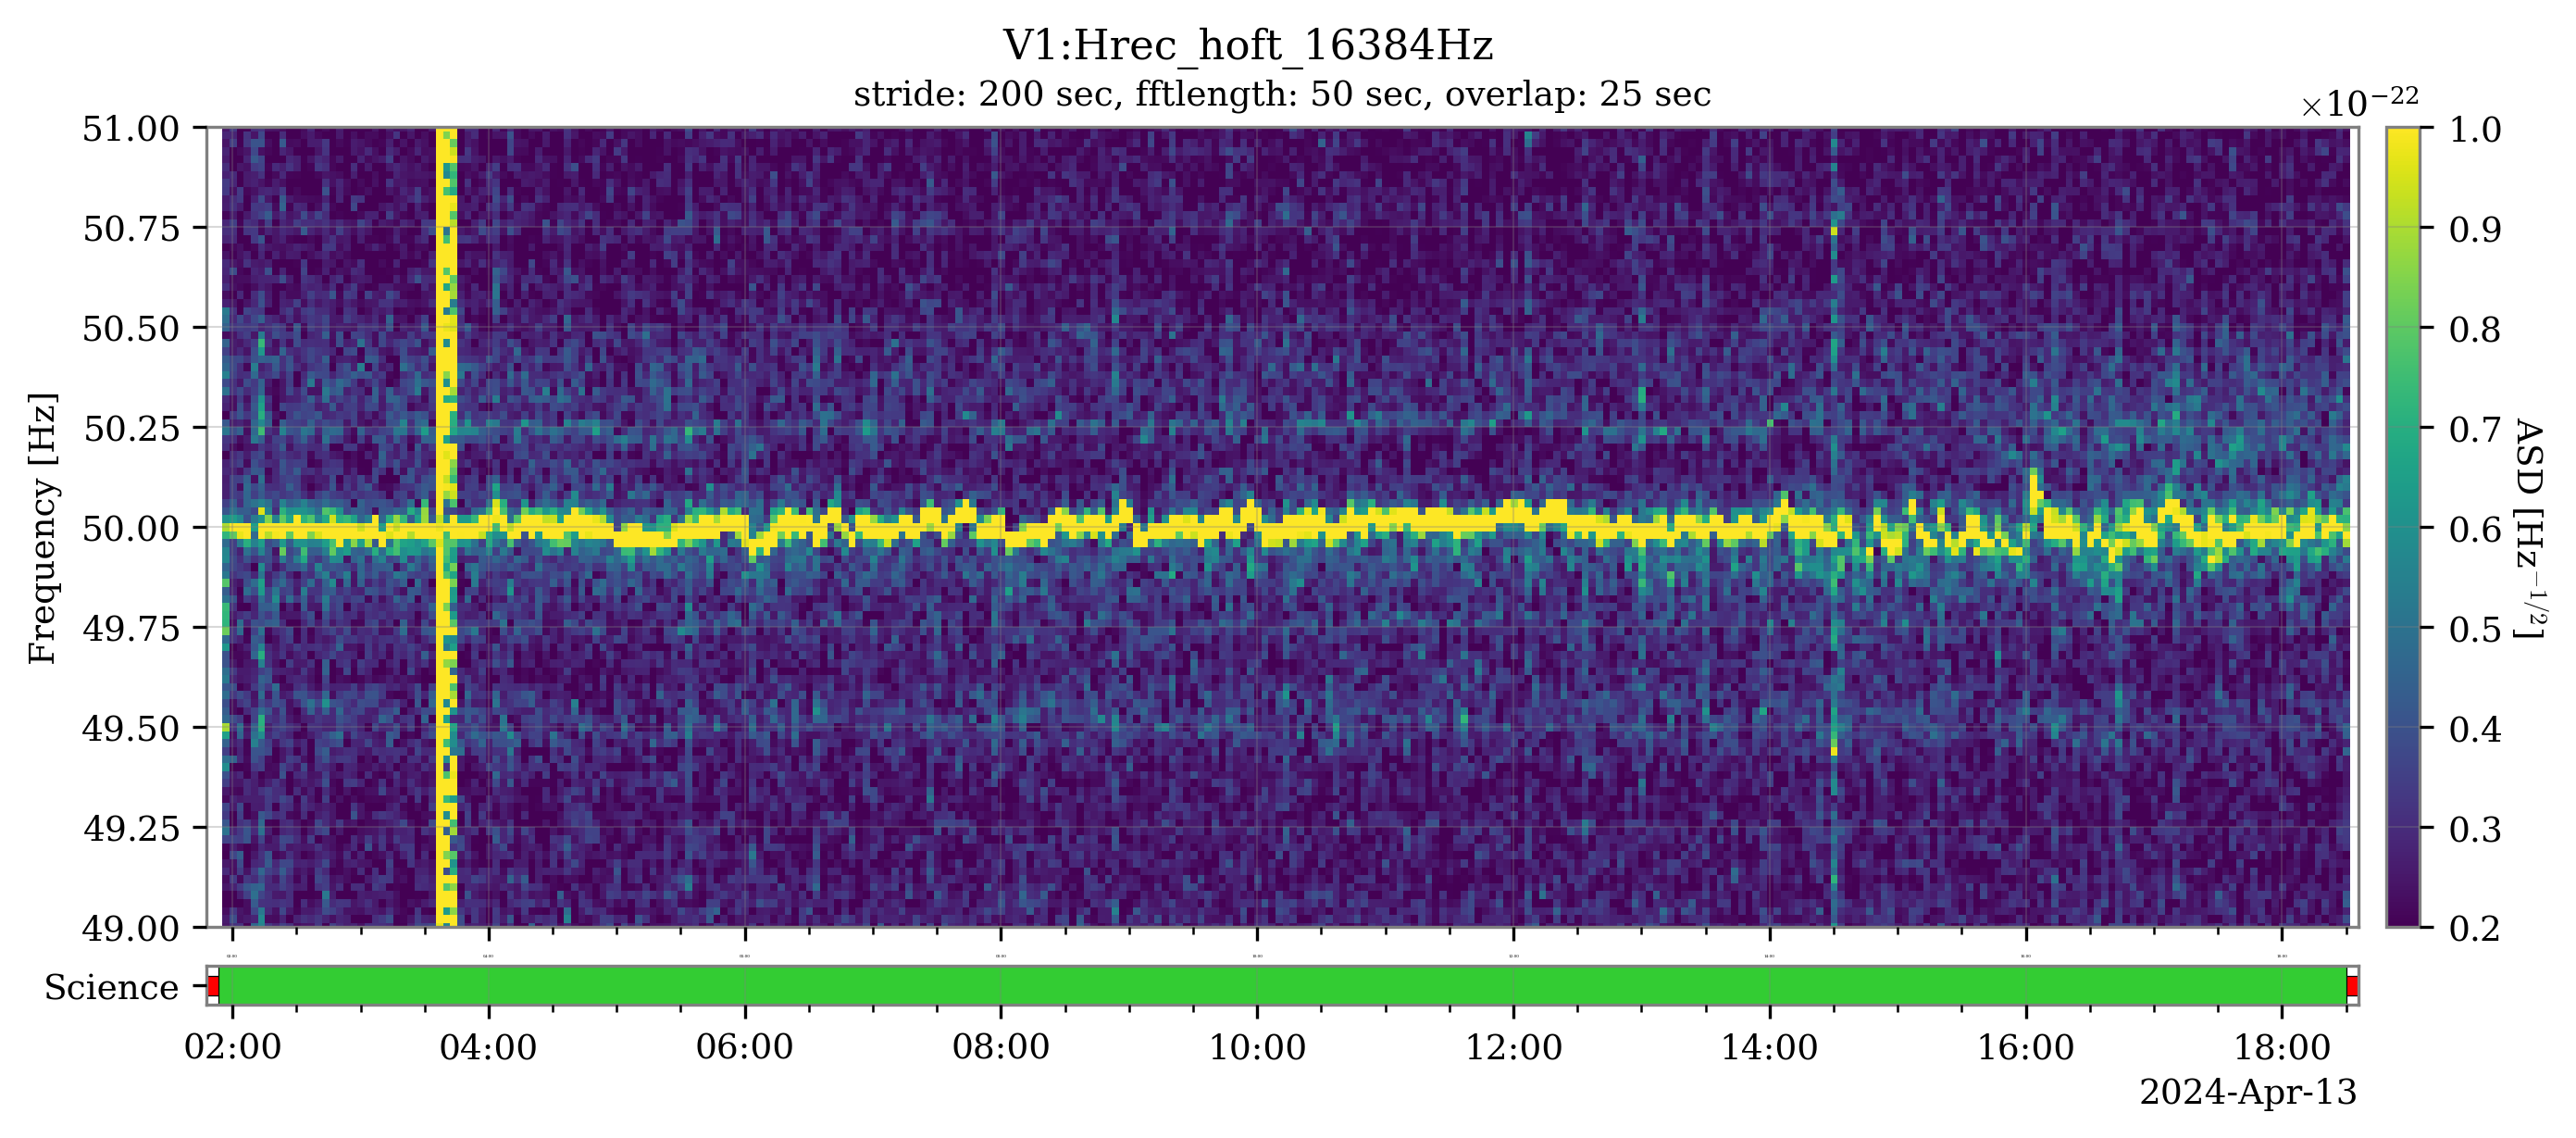
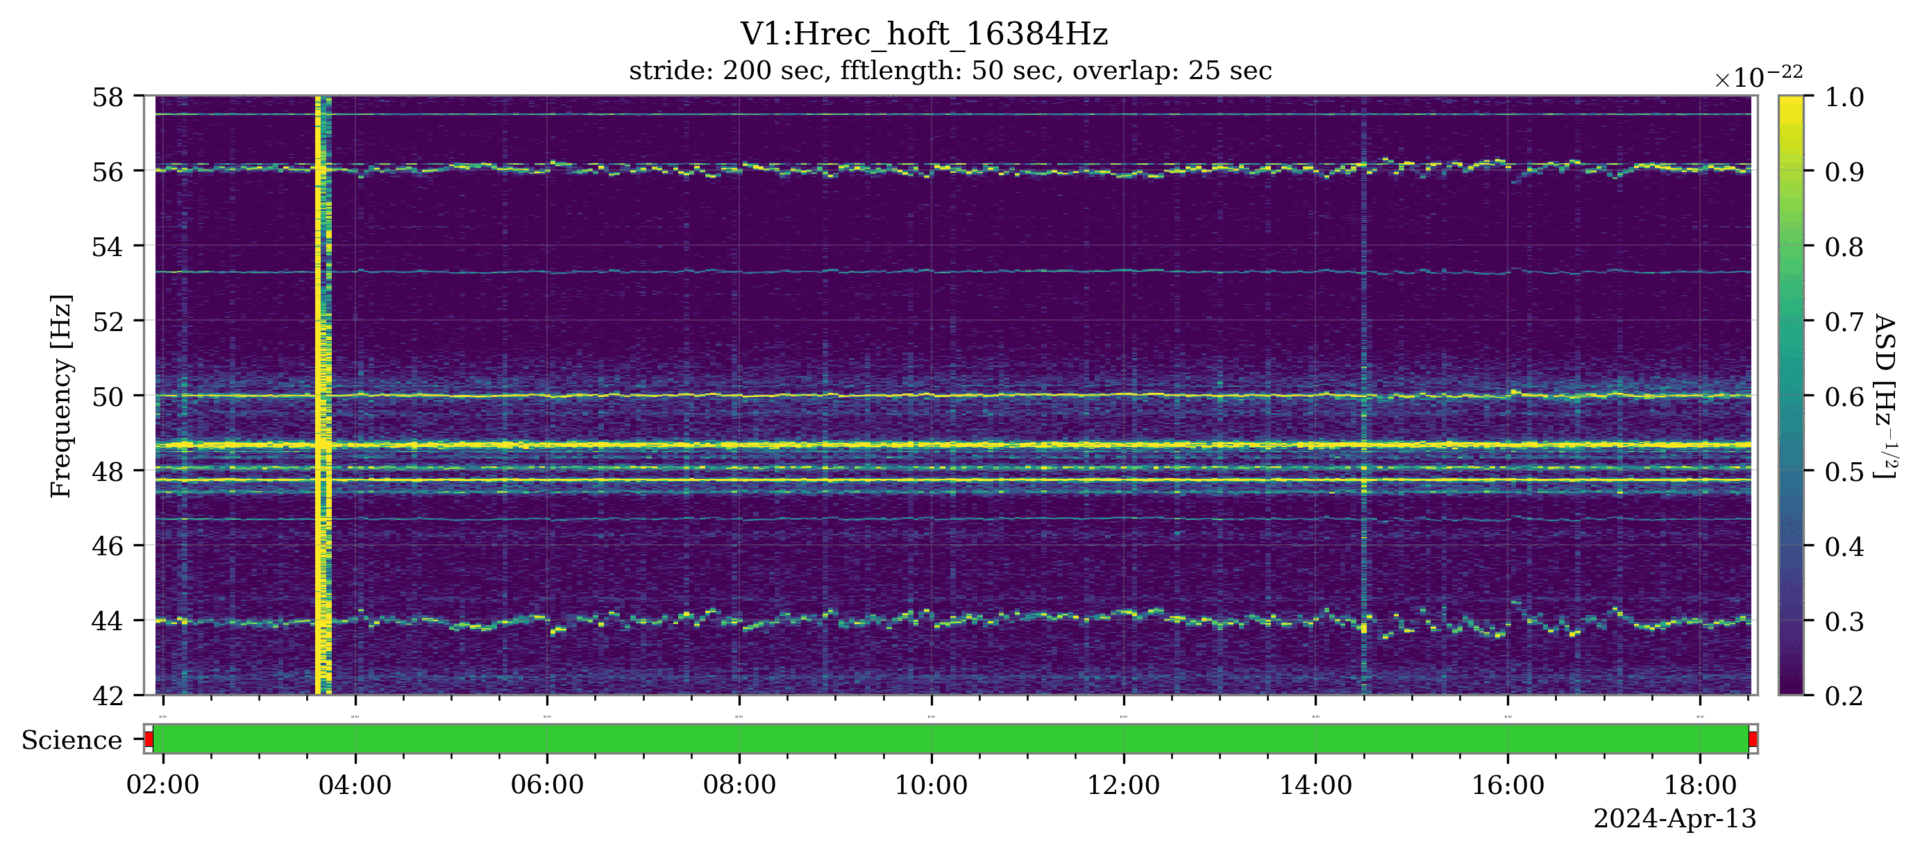
Continuing the investigation of the spectral noise on the first week of O4b data, we found an interesting structure of "wandering sidebands" around the 50 Hz line. (S

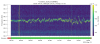
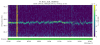
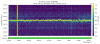
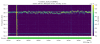
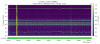
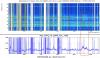
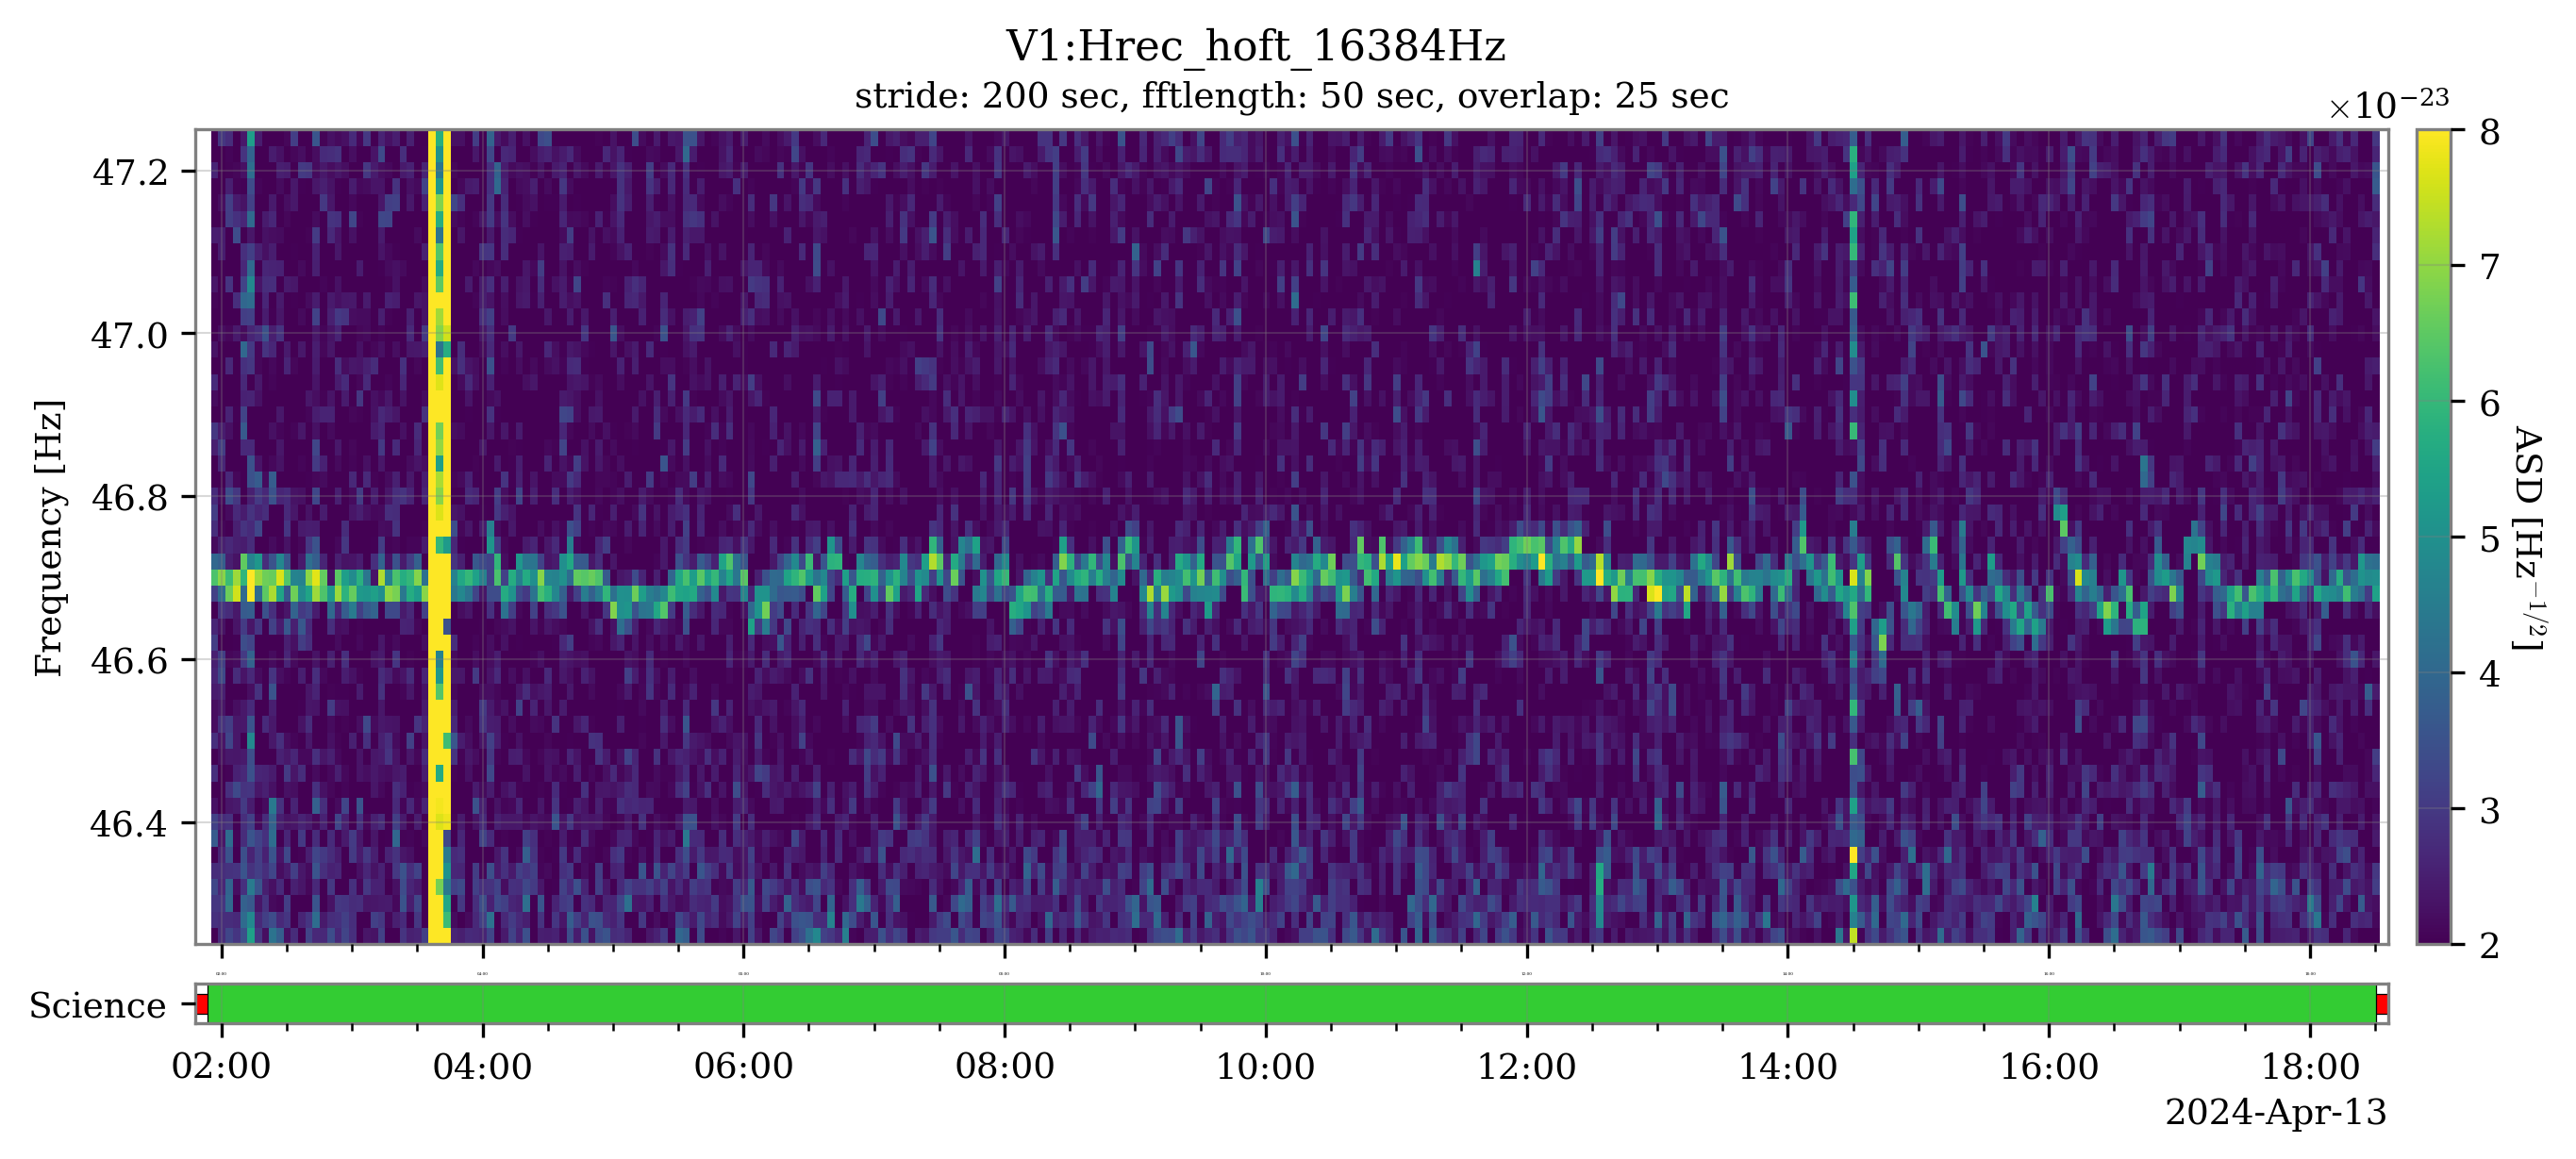
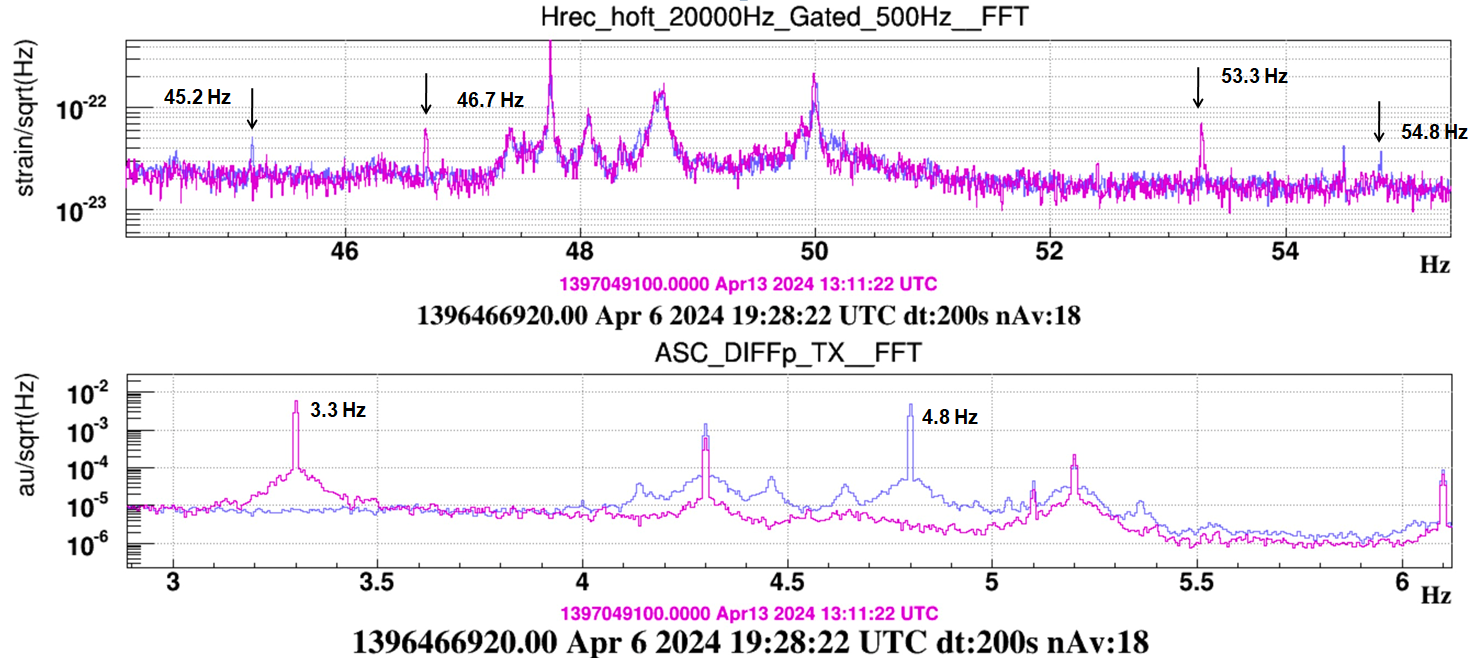
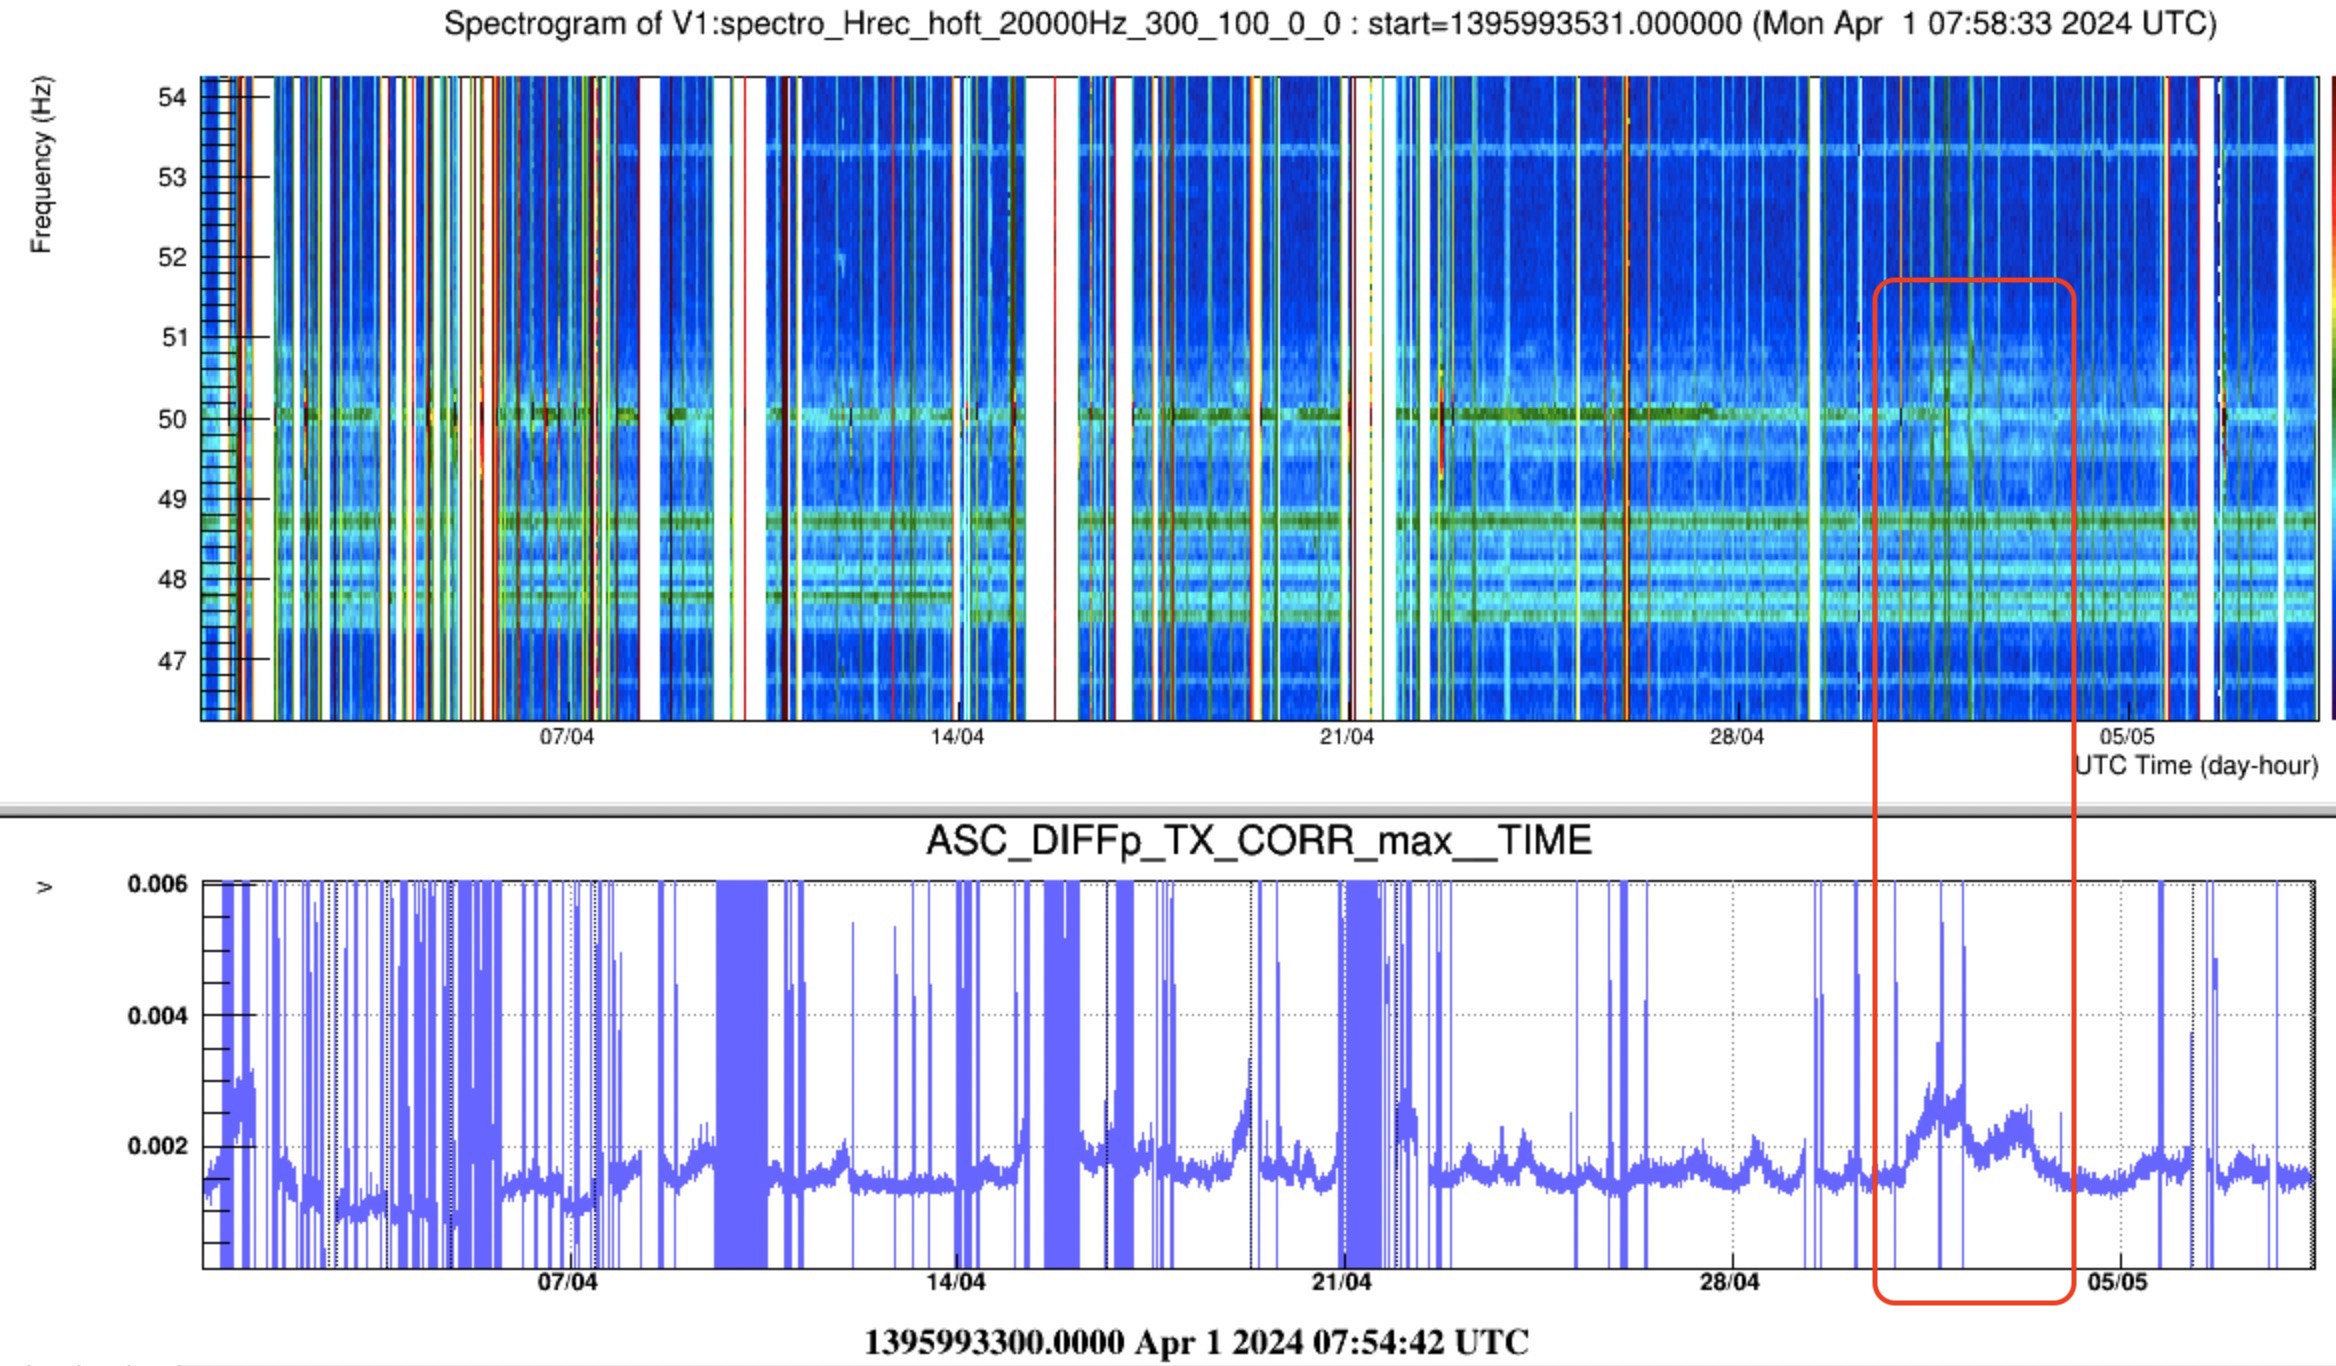
Figure 1 shows the spectrogram in the region 42-58 Hz around the frequency of the electric mains. Two pairs of wandering sidebands are visible at 44 (Figure 2) and 56 Hz, and at 46.7 (Figure 3) and 53.3 Hz (Figure 5).

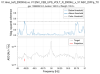
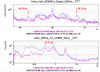
The oscillations in frequency, especially those of the 44 and 56 Hz lines, are the same as those of the 50 Hz line (Figure 4) but enlarged by many (~20) times: ~0.50 Hz vs ~0.025 Hz

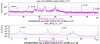
Additionally, taking advantage of a couple of glitches present in the analyzed data period (the vertical lines), we notice that the 44 and 47.3 Hz lines are synchronous with the 50 Hz line. Also, the 53.3 Hz line seems to have the same phase, while the one at 56 Hz is flipped vertically: Figure 5.

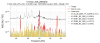
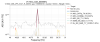
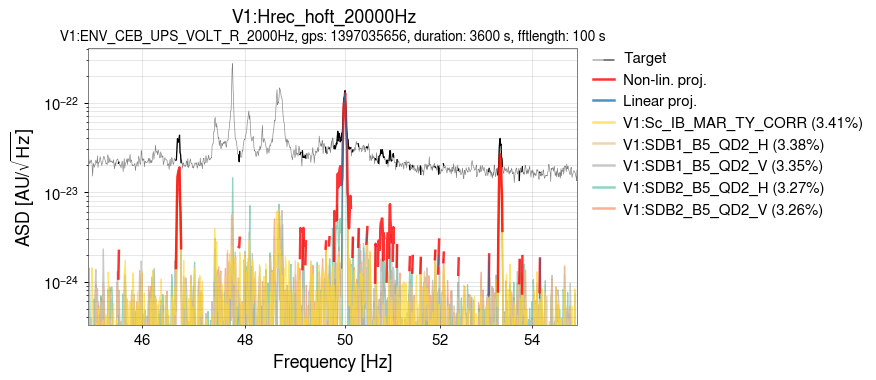
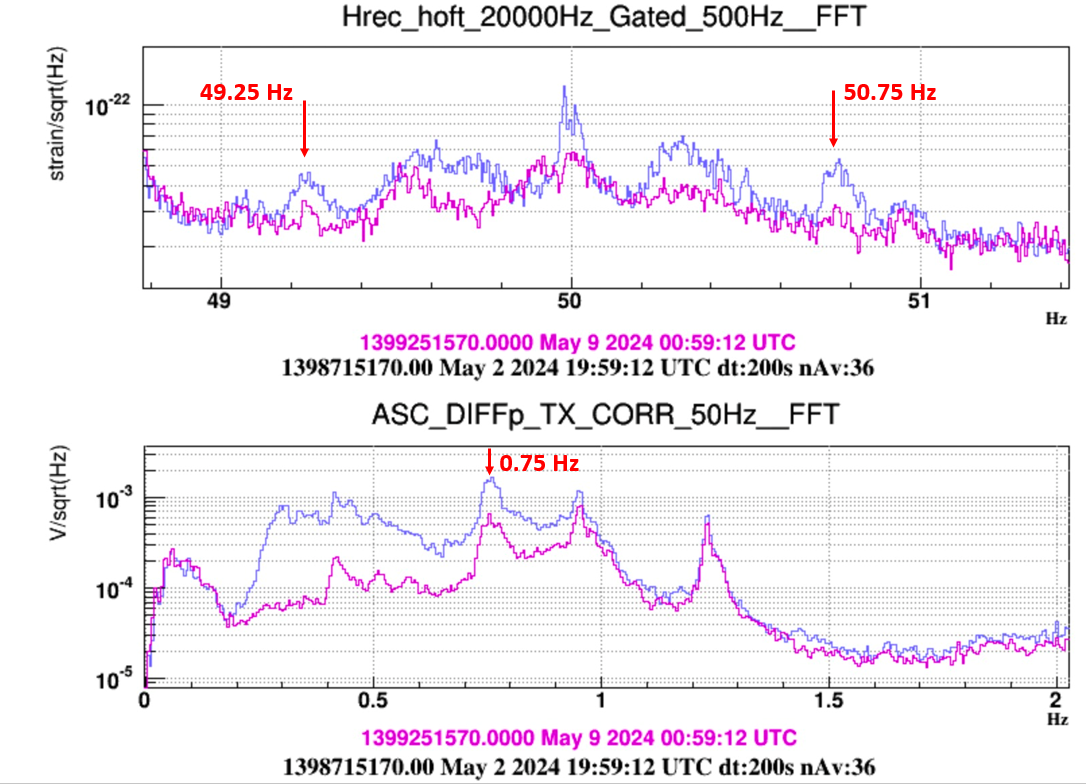
The search for bilinear couplings with MONET highlighted that the 46.7 and 53.3 Hz sidebands are produced by the modulation of the mains line (ENV_CEB_UPS_VOLT_R_2000Hz) and the ASC_DIFFp_T{X,Y} angular control channels: Figure 6 and text file.

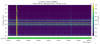
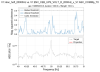
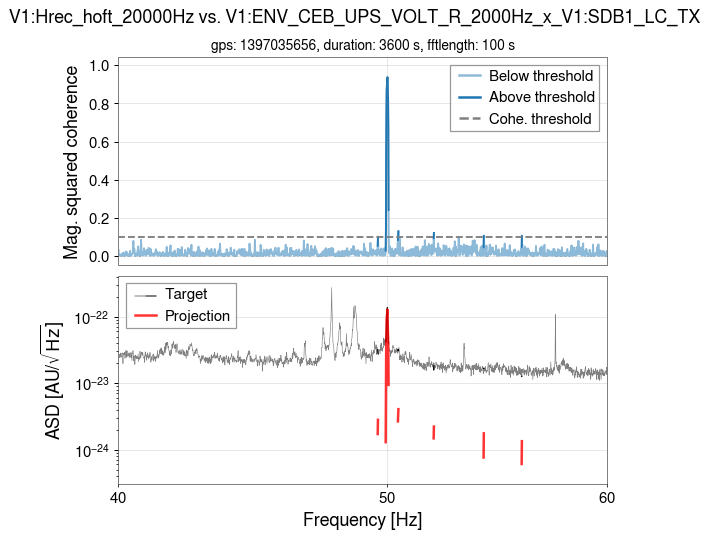
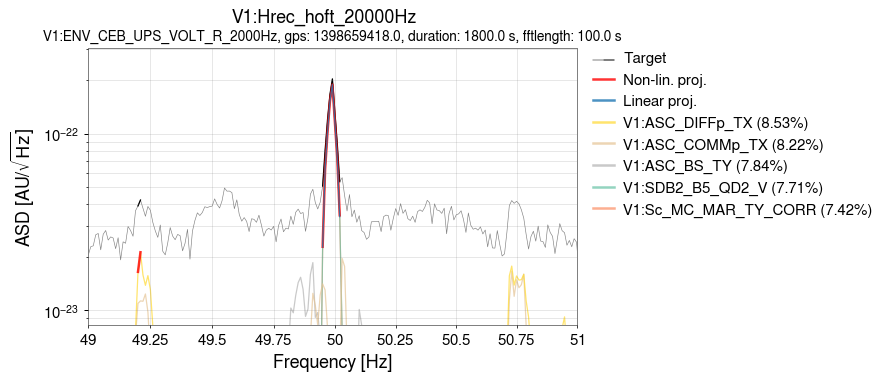
A barely negligible coherence has been found for the lines at 44 and 56 Hz; just a 0.1 with SDB1_LC_TX at 56 Hz: Figure 7. This could be a consequence of the large variations in the frequency of the line, which dilute the cohere over multiple frequency bins and, averaged gets small.

Of course, the same structure is present around the other harmonics of the 50 Hz line.

Images attached to this report
Non-image files attached to this report
Comments to this report:
Tringali, Spinicelli, Fiori - 18:11 Thursday 18 April 2024 (64018) Print this report

As Piernicola confirmed, the sidebands at 46.7 Hz and 53.3 Hz are the beating between 50 Hz and DIFFp_TX line at 3.3 Hz (purple curve).
Indeed, when the DIFFp_TX line was set to 4.8 Hz, there were two sidebands at 45.2 Hz and 54.8 Hz, respectively (blue curve).

Images attached to this comment
direnzo - 18:33 Friday 19 April 2024 (64035) Print this report

ERRATA CORRIGE: the sidebands at 44 and 56 Hz are non-physical. These are just an aliasing artefact, consequence of an improper chunk-by-chunk downsampling to produce the resulting spectrogram.

Figure 1: fixed version of the spectrogram in the range 42-58 Hz.

Figure 2: animated GIF that compares the correct spectrogram and the wrong one in the main entry.

Images attached to this comment
direnzo - 16:30 Friday 10 May 2024 (64225) Print this report

The 50 Hz sidebands at \pm0.75 Hz are modelled by the bilinear coupling of ENV_CEB_UPS_VOLT_R_2000Hz and ASC_DIFFp_TX, as visible in the daily MONET results of May 2. The modulator ASC_COMMp_TX produces interesting structures too, although just below the default coherence threshold set on the daily MONET analysis.

Images attached to this comment
Tringali, Fiori, Mantovani - 17:15 Friday 10 May 2024 (64223) Print this report

Looking at the spectrogram of Hrec since April 1st, we noticed an increase of a sideband noise around the 50 Hz during May 2nd-4th, Figure1 (top). It seems to be correlated to a decrease of accuracy of DIFFp_TX (bottom).

As in #64018, in Figure 2 we observe two couple of sidebands probably due to a beating between the 50 Hz and DIFFp_TX at  ±0.75 Hz and ±0.42 Hz (roughly).

A residual of these sidebands seems often present: purple curve of Figure 2 and spectrogram in Figure 1.

Images attached to this comment
Search Help
×

Warning

Error

The present report has been modified outside this window. Please check for its integrity in the main page.

Refreshing this page will move this report into drafts.

×